Dashboard release notes
We’re constantly improving the Parse.ly dashboard by adding new features, refining existing ones, and eradicating bugs. This is a record of changes our customers see in the dashboard.
Check back here for updates or look for product announcements on our blog.
July 12, 2024
Video metrics are now available on the Overview page
In addition to easily tracking page views or conversions at a glance, you can now easily see how your videos are performing.
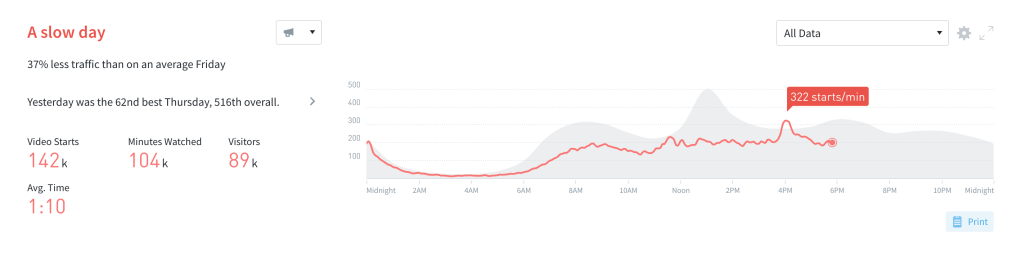
To enable this view, go to Overview settings (the cogwheel in the top right corner), click “Summary & Timeline”, and then choose your “Timeline Metric”.
June 20, 2024
Notice
We will be switching to a new CDN system, and as part of this upgrade, we will no longer support TLS v1.0 and v1.1 protocols. This change will be effective immediately. Our analysis indicates that this change will impact approximately 0.0008% of our traffic.
Please see https://docs.parse.ly/servers-and-infrastructure/ for more details and contact support@parsely.com if you have questions.
Bug Fixes
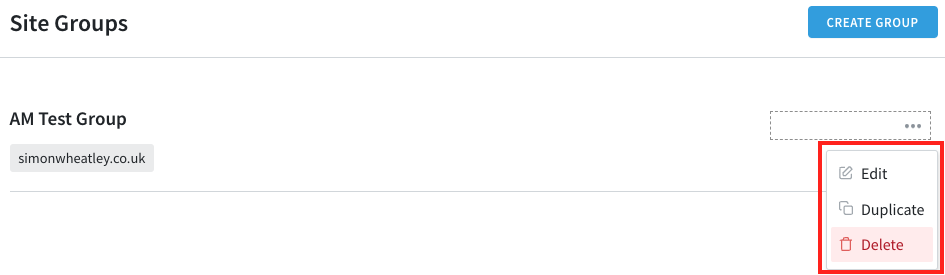
- Resolved an issue where Safari users could not see the dropdown ellipsis on the Site Groups page
June 12, 2024
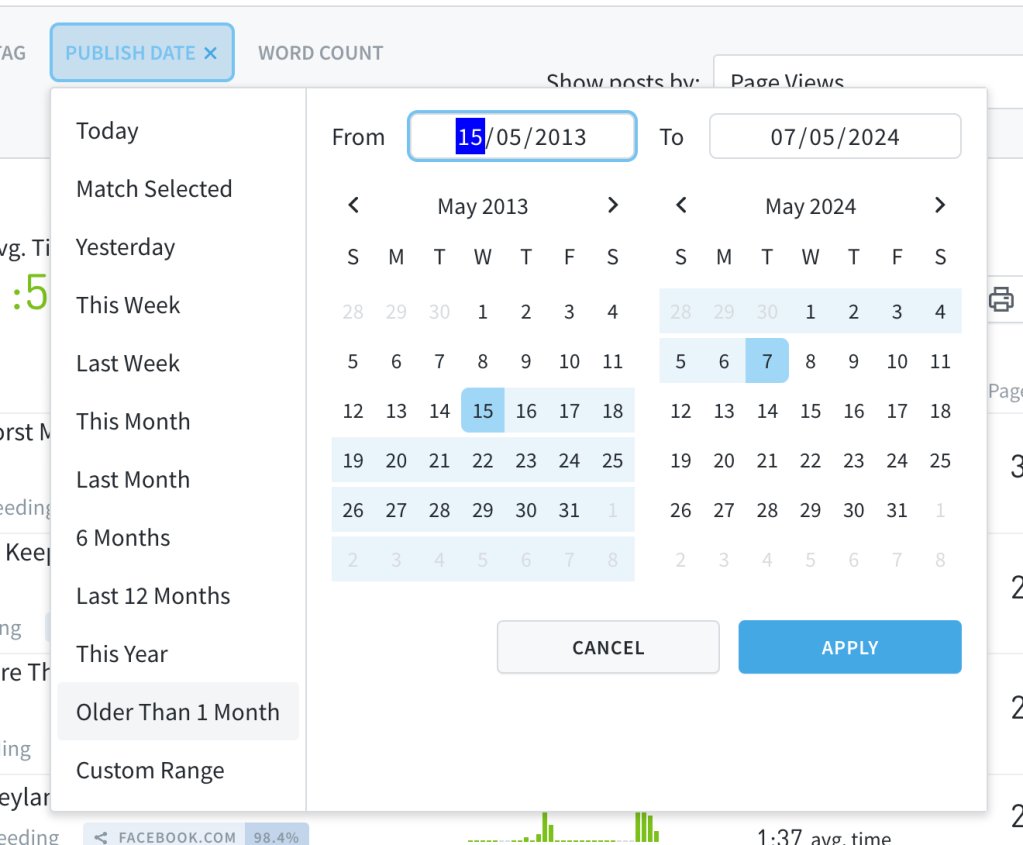
New Preset in Updated Publish Date Filter
We added the Older Than 1 Month preset to the updated Publish Date filter to help you easily discover evergreen posts or posts with renewed attention.
Bug Fixes
- Resolved an issue where the Match Selected period in the updated date filter didn’t work correctly when applying a Publish Date filter during report generation.
- The date filter now shows the selected preset as the active preset instead of the custom range preset.
- Fixed an issue where the Content Syndication section on a post details page didn’t display for copy posts.
June 5, 2024
Updated Date Filter
We updated our date filter so that it’s easier to navigate and customize the date ranges you are searching for in our dashboard. The calendar view displays by default and we added Last 12 Months and This Year as default presets that you can filter data by.

Updated Path Filter
We updated our path filter so that it’s easier to navigate and customize the URL paths you are searching for in our dashboard.

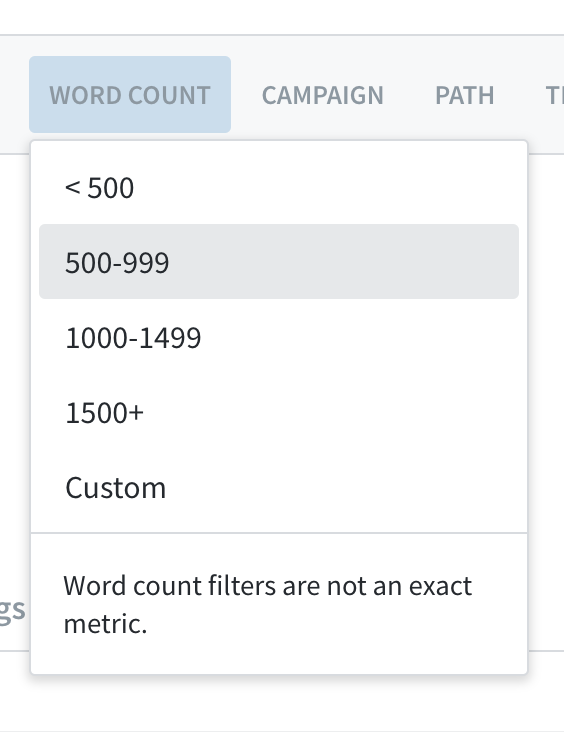
Custom Word Count Filter
You can now create your own custom word count filter! Decide what word count range you want to filter by and see the results sorted accordingly in your Parse.ly dashboard.

Bug Fixes
- Resolved an issue where dashboard views with a path filter would not export.
- Fixed an issue where reports and exports trying to exclude campaigns was doing the opposite.
May 15, 2024
Bug Fixes:
- Fixed an issue where pages with no views were showing referrer and channel traffic — how confusing!
- Resolved an issue where a customer’s preferred default sort metric was not being shown when navigating to parts of the Parse.ly dashboard, like a post detail page. And when no default metric has been specified we will defer to page views.
- Updated the experience with Check Metadata so that while we are checking for updates a customer cannot re-select the button. This way customers know to wait for us to finish checking before attempting another check.
May 9, 2024
Bug Fixes:
- Added missing fields in the meta exports when sorting on conversions
- Redesigned Post Info header and export buttons
May 2, 2024
Improved UI for modals
You will now see better UI for modals when creating or editing goals and in other areas of the dashboard where modals are displayed.
April 24, 2024
Bug Fixes:
- Resolved an issue where conversions on a second page of conversion performance results (conversion events 51-100) were being listed as conversions 1-50
- Resolved a page layout issue where conversions and engaged time metrics were displaying poorly
March 14, 2024
Bug Fixes:
- Conversion type filter not filtering by type on conversions listing.
- Dash error on videos when selecting average watched.
- Date conversion on compare over time report causing some reports to fail.
March 6, 2024
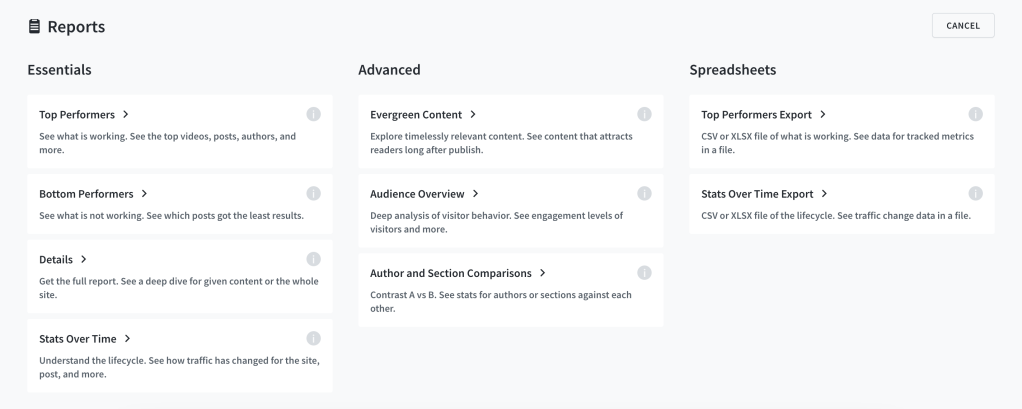
Update to create report layout and descriptions
We’ve updated the layout and report descriptions for the ‘create report’ view to enhance clarity before clicking. The category label ‘Basic’ has been changed to ‘Essentials’, and sample reports linked to specific reports have also been updated.
February 28, 2024
We discontinued Twitter shares and Twitter average referrals
Effective today, we will no longer display Twitter shares and Twitter average referrals in Parse.ly analytics. This change also applies to any scheduled reports containing Tweets/Twitter Interactions. Twitter referral data will remain available in all other areas. This is related to work we began last spring. Read our blog post to learn more.
January 25, 2024
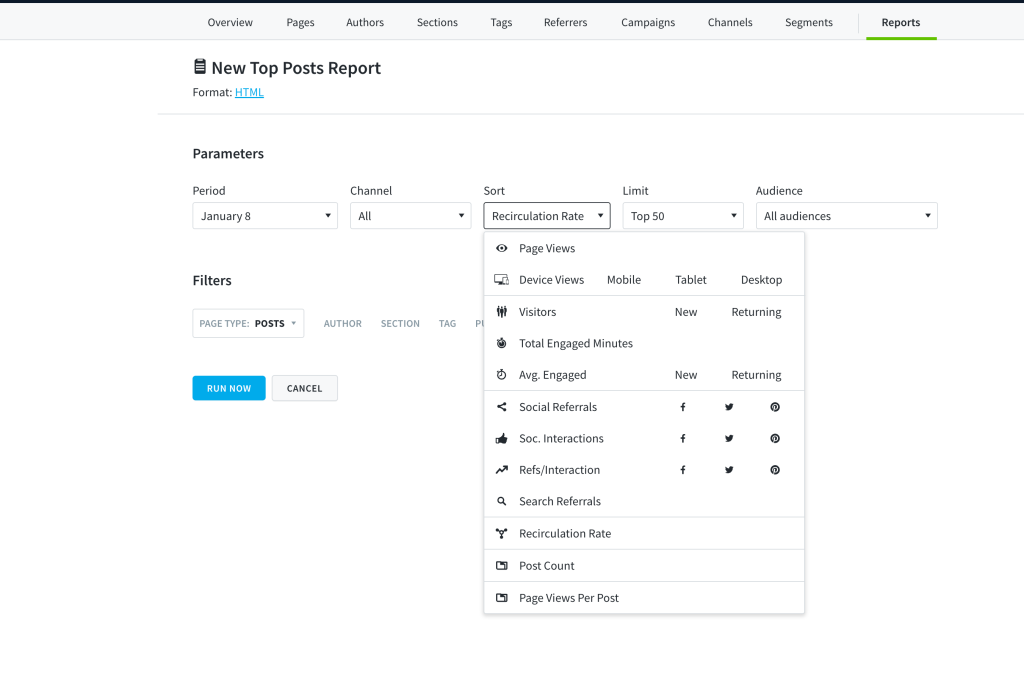
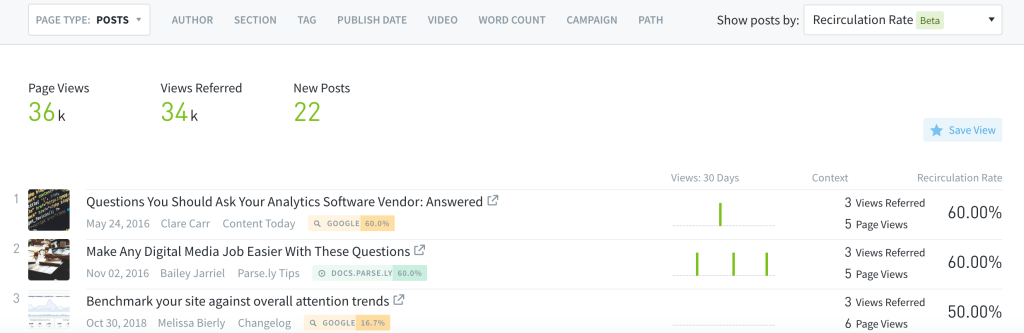
Create Top Posts Reports Sorted by Recirculation Rate
Recirculation rate is now available as a sorting metric in the Top Listings Report. You will see it in the dropdown menu for metrics when you create or update a Top Listings report that tracks posts.
November 15, 2023
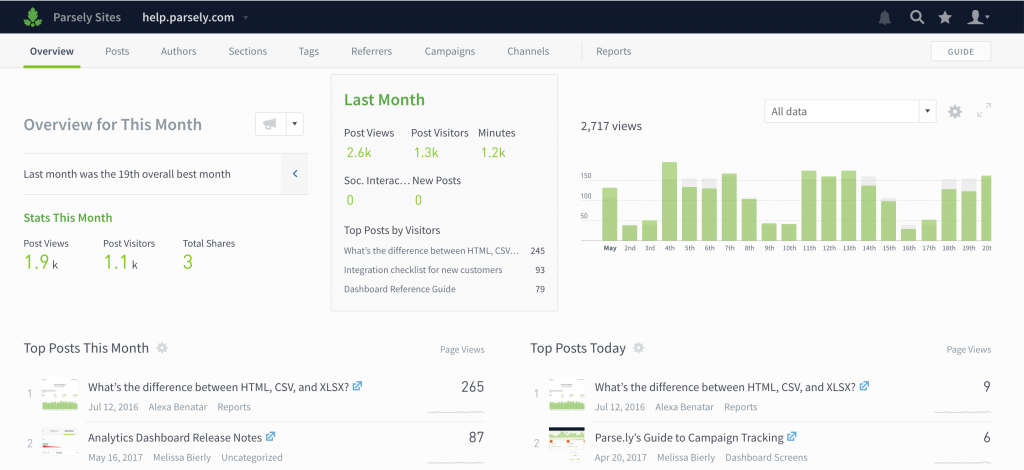
Add Filters on the Overview page
With the ability to apply filters to your Overview page, you can now get at-a-glance performance updates for specific authors, sections, tags, word counts, or campaigns. The filter includes the options to “match any”, “match all”, or “exclude”.
To access this, click on the cog icon, and then you’ll see the option to add filters.
Watch the video below to see this new feature in action!
November 8, 2023
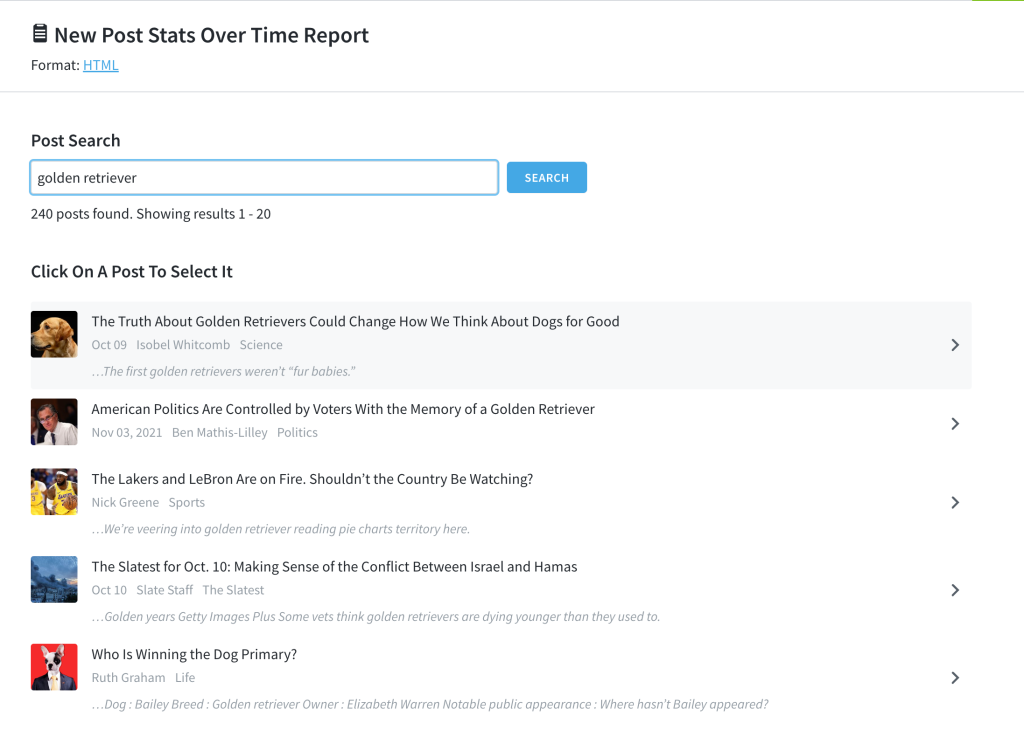
Create Stats Over Time Reports for Individual Posts or Pages
We added a Posts option to the Stats Over Time report so that you can run one-off or recurring reports for individual articles that you care about.
September 7, 2023
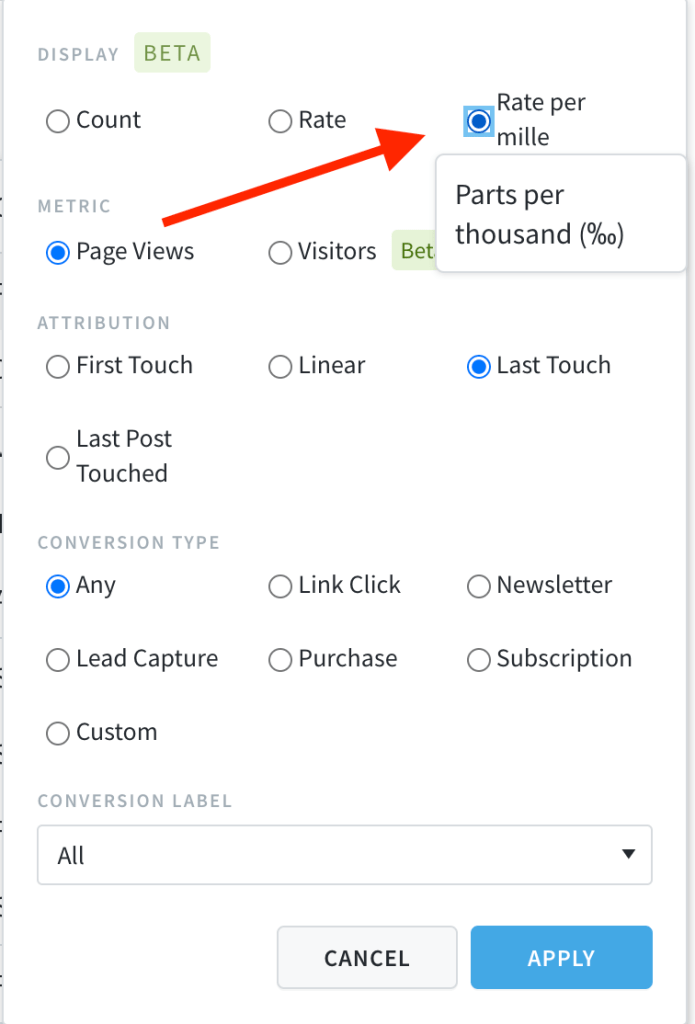
Conversion Rate Per Mille
We added a per mille option to the conversion metric dropdown. This calculates the rate per-mille (per 1000 parts) instead of the default percent (per 100 parts). This can be used anywhere the conversion rate is also applied.
August 31, 2023
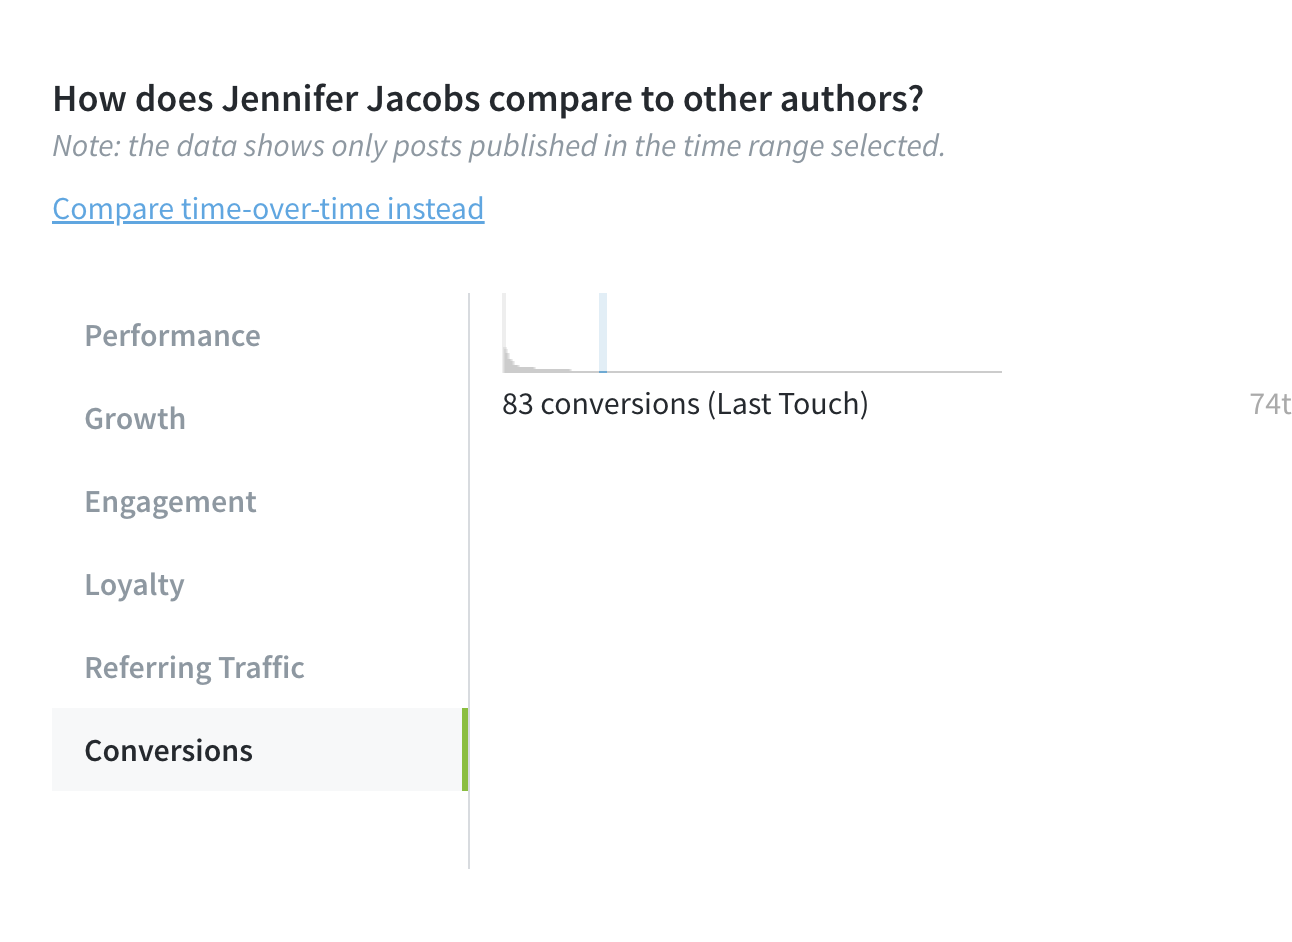
See which posts were last touched in your network before someone converted
With Parse.ly, you can see not only which page someone visited on your site before completing a conversion event (newsletter signup, clicking an affiliate link, etc.) but also which piece of content (“post”) they read before completing that conversion event. Learn more about Parse.ly conversions here.
With this release, you can now also see which post was last touched across your entire network of sites, instead of just individual sites. If you operate a multi-site business, and use our conversions feature, start using this view today!
Read more about how to leverage last-post touched attribution here.
August 25, 2023
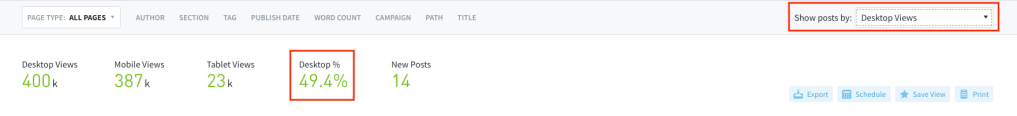
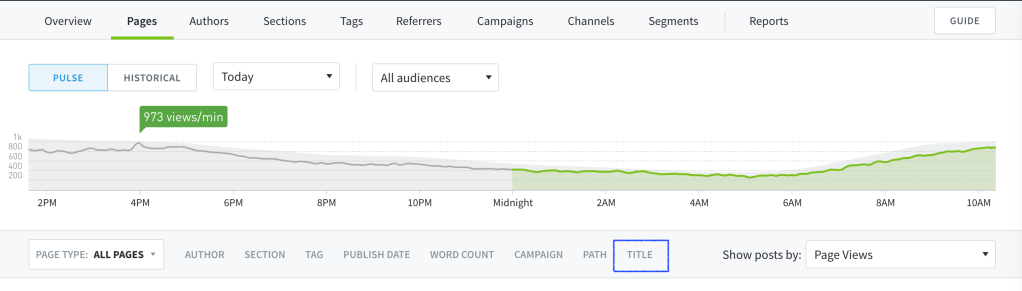
Percentages for desktop views
When looking at realtime analytics (“pulse” view), in addition to percentages for mobile and tablet views, we added desktop percentage views.
August 10, 2023
Update to converting visitor and converting visitor rate
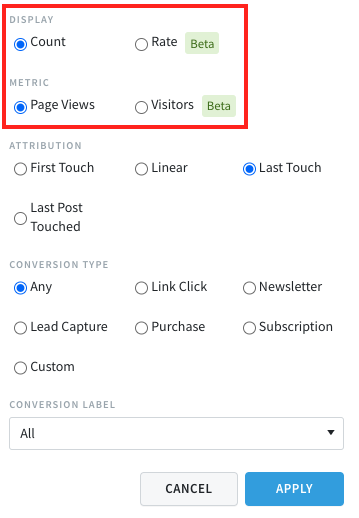
Conversions are viewable in a number of ways, and we’ve introduced several new ones with this update.
The Conversions Count is the sheer volume number of how many conversions happened for the content you are viewing. The Conversions Rate is what % of those page views converted.
What’s new in this update is that we are introducing Visitors as a metric for Conversions Count and Conversions Rate. Previously, it was calculated via Page Views. Now you can select between either Page Views or Visitors.
Converting Visitors is available everywhere you can see Conversions, and Converting Visitor Rate is available everywhere you can see conversion rates.
July 7, 2023
New metric: conversion rate
It’s important to know how effective your content is at converting visitors. Of course, posts with a high number of page views are likely to get the highest number of conversions. But what about those lower traffic posts which are converting at a higher rate? Conversion rates can help you identify those high-value pages. Learn more about this new feature here.
Filter posts by words in the title
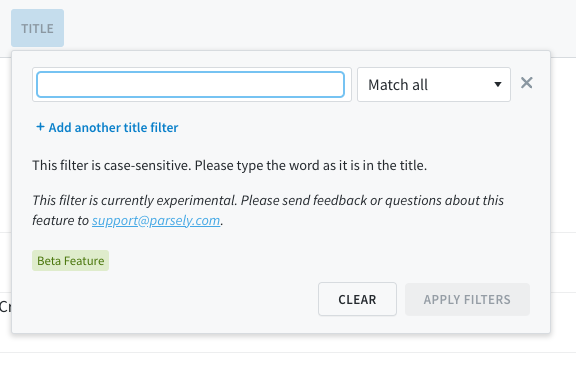
You can now filter your posts by a single word or multiple words in a title. Use this to exclude posts with certain title words, or to focus on posts with certain words in the title. Level up your filtering by then creating a Saved View you can refer to in the future.
This is available as a filtering option on the posts view in your dashboard. Learn more about filters here.
April 26, 2023
We are discontinuing Twitter social interaction counts
Starting on April 30, 2023, social interaction counts for Twitter and tweet cards will no longer be available in Parse.ly Analytics. This will not affect referrer analytics for Twitter.
Read our blog post to learn more.
March 30, 2023
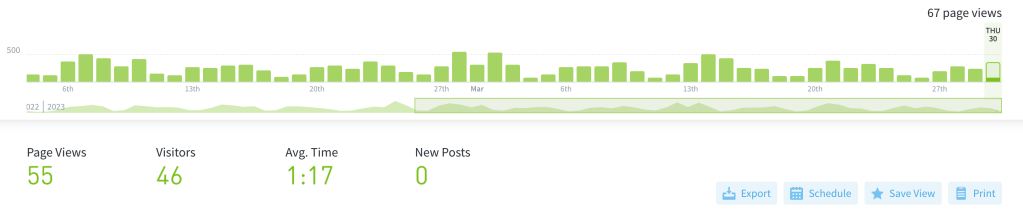
Print any view in the dashboard
Parse.ly dashboard users can now print and save to PDF any view in their dashboard, making it faster and easier to create and share reports with teams and leadership. Read our blog post and knowledge base article to learn more.
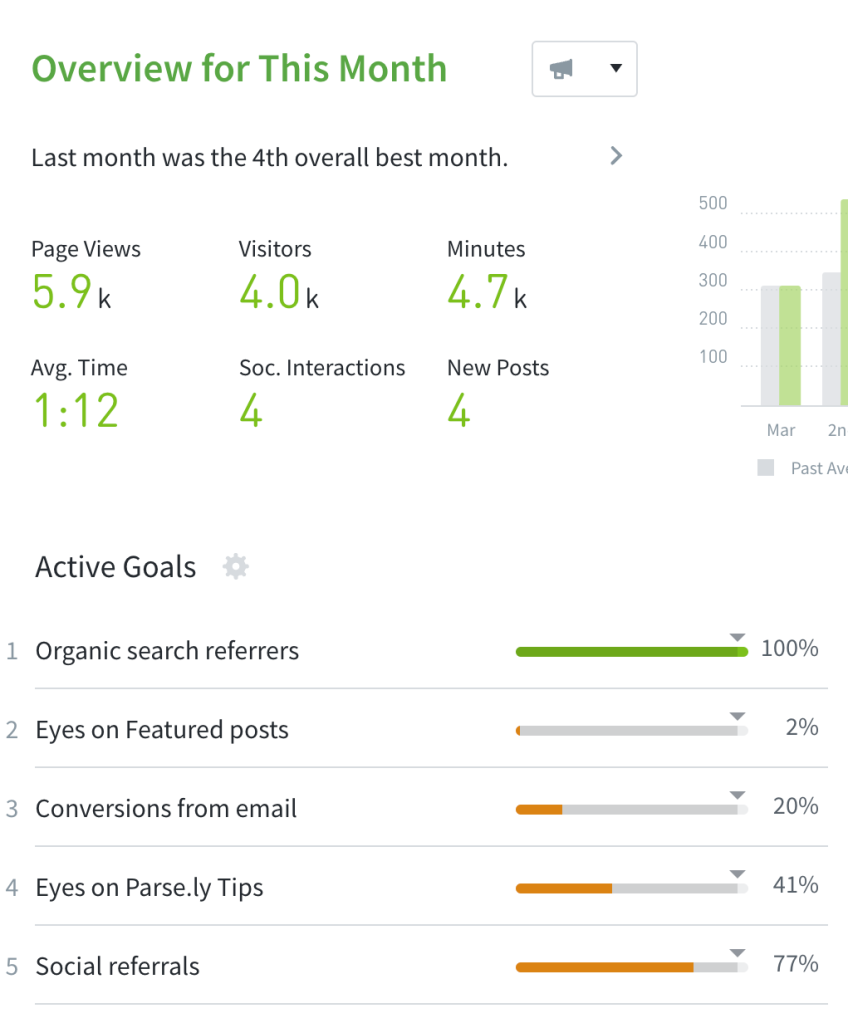
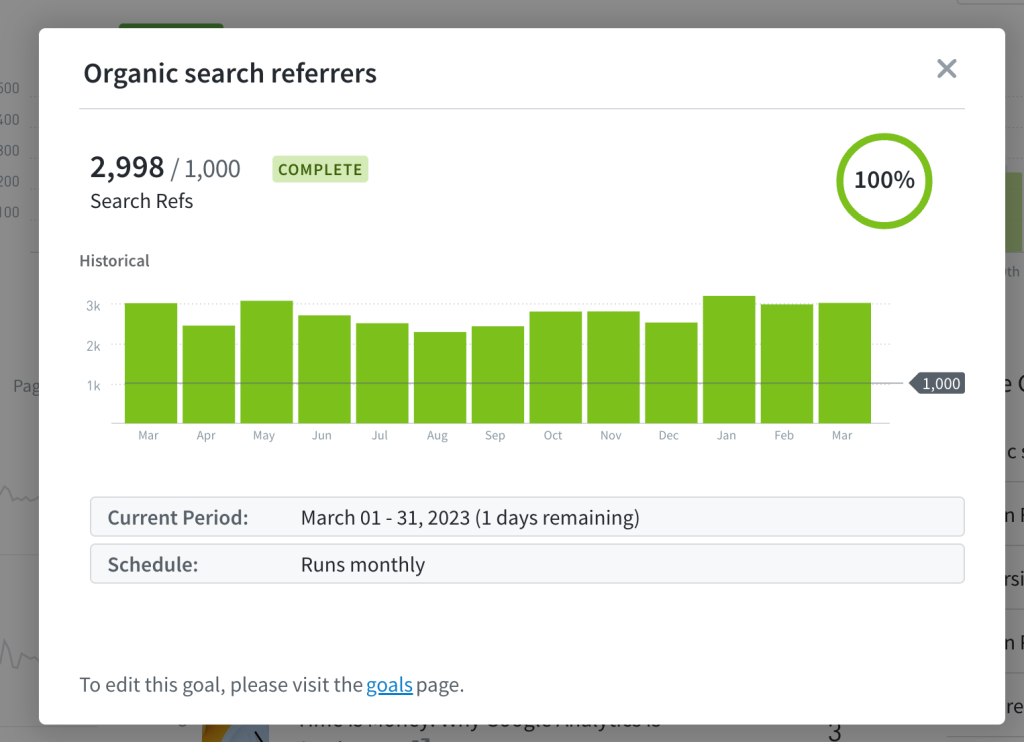
Add goals to your Overview
See how your Goals are performing directly on the dashboard! Goals is now an option you can add to the Overview screen.
March 9, 2023
Update: Added functionality to site groups settings page
We added the ability to copy group, added stronger deletion permissions, and added the option to undo deletion.
February 8, 2023
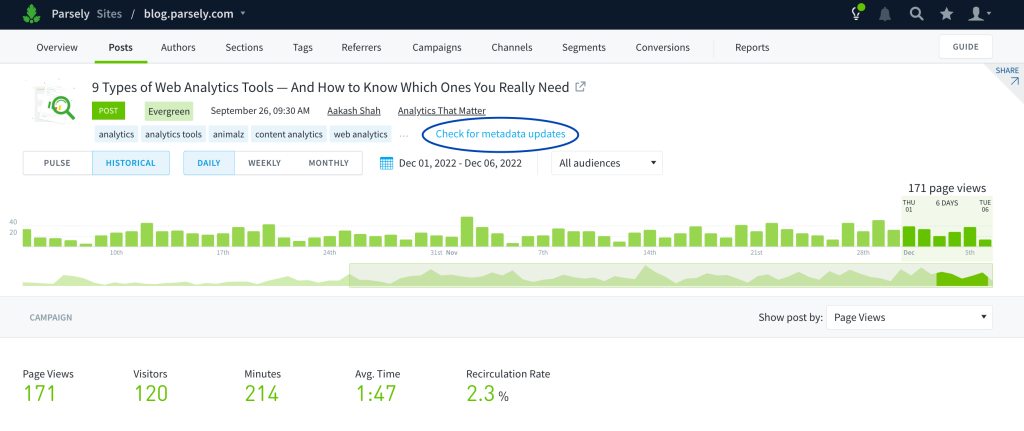
Update: Recirculation Rate available in Overview
We added recirculation metric as an option on the Overview page, currently available for posts only (which includes both posts and pages). We also updated the tooltip to provide a better explanation of the rate displayed.
February 1, 2023
New: check for metadata updates
Use this feature to check for metadata updates on individual pages that look outdated to you in your Parse.ly dashboard. Learn more in our help documentation. This is now available to everyone with a Parse.ly dashboard.
New: automatic metadata change detection
Use this feature to let Parse.ly find and update metadata on post pages for you. Learn more about automatic metadata change detection in our help documentation. This is an opt-in feature; please contact support@parsely.com if you would like to add this feature to your Parse.ly account.
New: save views using the recirculation rate metric
You can now save views in Parse.ly when using the recirculation rate metric as the primary sorting metric when looking at posts.
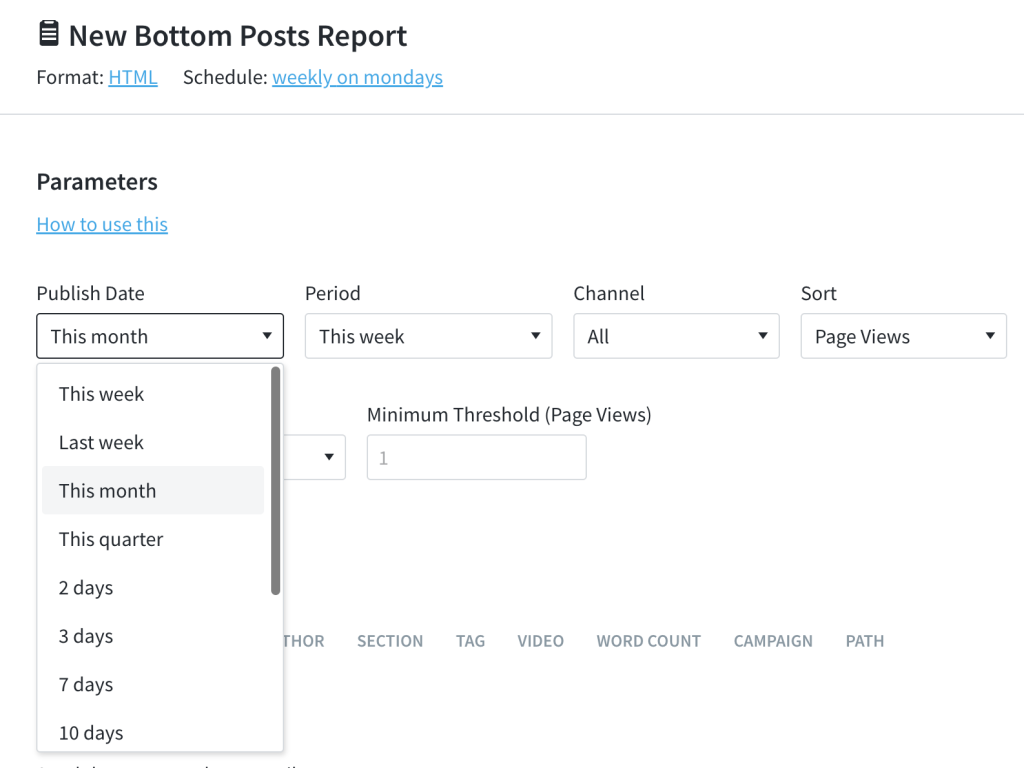
New: publish date filtering options for recurring Bottom Listings Reports
You can now specify publish dates when setting up recurring Bottom Listings Reports. Learn more about the report in our help documentation.
January 25, 2023
Update: New Syndication UI Elements
To make Syndication more informative and easier to navigate, we improved the current site list, added a site group tab, and updated the factoid area.
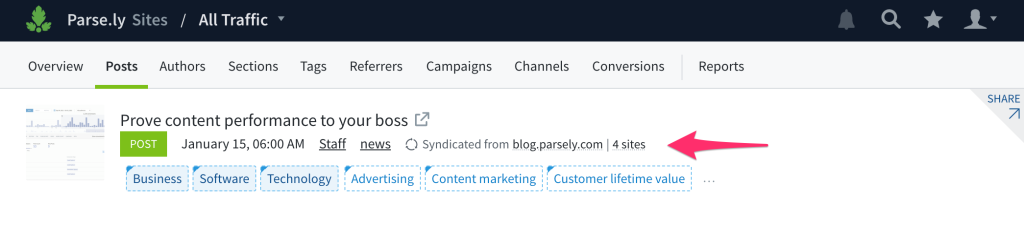
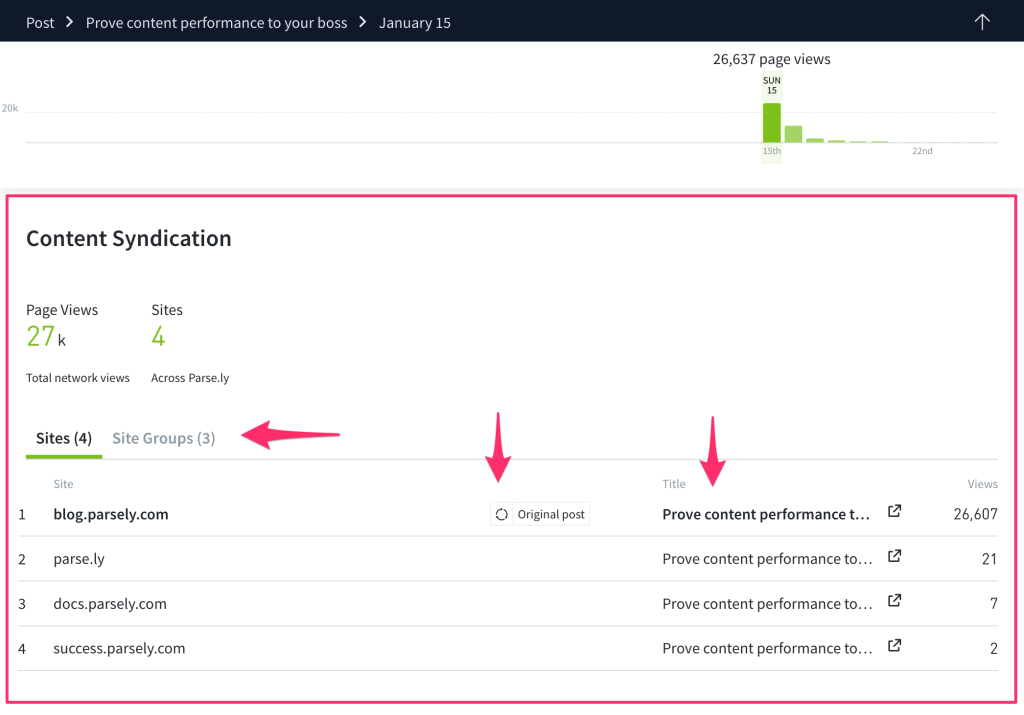
Learn more about Syndication here.
December 16, 2022
New: /Similar API Endpoint
Thanks to a ton of cutting-edge work in our machine learning, now our content recommendations are more accurate, allowing you to deliver even more engaging and accurate experiences to your readers. This release is a new API endpoint, so it’s not visible in the Parse.ly dash, but accessible via calls to our API. Learn more here.
Update: Export button for Campaigns
You can now export data on the Campaigns listing page.
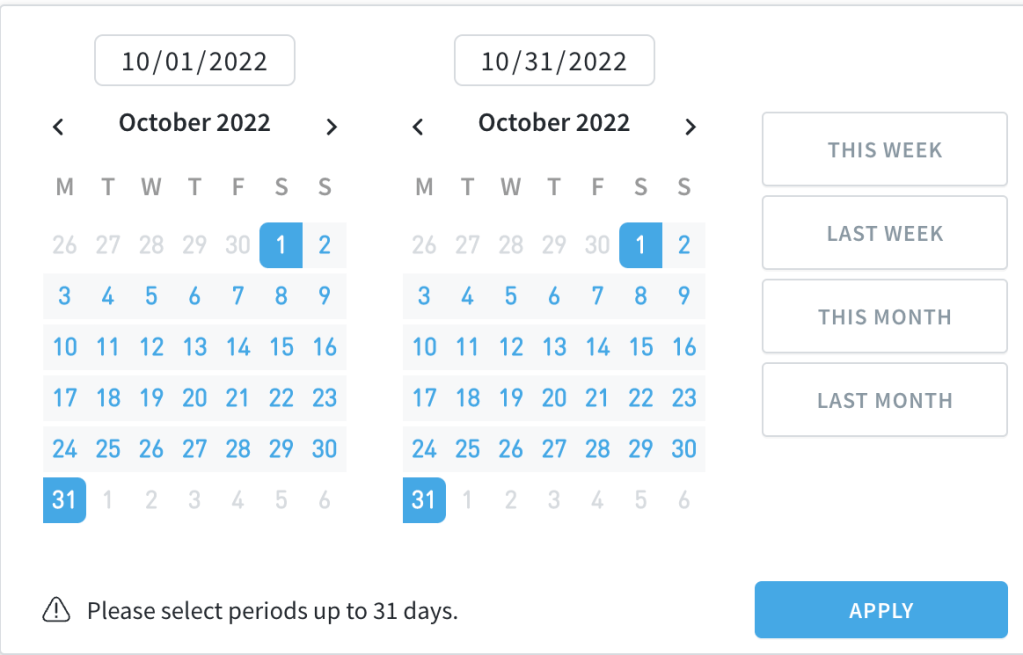
Update: Bottom Listings Report – increased flexibility for selecting dates
When choosing the publish date, you are now able to select any period of time, up to 31 days.
December 1, 2022
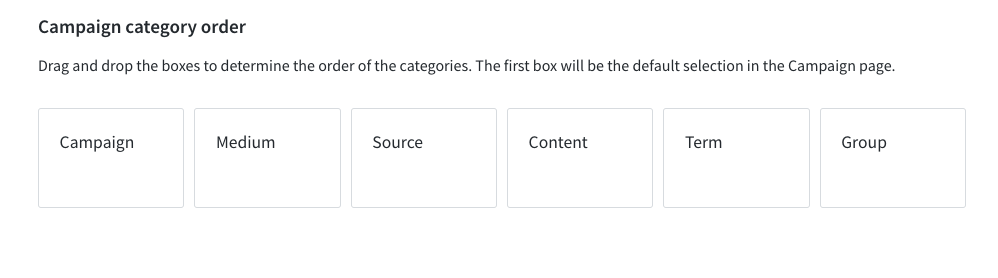
New: Campaign Category Order
We now have a preference that allows you to set the order of the campaign elements displayed on your dashboard’s Campaigns page. From the Preferences page, simply drag and drop the boxes representing each campaign category to determine the order. Setting this preference will apply for all users.
November 17, 2022
New: Campaigns on the Overview Page
Viewing campaign performance is now an option in the Overview screen. You can select any campaign parameter to display. Now you can see how your campaigns are performing when you first log into your Parse.ly dashboard.
October 19, 2022
New: Tag Groups and Referrer Groups
Create your own custom tag and/or referrer groups to keep track of the tags or referrers that matter most to you in one place. Watch the video below for a brief demonstration, or go to our Knowledge Base to read more about Tag Groups and Referrer Groups.
October 6, 2022
New: Comparison Mode
Ever wonder how content performance compares from one time period to another? With comparison mode, you can see the “before and after” results of your work directly in Parse.ly. Learn more in our Knowledge Base, or watch the video below for more details on where to find comparison mode, and how to use it!
VIDEO
September 14, 2022
New: Bottom Listings Report
In order to get better at anything, you need to understand what works. You also need to understand what doesn’t work. Being able to systematically surface the projects that did not produce the results that were expected of them will help you refine your content strategies and achieve more.
The Bottom Listings report shows a list of potentially underperforming posts. It can be repeated (weekly, daily, monthly) or generated once, in either HTML format or PDF format, which is the same as any other report in the Parse.ly dashboard.
Check out this video to see an example of creating a Bottom Listings report:
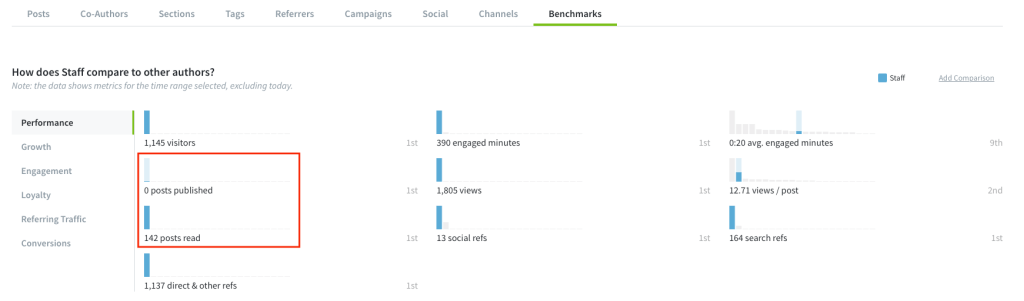
Update: Added “Posts Published” to the Benchmarks tab
We added “posts published” to the list of metrics in the Benchmarks tab.
August 24, 2022
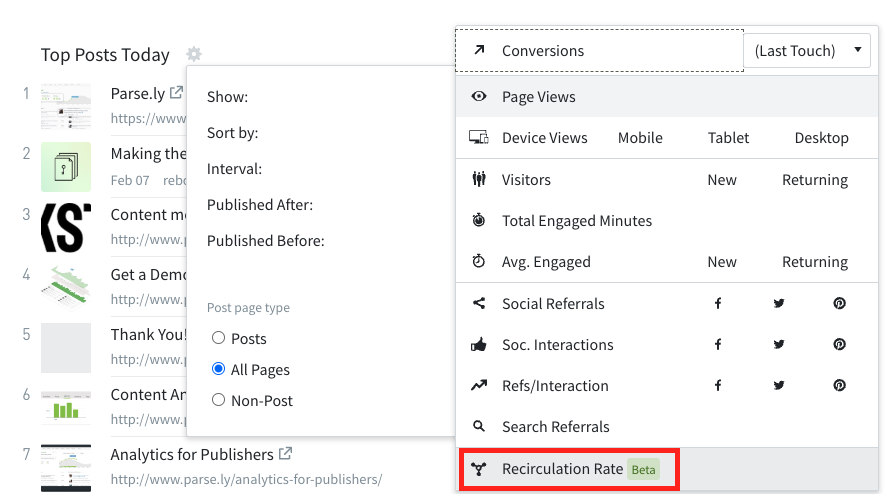
We launched a new metric: Recirculation Rate!
Ever wonder which posts or articles send the most people to another page on your site? Welcome to recirculation rate. Recirculation rate is the percent of page views from one post that went to another internal post on your site.
June 24, 2022
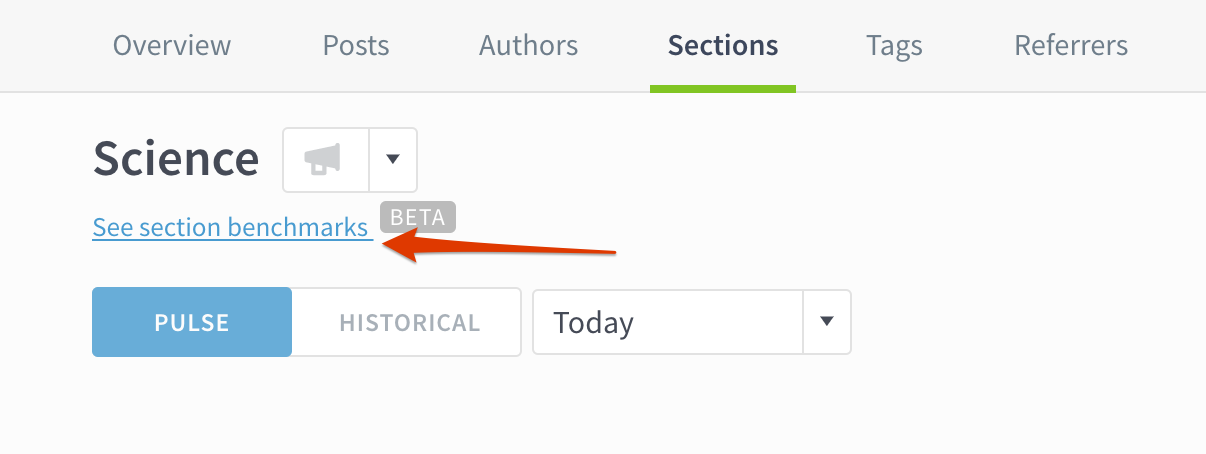
Benchmarks Comparisons are now available as a tab in the Authors and Sections pages.
When viewing Authors or Sections in historical mode, Benchmarks comparisons are now available as a tab on those pages.


The full range of Benchmarks comparisons are still available by selecting a specific author, tag, or section, and clicking “see benchmarks” at the top of the page.
June 8, 2022
Easily copy summary referrer data to your clipboard
When you’re on the Referrers tab, you can now hover over summary data for the different referrer categories and copy the data to your clipboard.

June 2, 2022
Copy to clipboard icon appears when hovering over a factoid
Hovering over factoids now gives an option to copy and paste the full number. When you mouse over the number, a copy icon will appear. Click to copy to your clipboard.
This option appears throughout the dashboard.
May 4, 2022
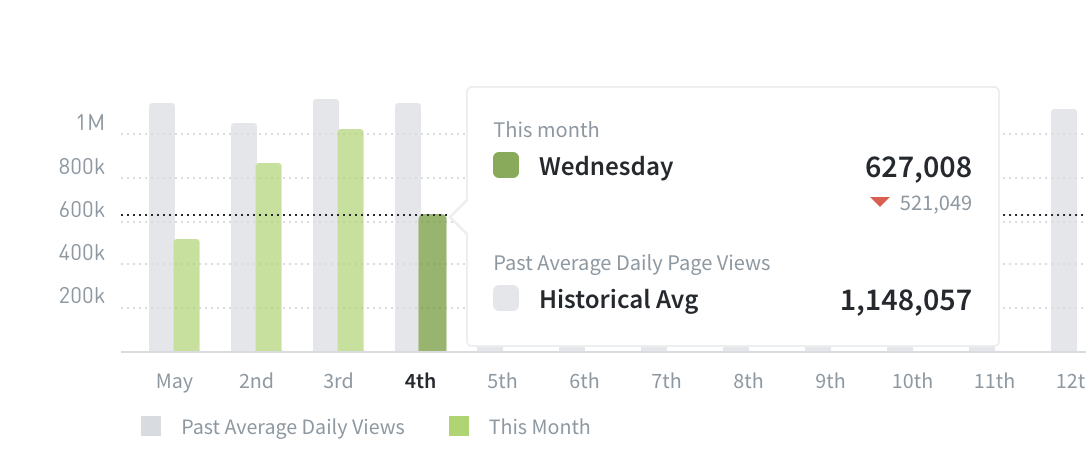
See how your Overview metric compares to the 8-week average
When you set your Overview timeline graph to This Week or This Month, you can now see how the current time period compares to the eight-week historical average. Learn how to unlock this new feature from your Overview settings.
Use Benchmarks for Conversions
Conversions are now available as part of the Benchmarks feature. Learn how to get the most out of Benchmarks here.
Use the new Conversions metric to compare last-touch conversion performance for different posts
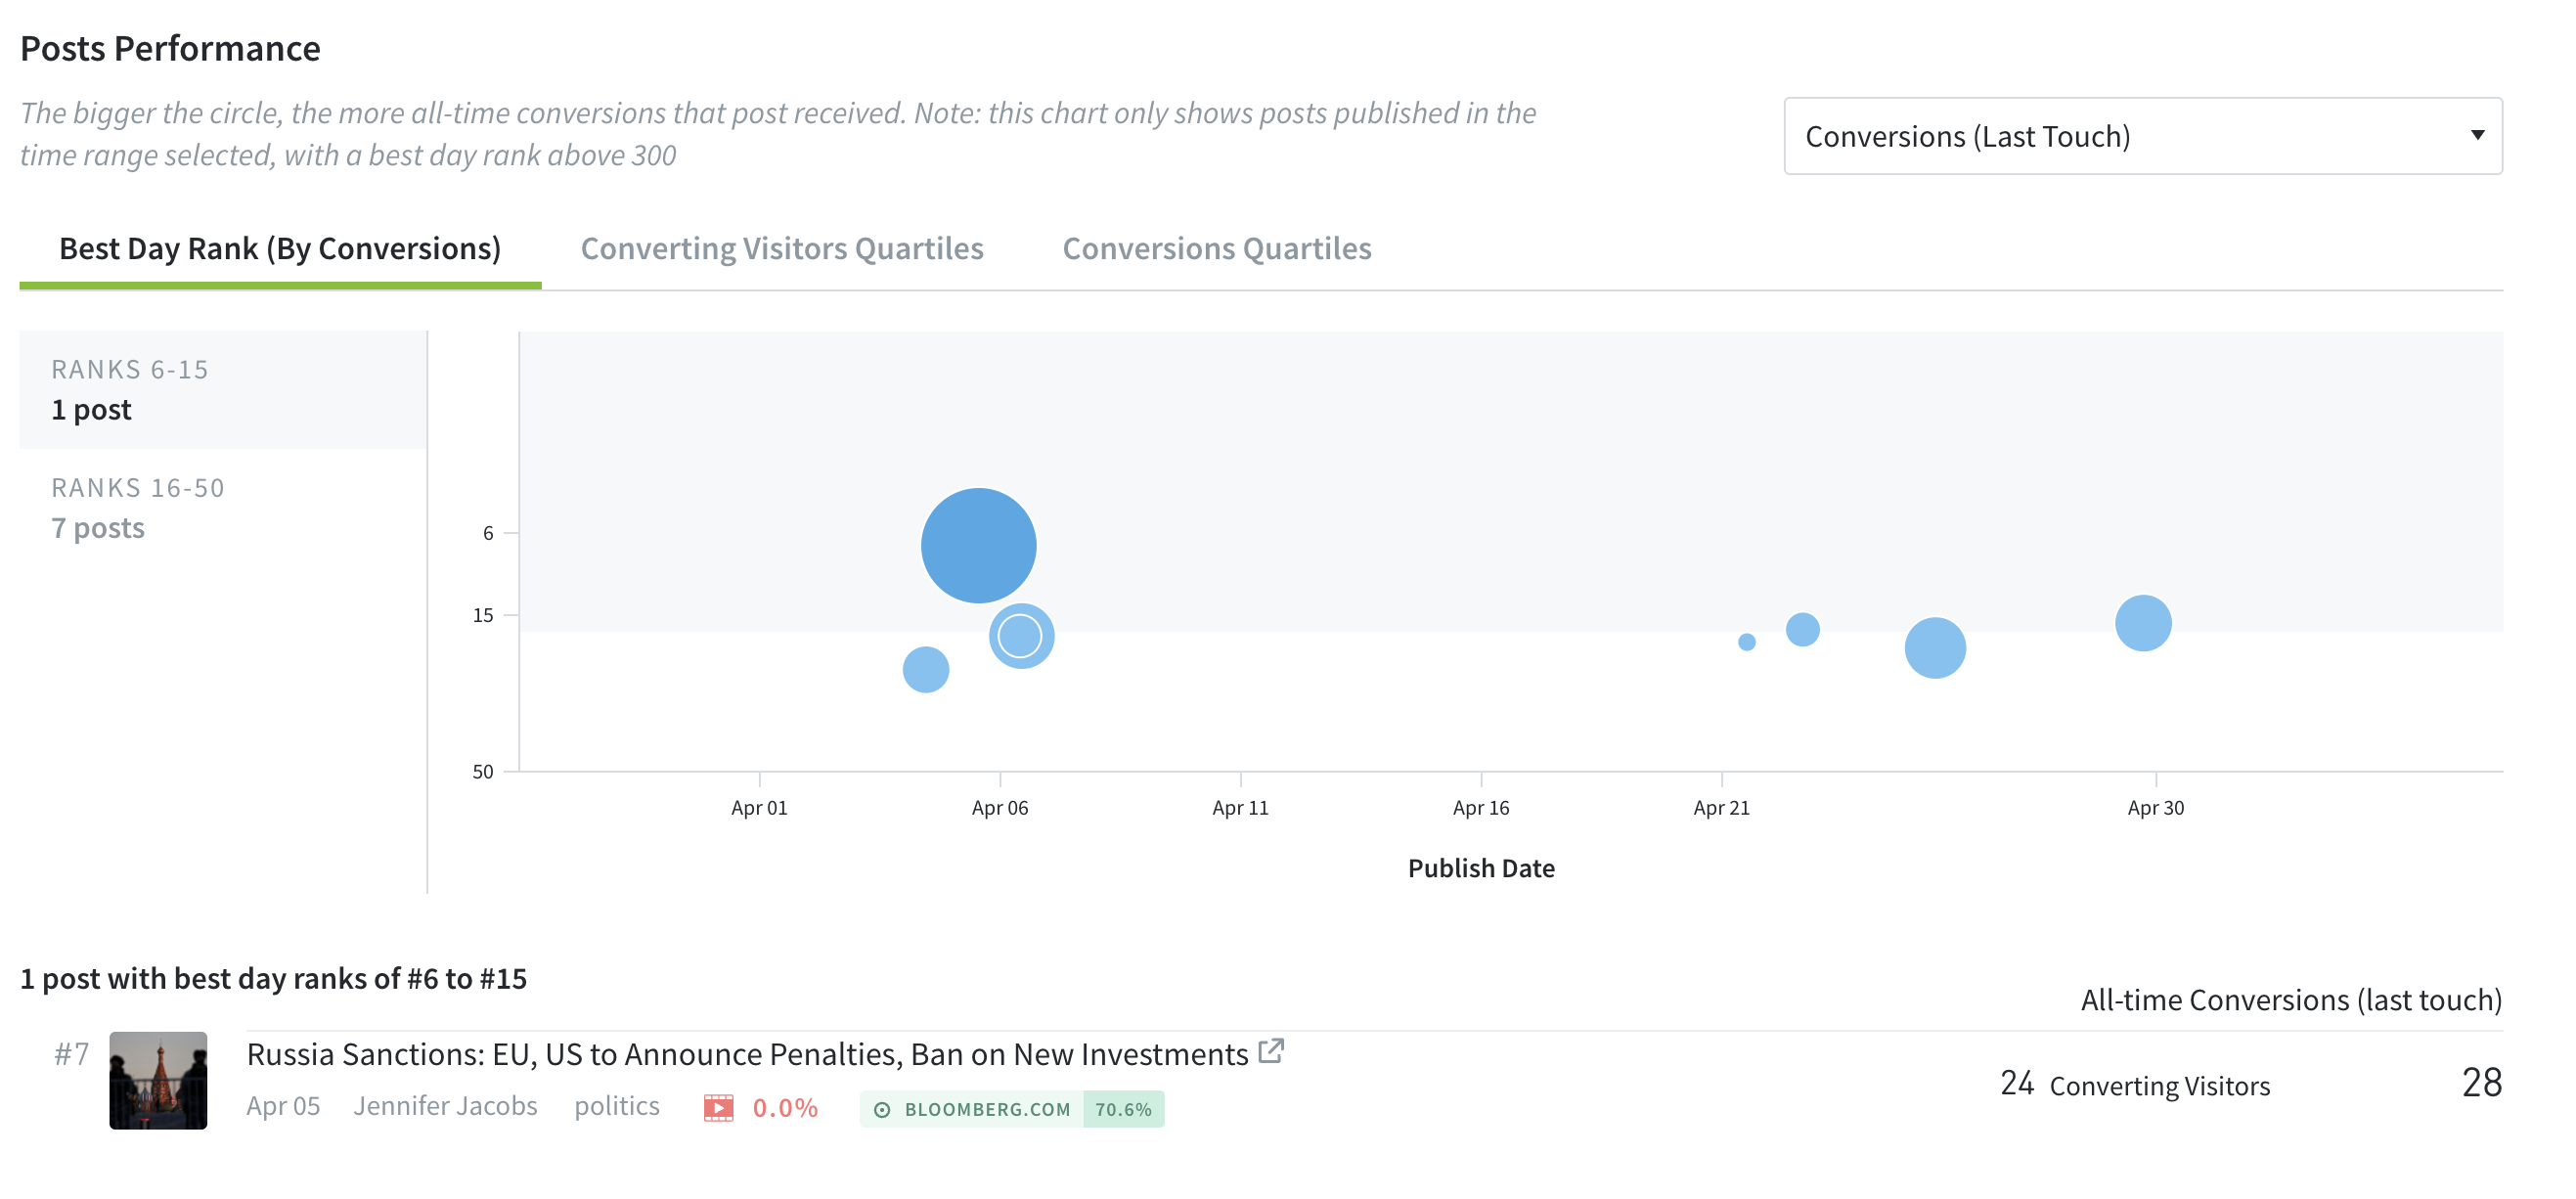
Or evaluate how authors, sections, or tags compare for Conversions, alongside other metrics like Engagement and Loyalty.
April 21, 2022
Refreshed color system in your dashboard
We refreshed the color system in the Parse.ly dashboard to improve accessibility and readability, and improve the consistency in our light and dark modes.

March 31, 2022
Conversions metrics on Overview
Overview now shows conversions metrics and the top converting section, tag, or conversion label.
Here’s how to get to “conversions mode” on Overview:
- Click the cog on the upper right-hand corner of the page.
- Click Summary & Timeline.
- Click Timeline Metrics.
- Select Conversions.
- Click Show Top Converting Aspect.
- Select Section, Tag, or Converting Label.
February 18, 2022
Filter conversions types
Got a long list of conversions you’re tracking in Parse.ly? Now you can filter them down by type on the Conversions listing page. Just click one of the types to apply the filter. To remove the filter, click the type again.
January 19, 2022
Conversions timeline on Overview
You can now customize Overview to show conversions in the timeline, instead of page views.
To make changes to the Overview timeline:
- Click the cog on the upper right-hand corner of the page.
- Click Summary & Timeline.
- Click Timeline Metrics.
- Select Conversions.
Check out this video for more information about customizing Overview with conversions.
January 5, 2022
Create Author Groups
With Author Groups, you can save collections of authors and view their performance all at once. Create a group to track your team’s performance, to distinguish freelancers from full-time writers, or to group together multiple variations of the same author’s name.
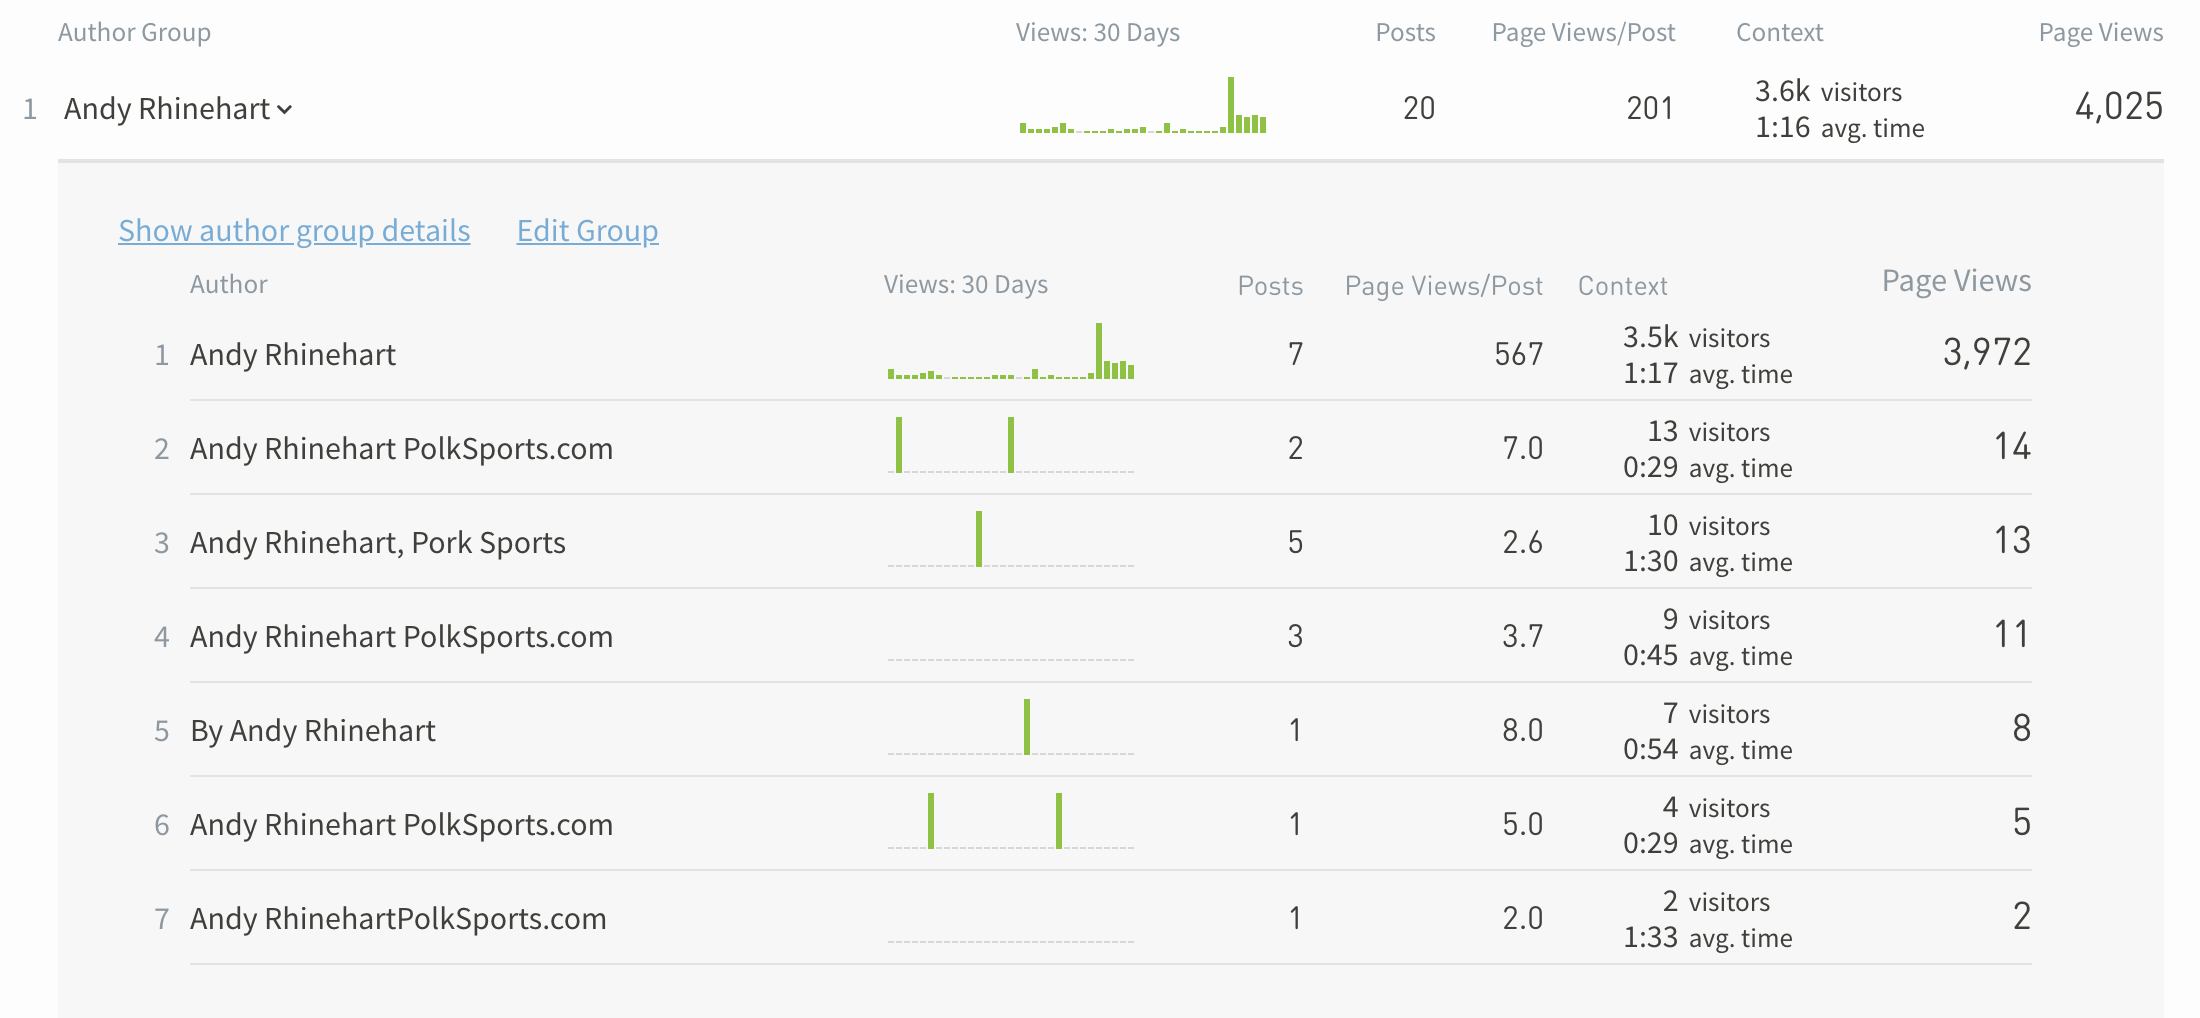
Go to the new Author Groups tab to set up your first Author Group. Author Groups are visible to all users of your Parse.ly dashboard.
Learn more about Author Groups.
December 1, 2021
Copy timeline metric text to clipboard
You can now select historical data, visualized as a timeline in the dashboard, and copy the summary metric text (“2,400”) to the clipboard with one click. Paste it anywhere you like – a document, an email, an instant message.
Filtering tags by Smart Tags
Use a “starts with” matcher like Squ* when filtering for tags and the resulting list will include both your site tags and any matching Smart Tags. Note: You must have ‘smart tags’ (site and high-level tags, or all tags) enabled in your preferences to make use of this feature.
November 24, 2021
Here’s a list of issues fixed with this release:
- The tag type setting for scheduled reports was forgotten when reports ran again. That’s fixed.
- On post details pages, if you hover over a referrer or channel, Parse.ly displays a highlight on the graph to show the percentage of total traffic (e.g. how much search traffic contributes to overall views). The highlight wasn’t matching the actual percentage of traffic. But it is now!
- We now exclude cases where visitors went to the same page again (e.g. refreshed the page) from “Activity after this post.”
November 17, 2021
Better search results
Search results now surface videos, break out written content into posts and other pages (i.e. non-post pages), and show a count of results in each category.
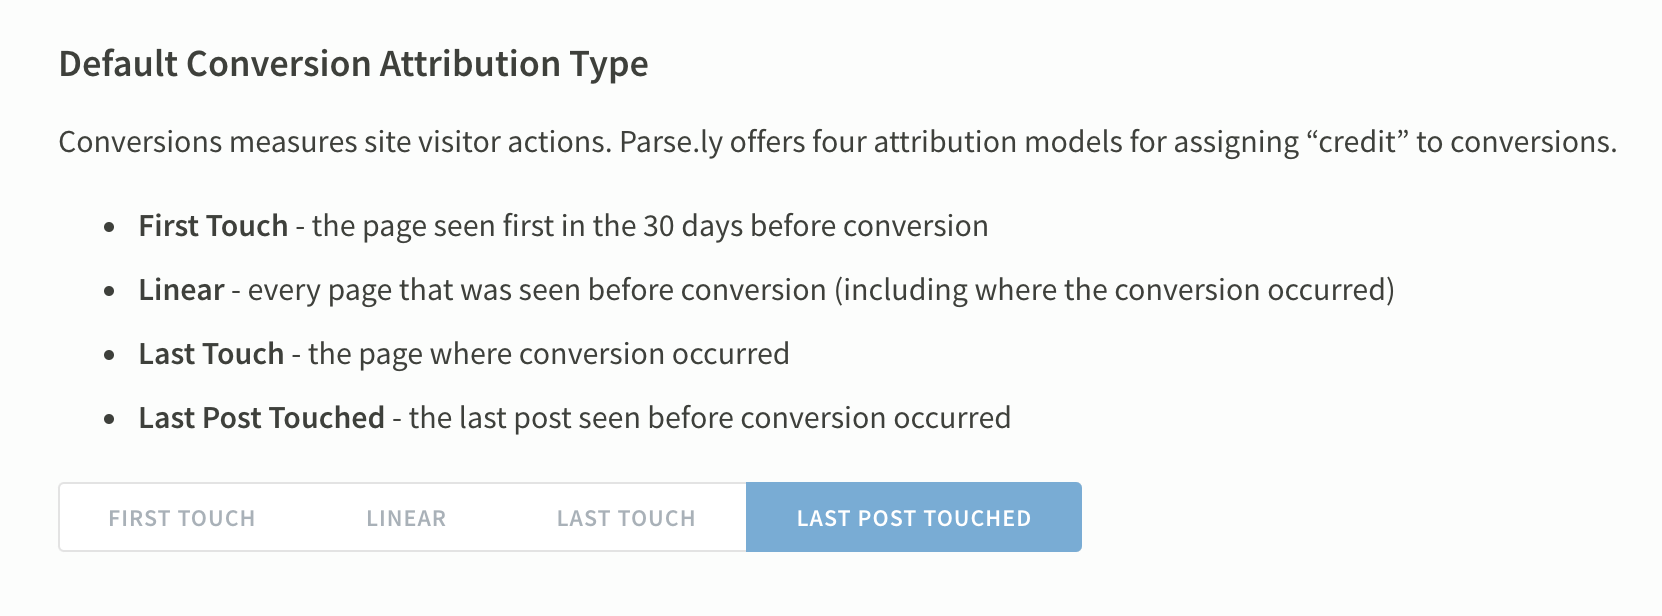
Set conversions as the default sort metric across your organization
From the Preferences page, admins can set conversions as the default sort metric for everyone who uses their Parse.ly dashboard.
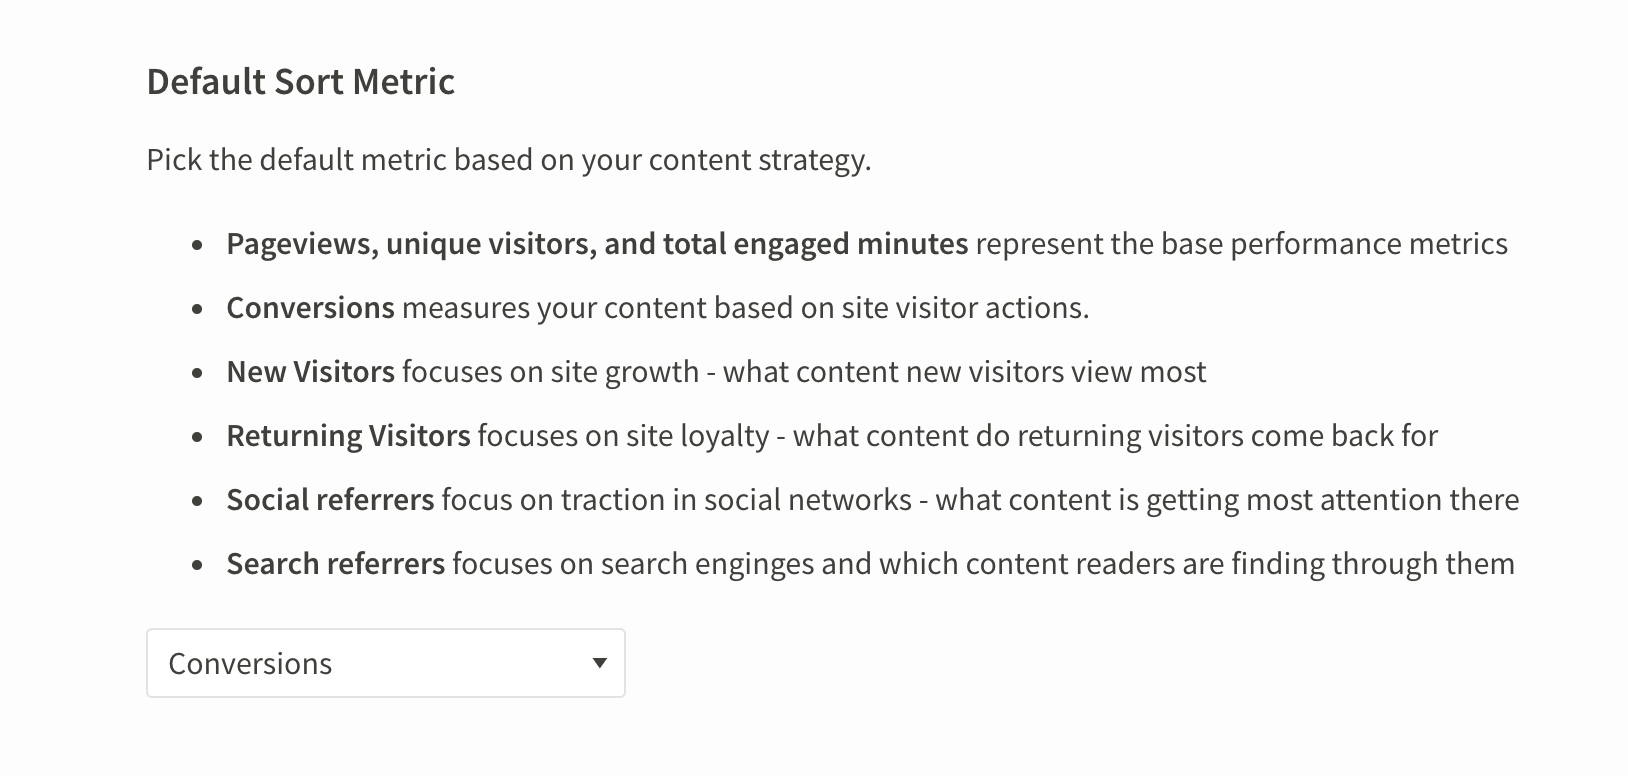
Admins can also select which attribution model, which assigns “credit” to content for conversions, shows up by default.
Richer recirculation metrics
Find more metrics to contextualize the referred views a given page sent to other pages on your site. Look under “Activity after viewing this post” at the bottom of the post details page.
You can also filter down to show just the Other posts viewed after this page or the index and section pages (i.e. non-post pages) viewed next.
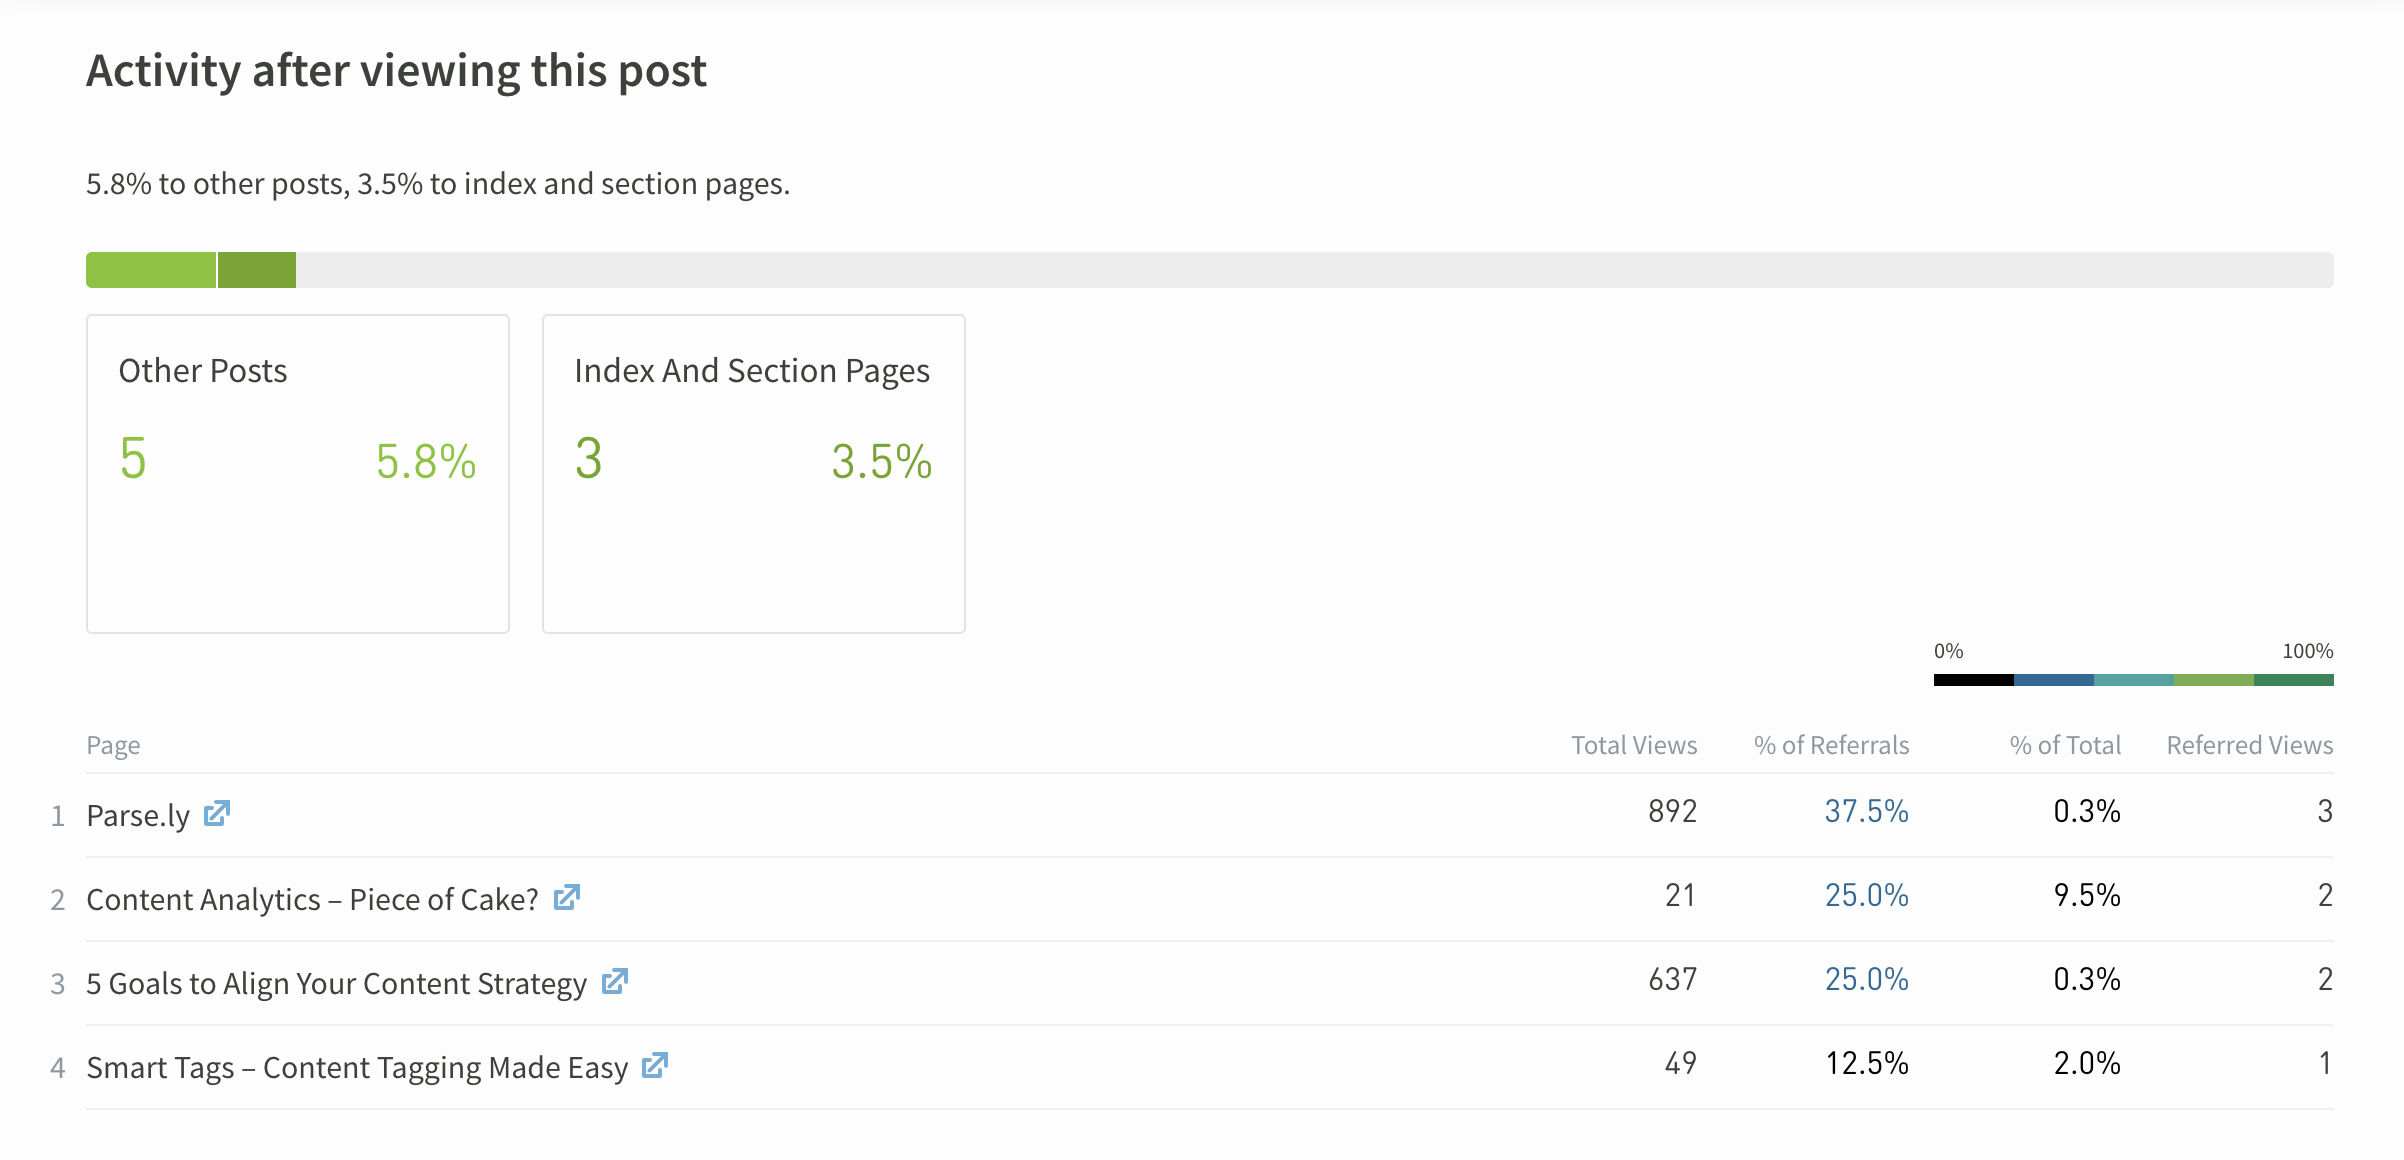
In the example above:
- “Content Analytics – Piece of Cake?” got 21 total views, from various sources
- 25% of the views referred internally by this page went to “Content Analytics – Piece of Cake?”
- This page referred 9.5% (2 views) of the 21 views to “Content Analytics – Piece of Cake?”
- This page referred 2 views to “Content Analytics – Piece of Cake?”
October 27, 2021
Goals are a new feature in the Parse.ly dashboard!
Use our new goals feature to measure how successfully your content strategy is performing. Goals will help your entire team align on what success looks like, and signal how you can improve it.
Learn more about goals in our knowledge base.
October 20, 2021
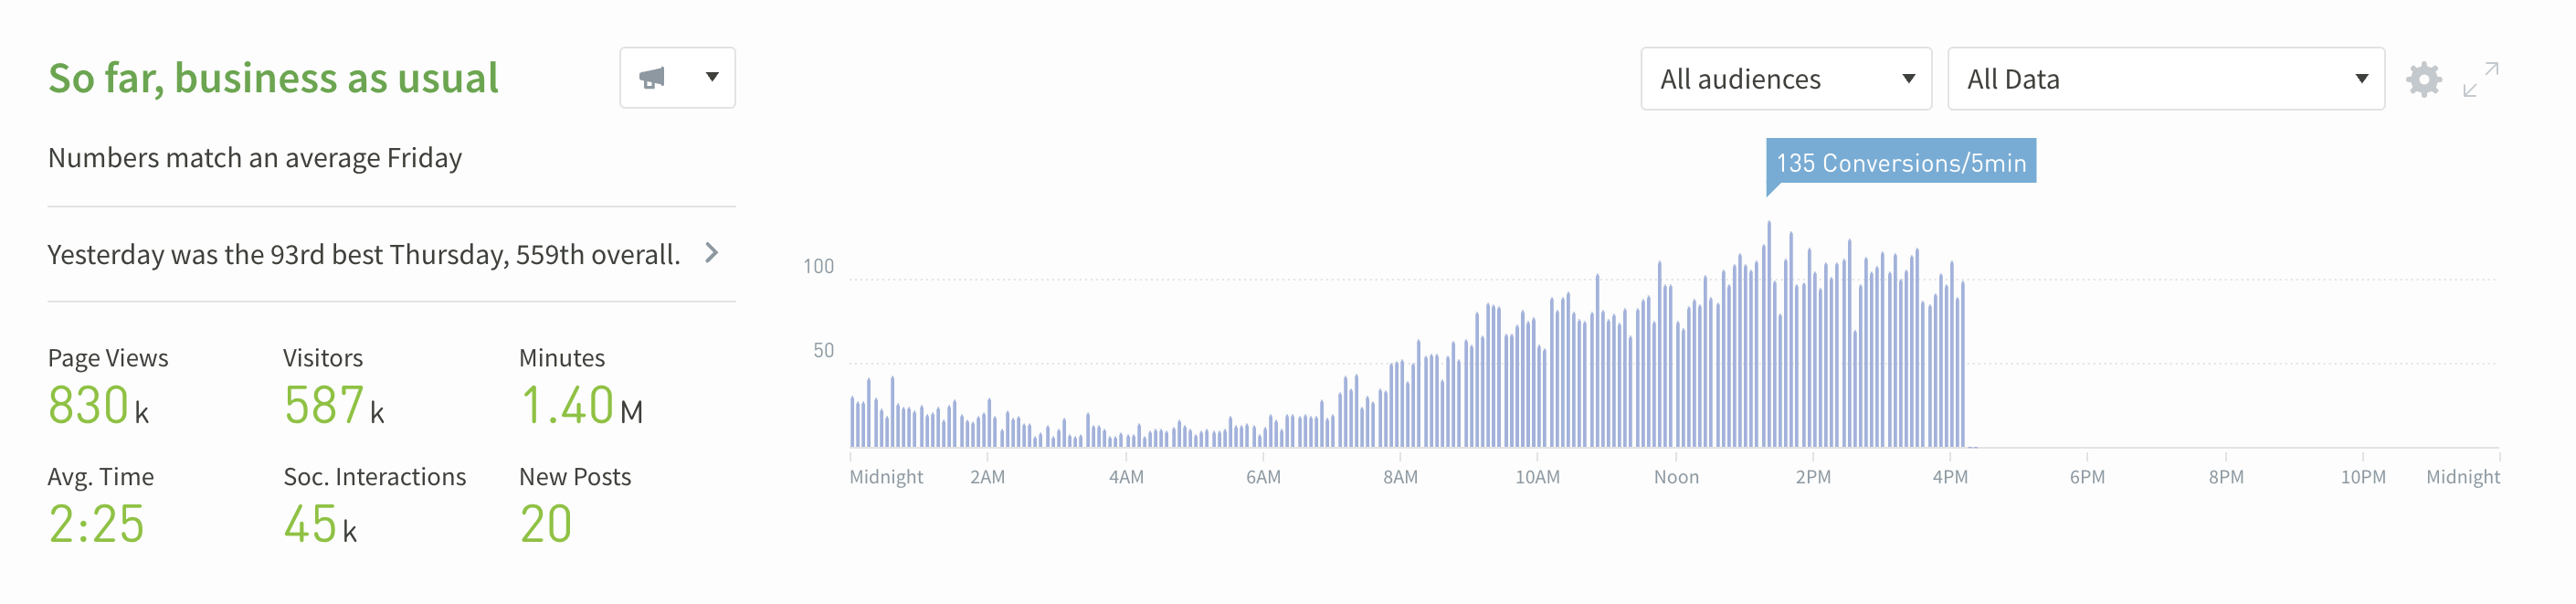
Parse.ly’s Conversions are now faster. Previously, conversions would take a day to populate in the dashboard. With this update, customers are able to see conversions within 30 minutes of the event happening. You can now view Conversions on the Overview page and in the Pulse tab on the Conversions page. Plus, anywhere that you can select Conversions as a metric, you can select the time interval to be as recent as 30 minutes.
August 10, 2021
We’ve made some tweaks to the dashboard. You might notice a few changes like:
Improved accessibility for keyboard users
Tab through dashboard elements in Parse.ly, like navigations, menus, and buttons.
Dark mode
Eyeballs, rejoice! Easily switch between light mode, dark mode, or automatic (changes with your systems settings).
Conversions on post details pages
Now you can see how visitors got to a particular page before converting. This can be useful when you’re trying to understand what referrers and campaigns successfully got folks to sign up for a webinar or download an asset. Go to any post details page and click Conversion from the metric dropdown menu.
Conversions in Top Listings and Details reports
You can pull a list of top posts, authors, sections, tags, campaigns, or referrers by conversions using the Top Listings Report or Export.
Note that while we have deprecated the conversions report link from the Reports page, you can run the same report as a Details report.
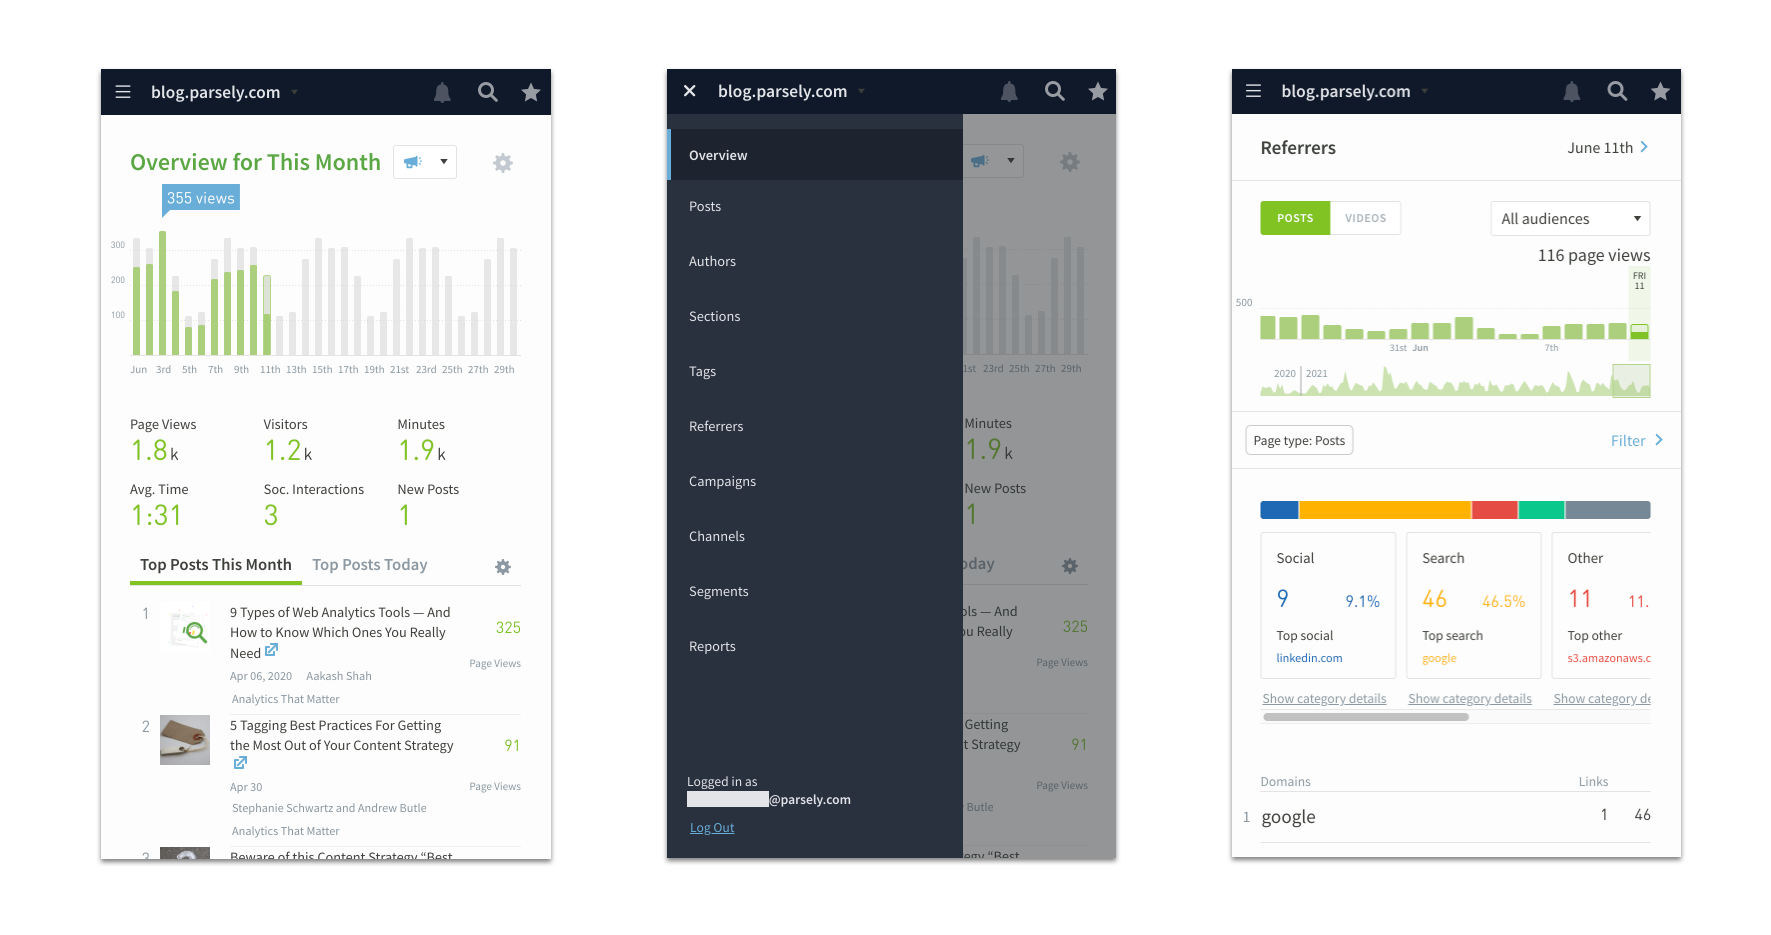
Better mobile web experience
It’s much simpler to use Parse.ly in your mobile browser now. Tap the hamburger menu to hop between screens and swipe and scroll with ease.
User settings
Access Authentication Settings, Export Users, and Resend Invitations by clicking the cog on the User Management page.
June 15, 2021
Last Post Touched attribution
Last Post Touched attribution is a new way to pinpoint specific posts that “pushed visitors over the edge” to purchase or subscribe.
If your Parse.ly subscription includes conversions, you should see Last Post Touched as an option in the conversions metric dropdown in your dashboard:
Learn more about how Last Post Touched attribution works.
May 4, 2021
Smart Tags
Say hello to Smart Tags, a new way to classify the subject matter of your content, no maintenance in your CMS required. You’ll see them show up in Parse.ly alongside your regular tags (aka “site tags).
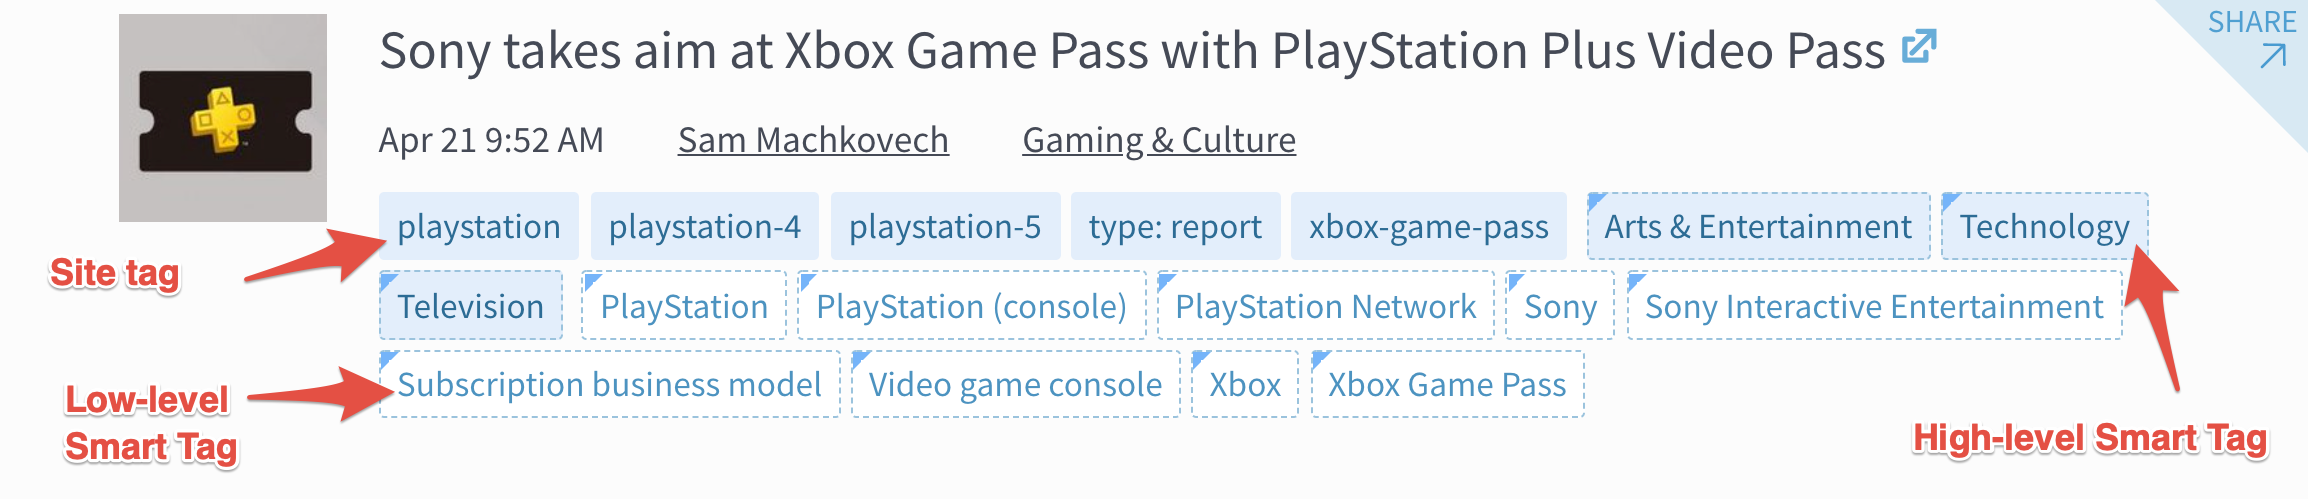
We know tagging content manually can be a headache. It’s easy to forget to add tags when you publish a post or to make sure your team uses them consistently. Smart Tags does the work for you, scanning pages and posts to determine relevant topics and assigning tags to them automatically.
Learn more about how Smart Tags work.
March 8, 2021
Export conversions data (or get it in your inbox!)
Now you can set up a conversions report for your whole team, or export conversions data to a spreadsheet.
When setting up most reports or exports, you’ll be able to select conversions as a metric.
- Go to Reports.
- Click Create Report.
- Select a report, such as Top Listings.
- Select an aspect, repeating cadence, and format.
- Click Continue.
- Select a historical time period (e.g. yesterday, this week).
- Select conversions from the Sort dropdown.
- Select any other filters or parameters.
- Click Save or Run.
Caveats:
- Conversions data is not supported in Stats Over Time, Evergreen Overview, or Audience Overview reports.
- Conversions data is not available in channels other than Website.
- Conversions data is not available for videos.
You can also export data or schedule reports from listings pages in the dashboard:
Easily select a conversion metric
Get answers to “What drove the most subscriptions last month?” in fewer clicks.
We’ve made it easier to pick conversion metrics by condensing everything conversions into one part of the metrics dropdown.
November 1, 2020
Conversions
Conversions are now in the Parse.ly dashboard. With the ability to give content credit for user actions, you can prove value to your boss and get buy-in across teams.
June 10, 2020
Spot weekly and monthly trends
One of the most common pieces of feedback we hear from customers is: please make it easier to track performance across weeks and months. We listened!
Read more about Parse.ly’s beefed-up historical analytics.
Track syndicated content
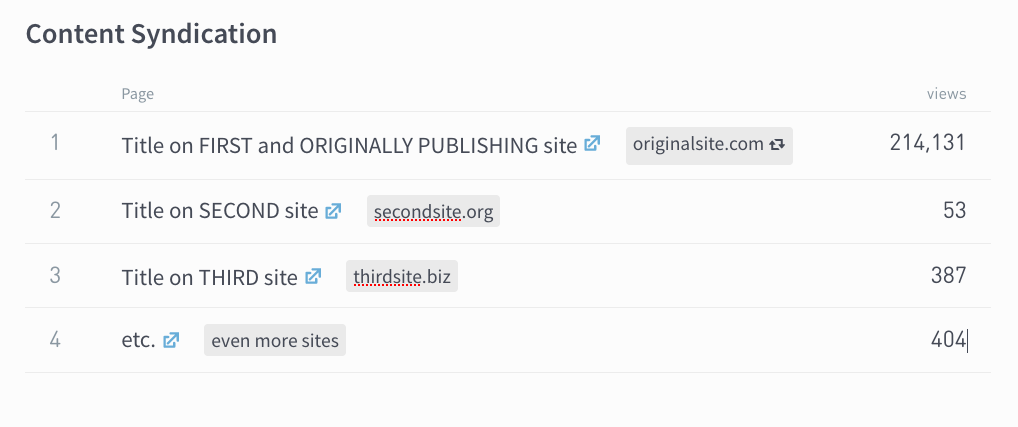
If you syndicate content, you know that it’s a pain to manually aggregate the metrics for the same articles on different sites. With Network Syndication Tracking, you can now easily measure the success of reposting articles across your owned sites.
Read more about Network Syndication Tracking.
Understand how your tags work together
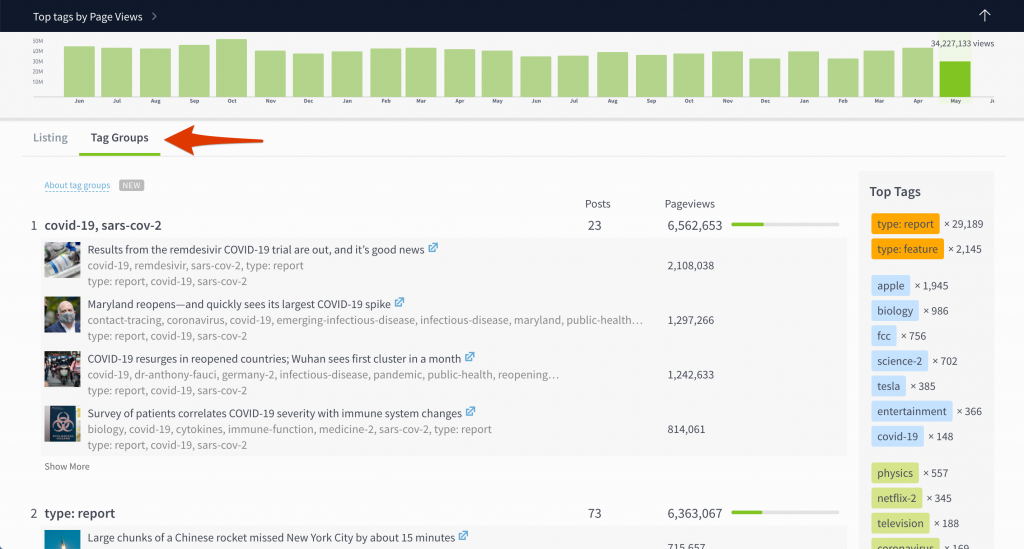
With Tag Groups, you can see what content contributes to a tag’s traffic, what tags get used widely, and which tags frequently appear together. This should help you understand how tags are applied to content and give you insight into narratives and themes that you might have missed otherwise.
April 29, 2020
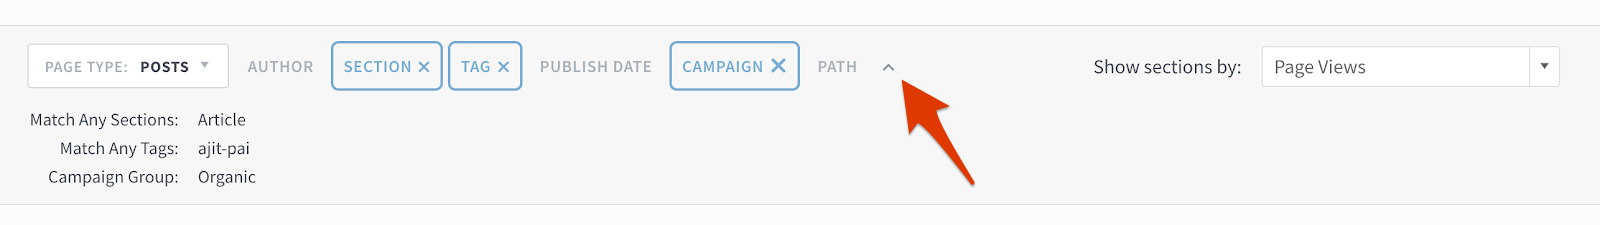
Filters get a new look
Previously, when you added a bunch of filters, it felt like you had to scroll down for miles to reach your results. Not anymore. We redesigned filters to free up vertical space and allow filtered results to appear “above the fold” for complex queries.
Like before, you can edit filters by clicking on the relevant filter button. Once you’ve selected criteria, click Apply Filters (this part’s new).
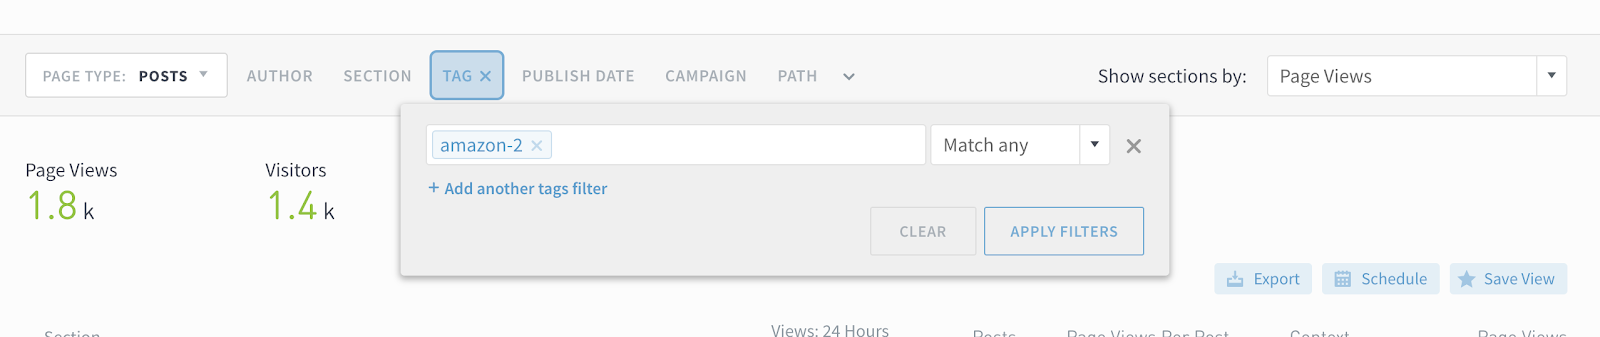
Active filters are highlighted in blue:

Click the carat button to see a summary of what filters are applied.
March 11, 2020
Beta feature: Benchmark authors, sections, and tags
Benchmarks is a new beta feature for comparing performance. It’s for folks who regularly ask questions like “What are the growth opportunities for me or my team?” or “How can we make our content strategy more efficient?”
Read the announcement to learn more about how to use Benchmarks.
To begin comparing performance, go to an author, section, or tag details page:
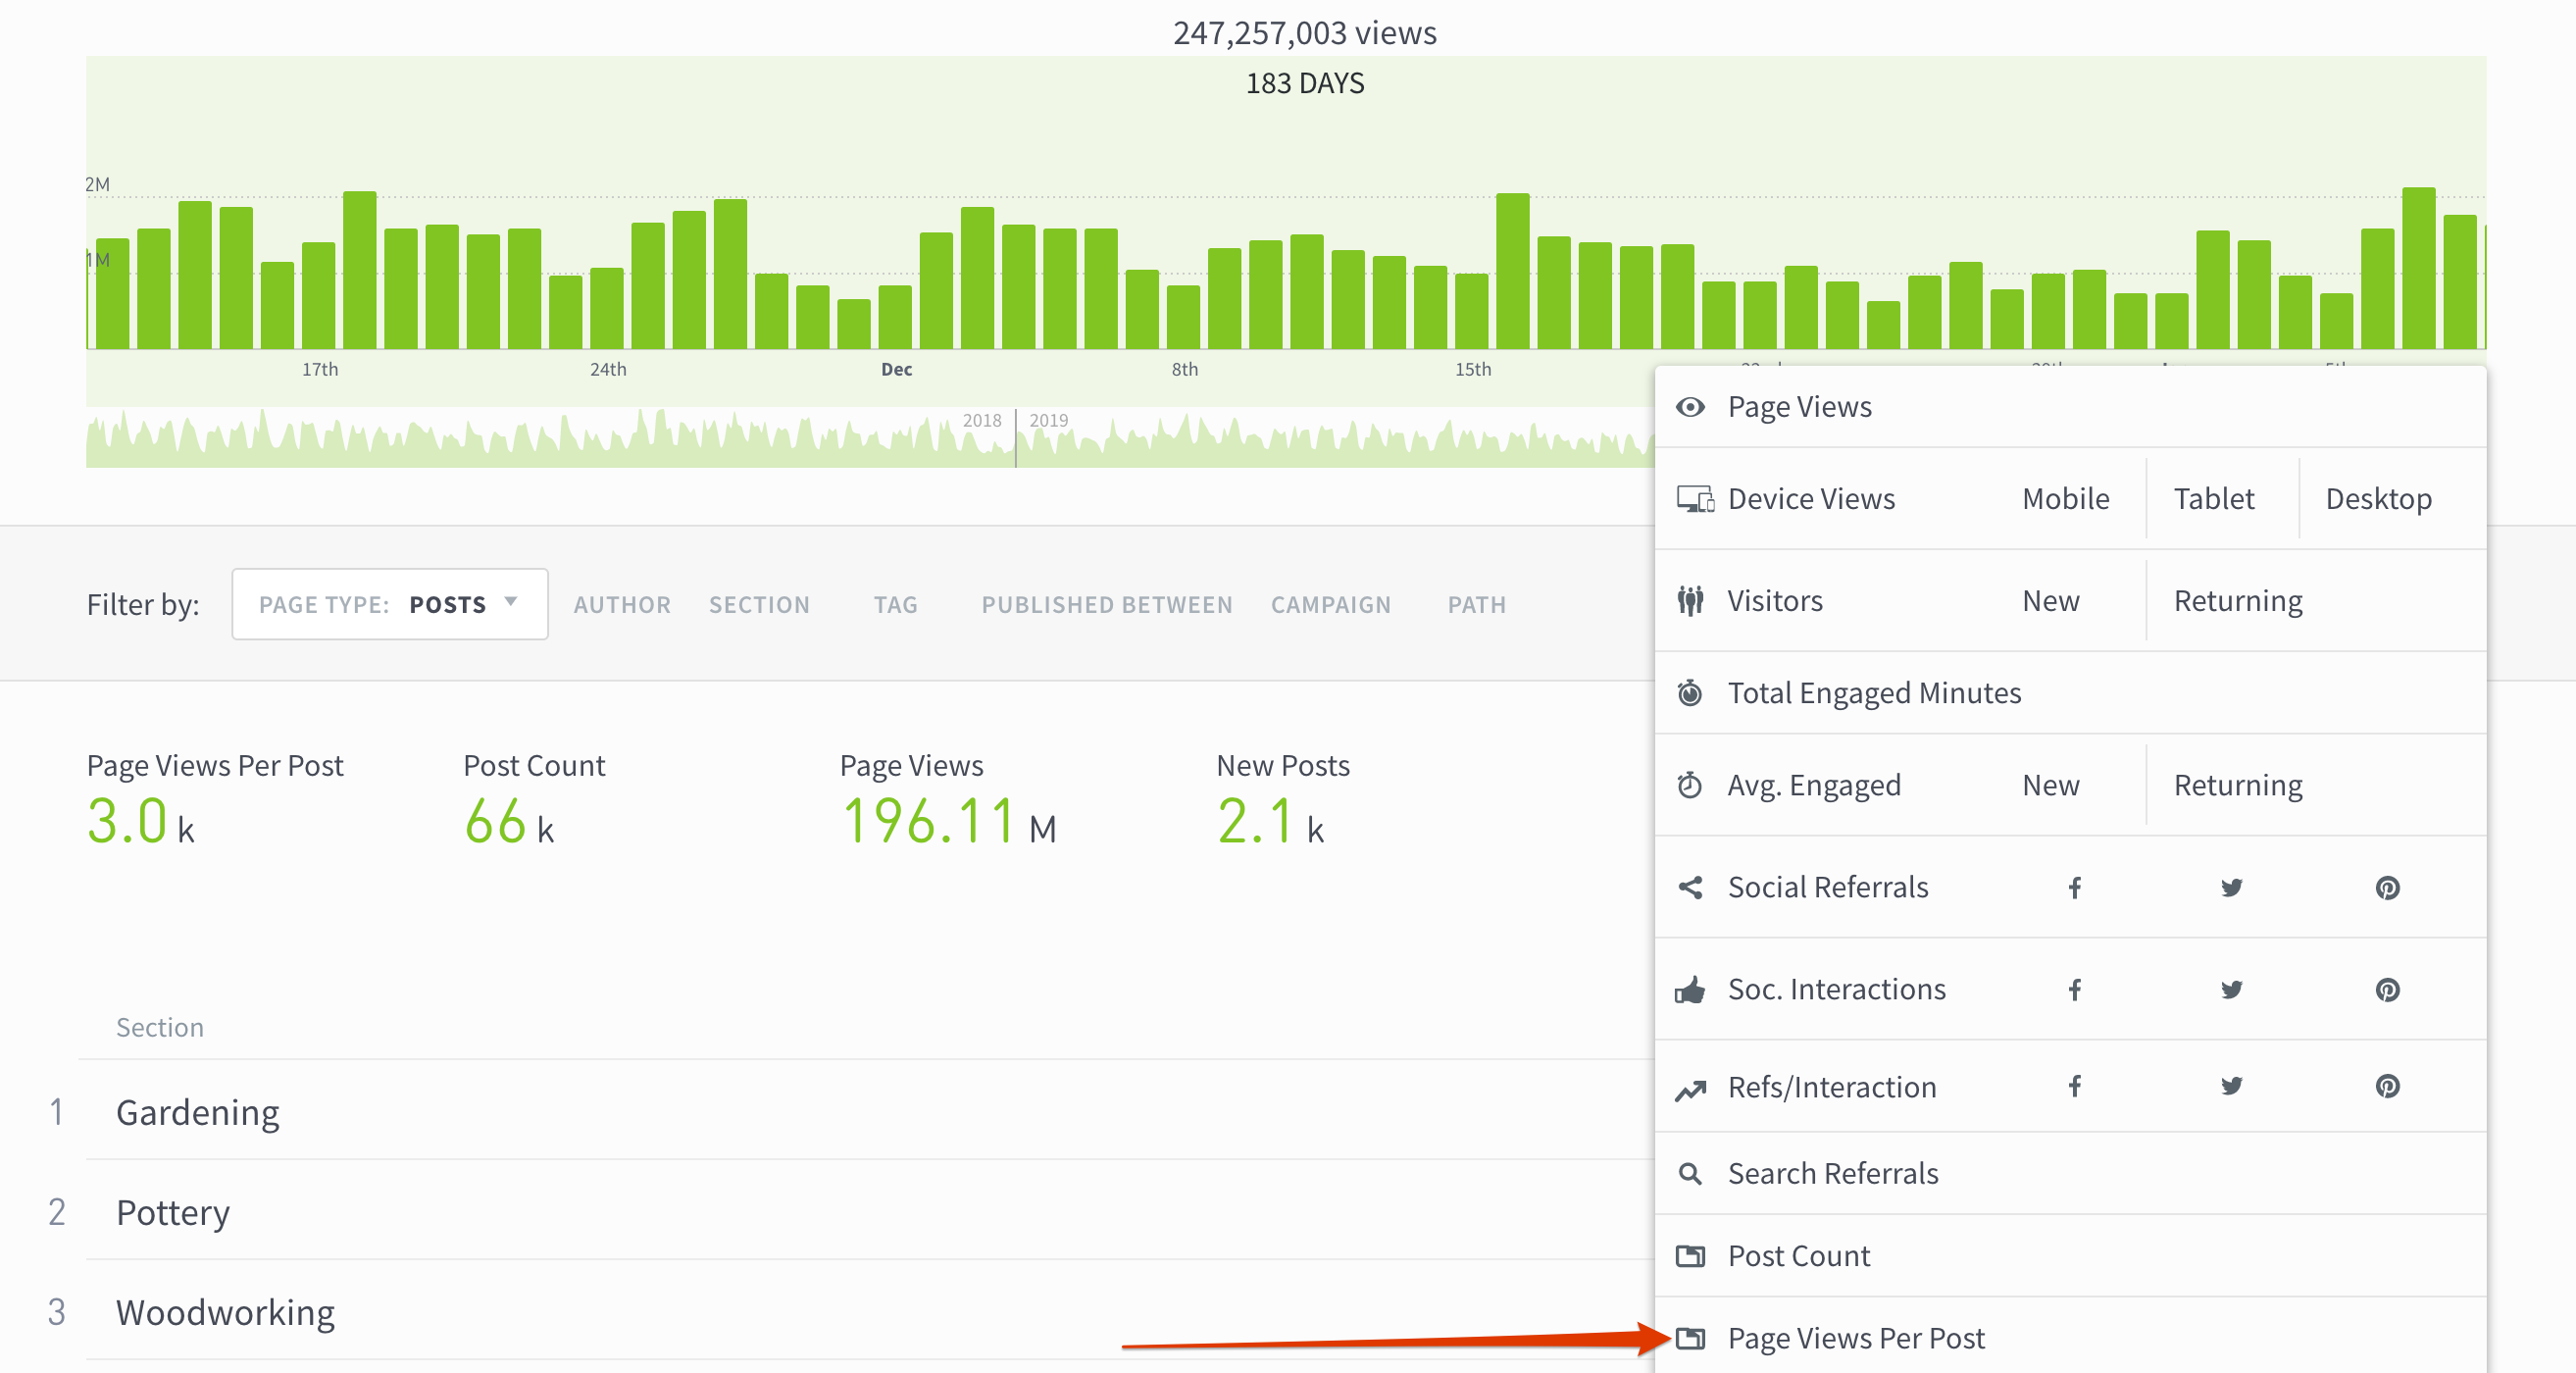
Sort by page views per post
See which authors, sections, and tags are most efficient at getting page views. For instance, sorting by page views per post on a tag listings page might suggest writing more about content topics that have many page views per post, but fewer posts overall.
Audience segments for multiple sites
Now you can segment audiences across all the sites in your network. If you’re using a segment to track “Registered Users” to your help site, blog, and main site in Parse.ly, you can now see”Registered Users” to all three sites from one place. Reach out to your Parse.ly account representative or email us at hello@parsely.com for more info.
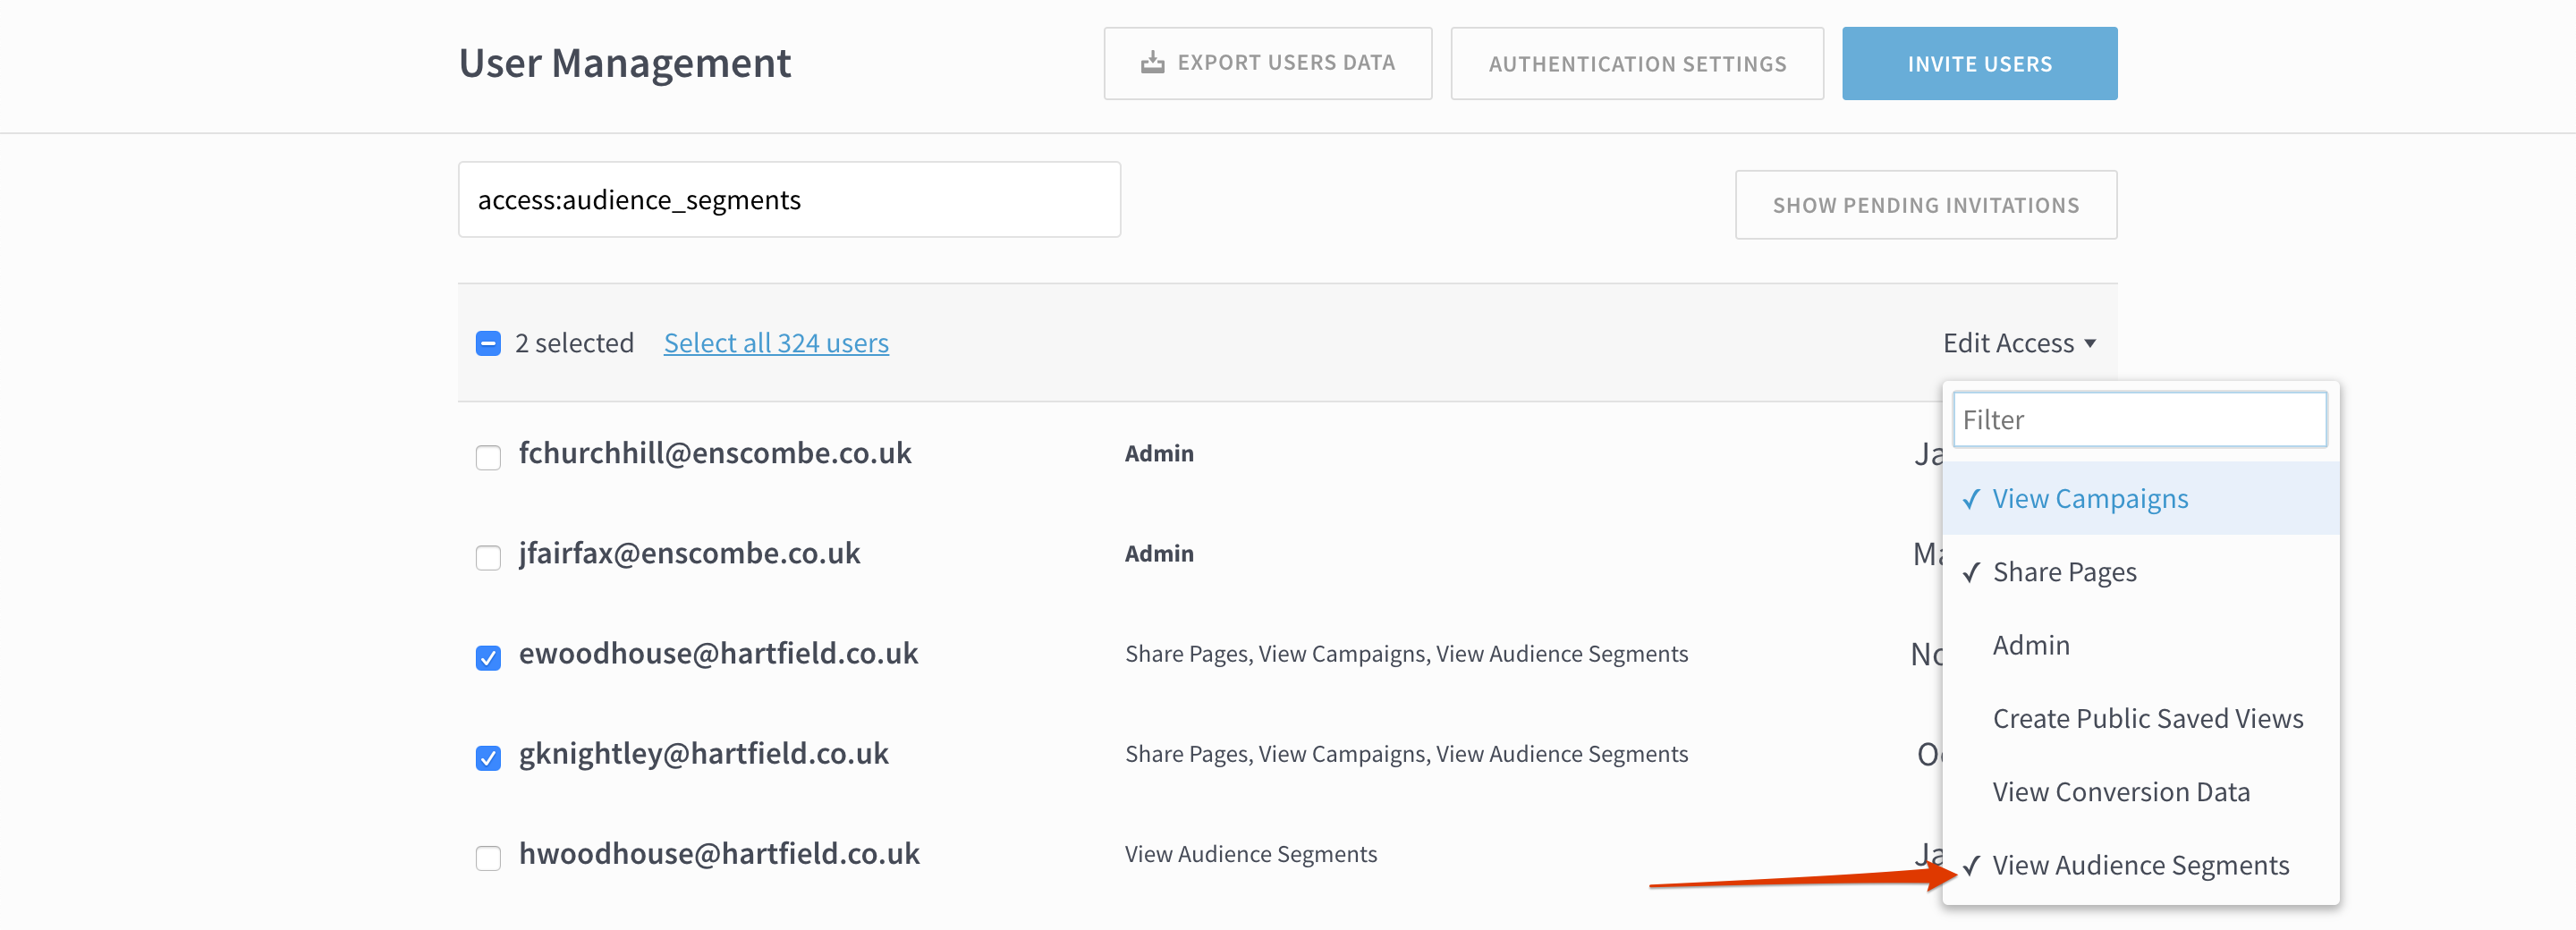
Control user access to audience segments
Admins can now control which users have permissions to see audience segments in the Parse.ly dashboard.
When inviting new users from the User Management page, check the “View Audience Segments” box to give them permission to see audience segments.
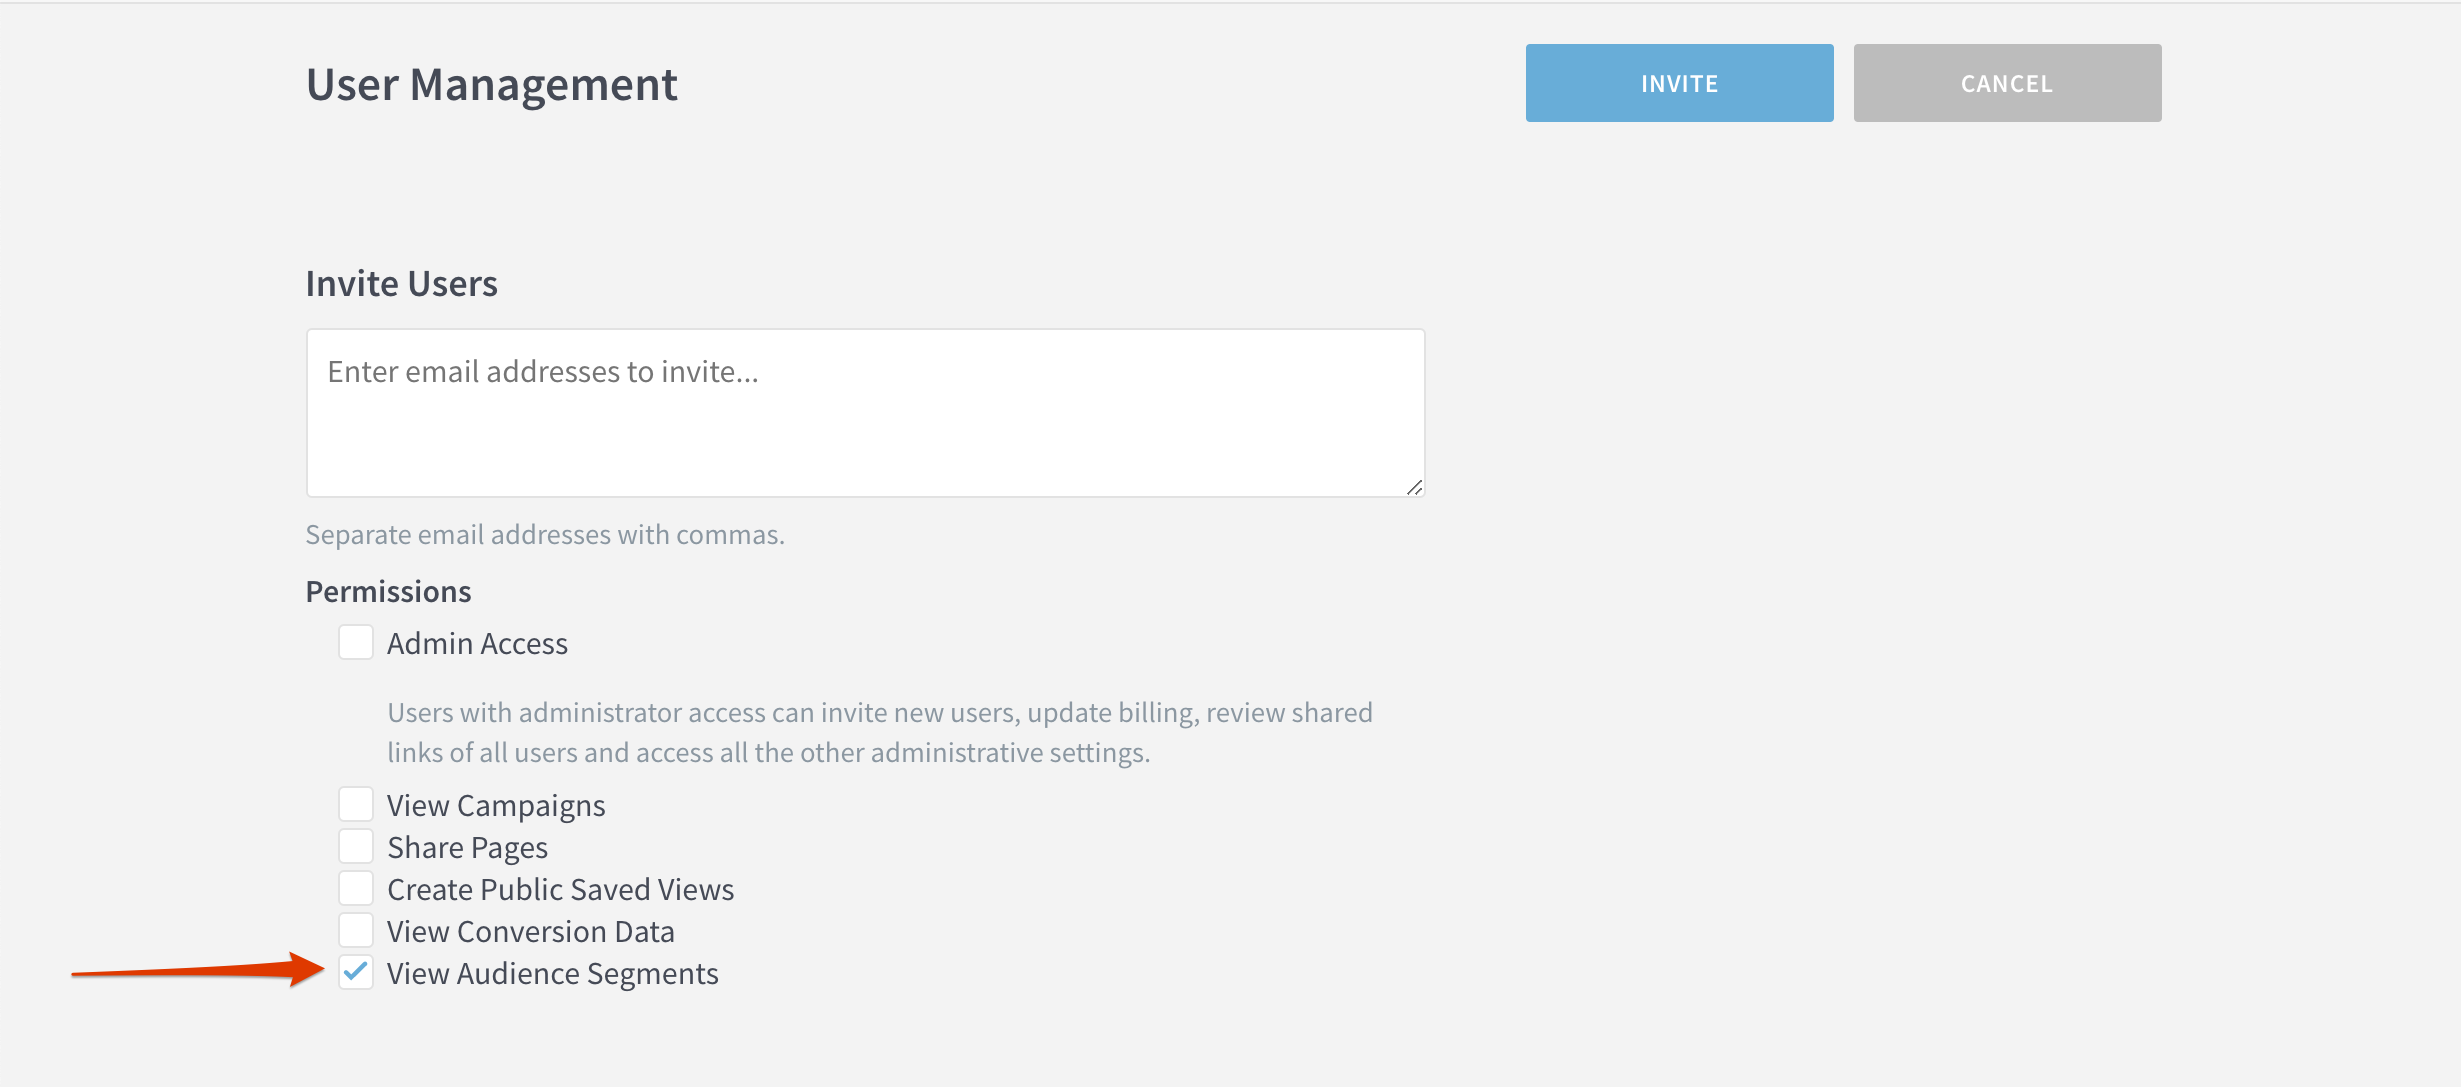
To give existing users permission, go to the User Management page, select the appropriate users, click Edit Access and select “View Audience Segments.”
February 5, 2020
iOS app update
We’ve made some in-front-of and behind-the-scenes improvements to Parse.ly’s iOS app. First up, the app now properly displays full screen on iOS devices like iPads and larger iPhones. Secondly, we now use AutoFill on iOS for easy integration with any password manager you have installed on your Apple device.
If you have Automatic Updates enabled (we’d recommend this), there’s nothing for you to do. Otherwise, you can get the latest update from the App Store.
Show site name on big screen displays
Do you operate multiple sites and want to display their stats on a big screen around the office? Now you can choose to display the site name in the fullscreen version of Overview.
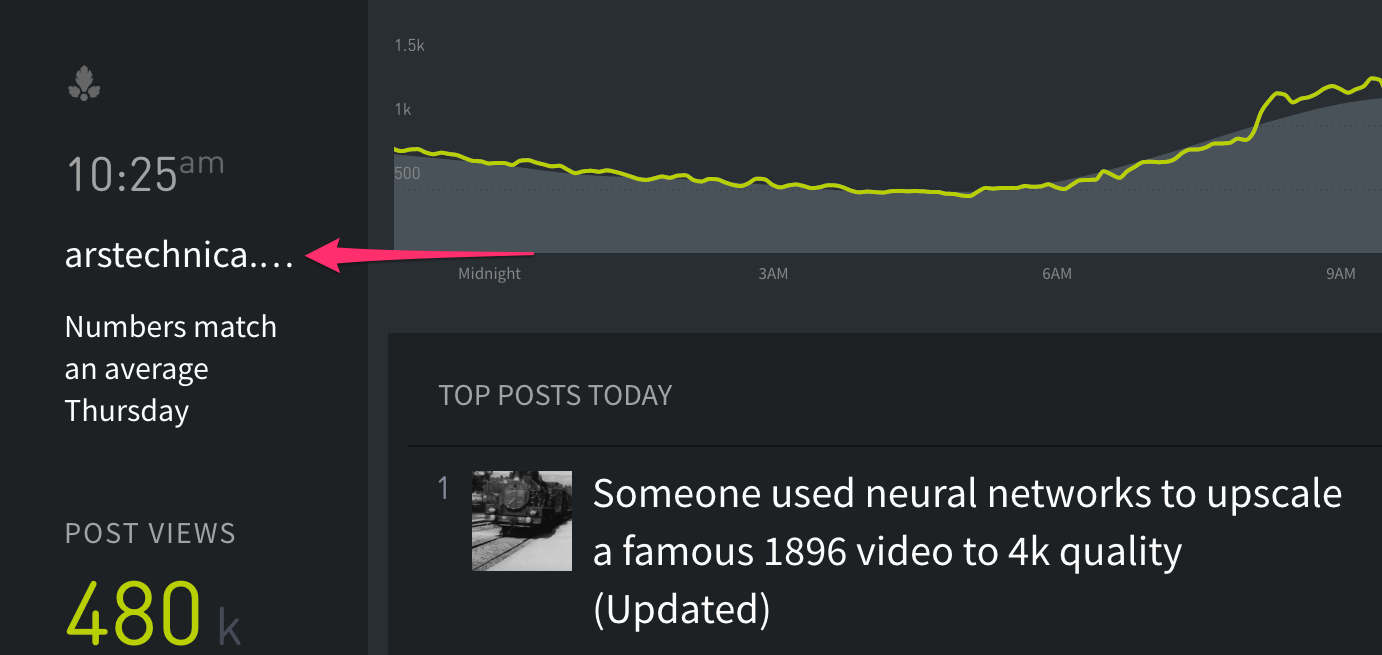
- From the Overview page, click to expand the window (the arrows on the right side, to the right of the gear icon).
- Click the gear icon.
- Under Metrics and Graph, click Today.
- Check the box next to Site Name.
We also made fullscreen Overview more responsive to your screen size; the text should bigger and easier-to-read from far away.
Better keyboard navigation for accessibility devices
If you use an accessibility device, you can now use keyboard commands to navigate through the dashboard.
- Type TAB to navigate to most elements, like buttons or links
- Type SHIFT + TAB to navigate backwards
- Type ENTER to click on an element
January 7, 2020
Show metadata for non-post pages
Parse.ly distinguishes between webpages that contain a singular piece of content (referred to as “posts”), and those that don’t (homepages, index pages, section pages, photo galleries, etc, which are referred to as “non-post pages”). If you send metadata for non-post pages (such as a thumbnail image, title, author, section, or tags), they will now show up on the details page, like this:

November 20, 2019
Measure native iOS and Android app traffic
It’s Parse.ly’s mission to help you understand your audience no matter where your content lives. You can now easily see what content gets the most engagement on your native iOS and Android apps.
On the Channels page, compare native iOS and Android traffic to other channels to get an idea of where your audience is distributed.
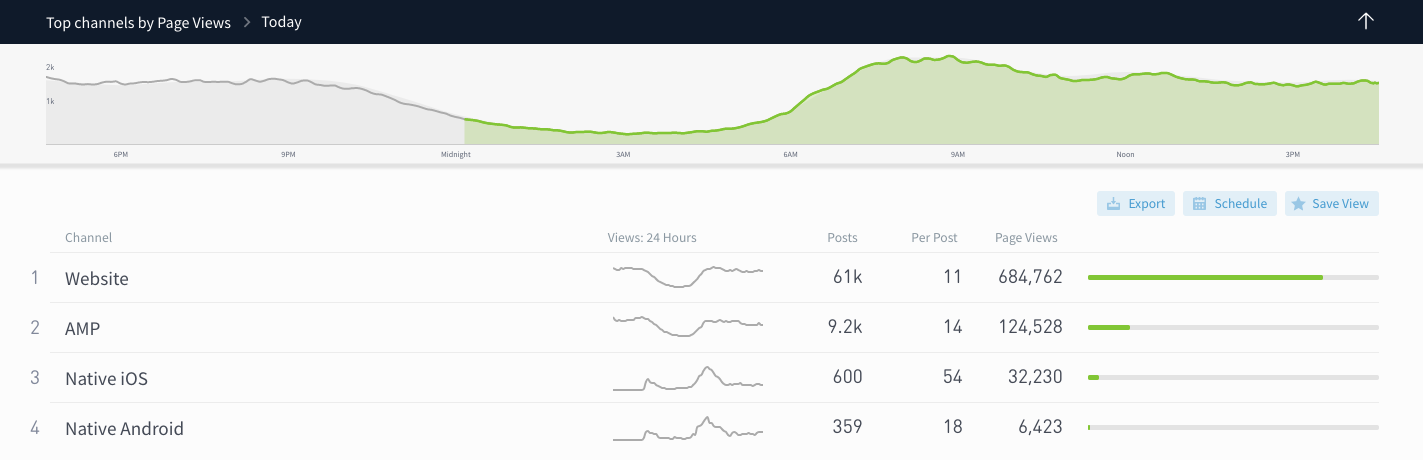
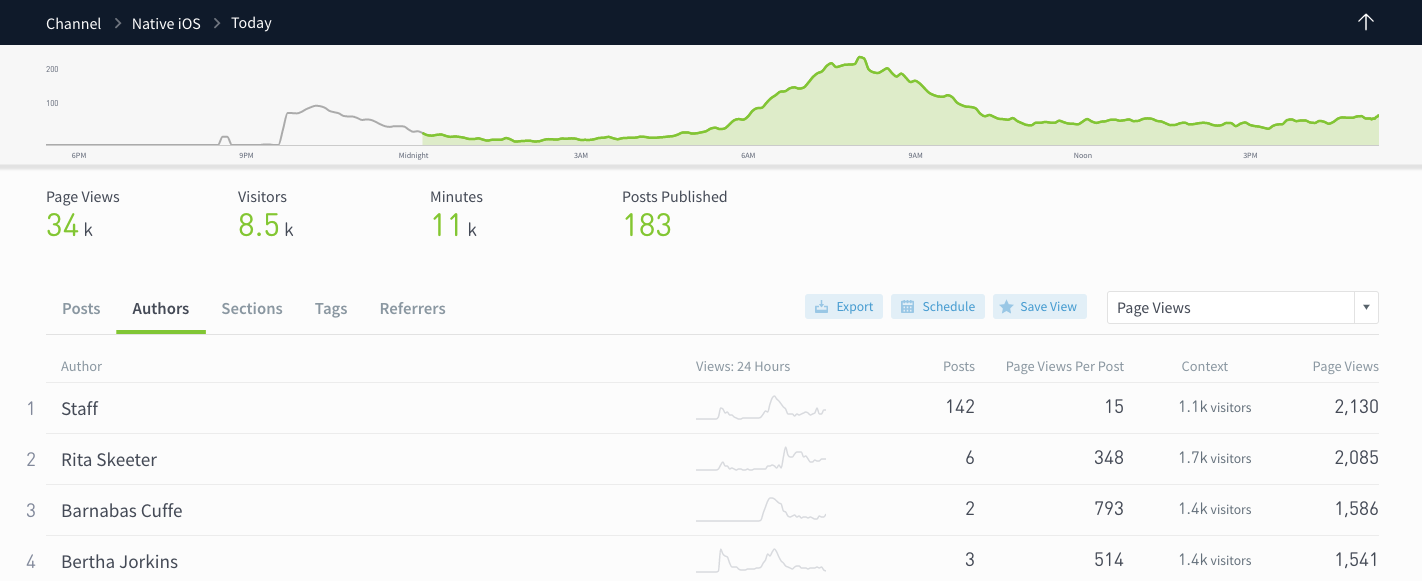
Clicking on Native iOS or Native Android takes you to a details page for the specific channel, where you can drill down into what posts, authors, sections, and tags resonate most with your mobile app users.
A few notes for customers who already have integrated Parse.ly’s iOS and Android SDKs:
- Your app traffic should show up on the Channels page automatically. You will see data populated in these channels from November 12, 2019 moving forward.
- Did you know our SDKs support engaged time tracking? If engaged minutes are showing as 0, be sure to upgrade to the latest Parse.ly SDK.
If you haven’t yet set up app tracking in Parse.ly, learn more about how to get started by emailing us.
Compare audience segments
We’ve given audience segments a home, under their very own tab.
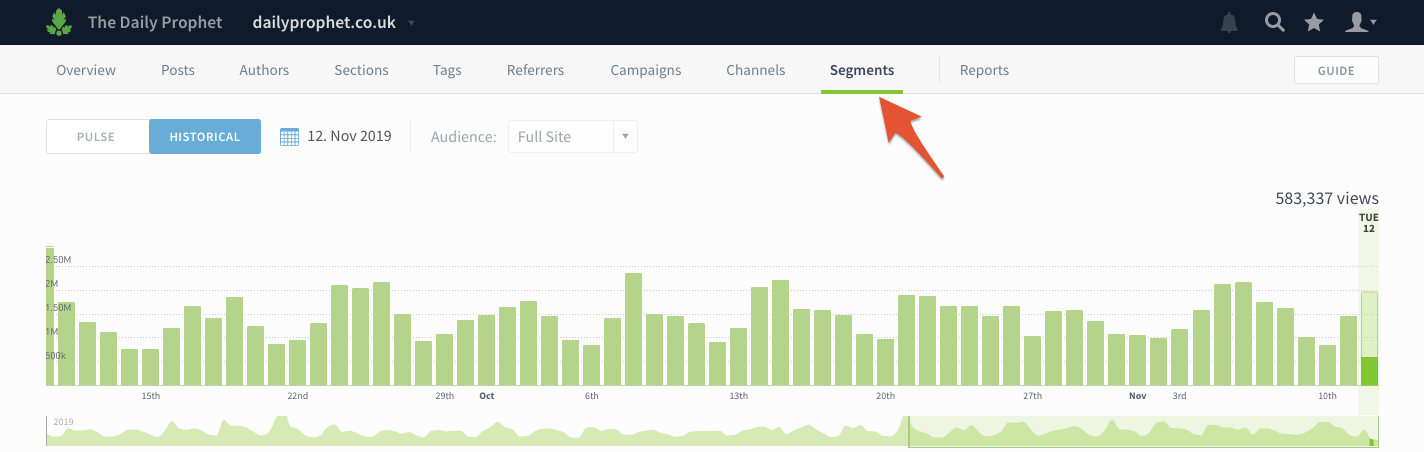
You can now easily compare how traffic for segments varies without clicking back and forth between filtered views.
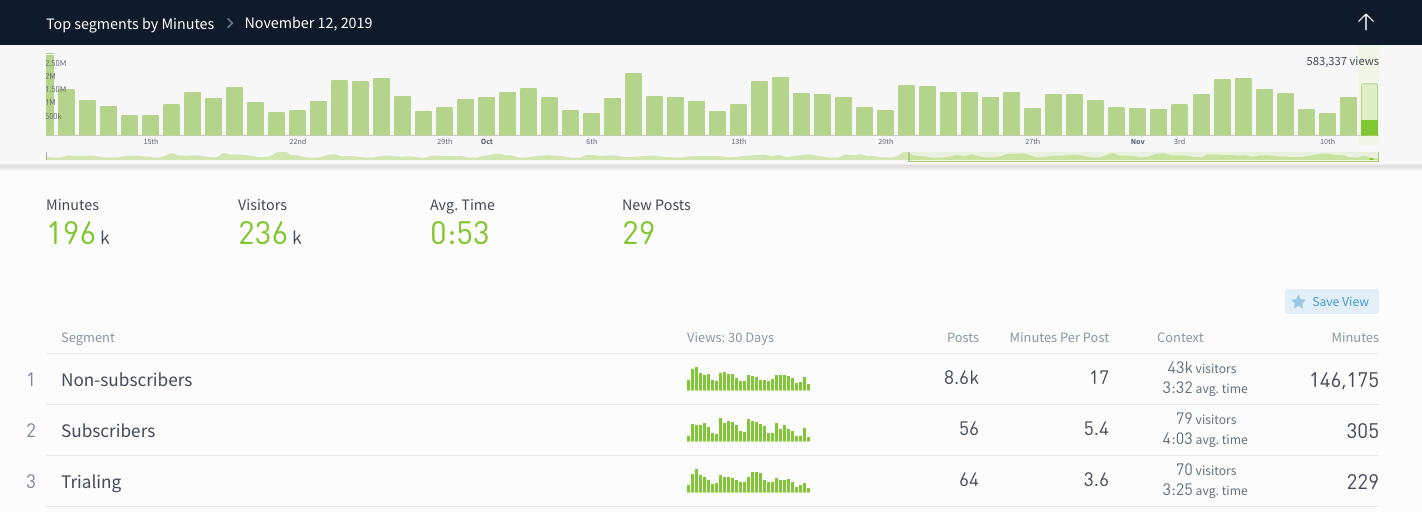
Click on a segment to see a details page with breakdowns of the most popular posts, sections, referrers, etc.
You can learn more about audience segments in this help doc.
Don’t have any segments set up? Send us an email to learn how you can use Parse.ly to segment by user type and geography.
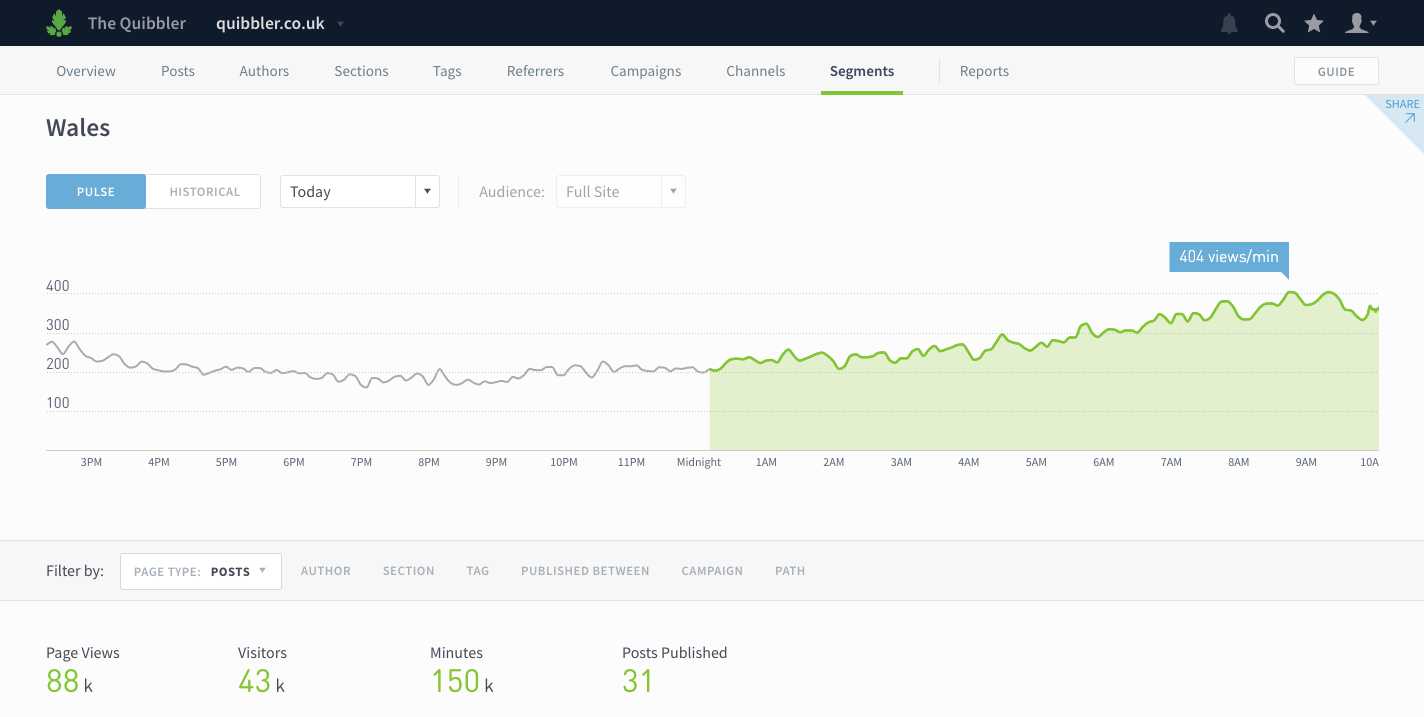
Identify older posts doing well now
Your archive has heavy-hitters in it; you just have to find them. Answer questions like “What posts published more than 6 months ago are still bringing in traffic?” using the updated Published Between filter.
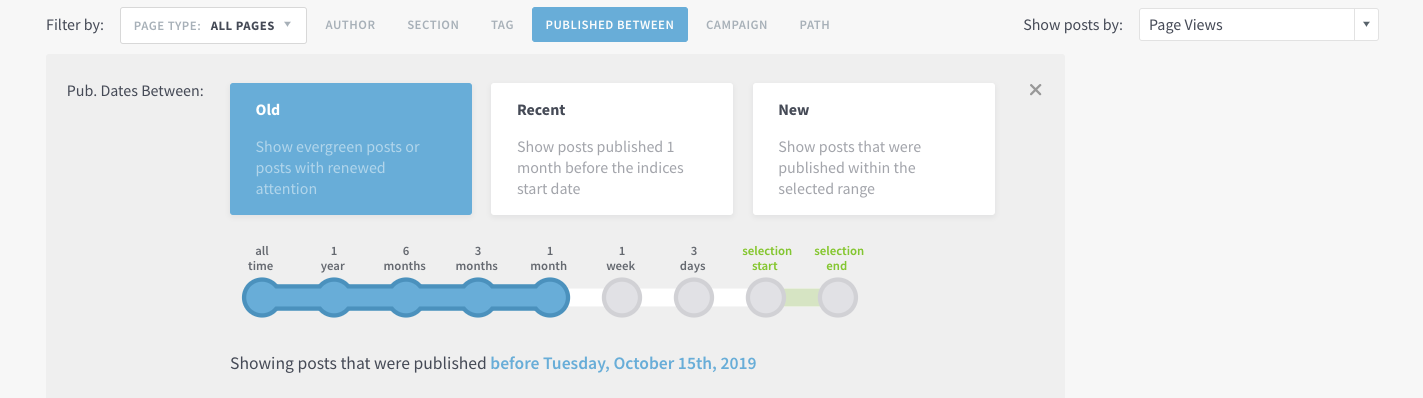
Click the Published Between filter and then click and drag to select the publish date range. You can also choose from preset options to answer these questions:
- What old posts are doing well?
- What recently published posts are doing well?
- What new posts are doing well?
We hope this change will make it easier for you to find those hidden gems in your archive that have the potential to become evergreen mainstays. Tip: use this filter while looking at top posts referred by Google to identify steady sources of SEO.
Filter by Page Type
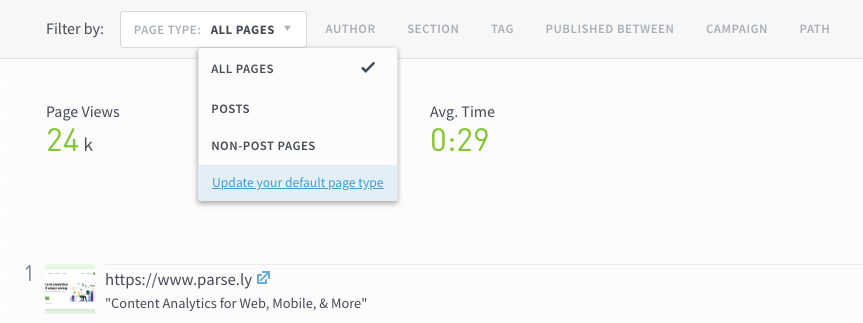
We’ve updated the look of one filter to make it clearer what page types you’re seeing. Selecting All Pages or Non-post Pages will reveal pages not classified as posts, like homepages, index pages, and product pages. Admins can choose their organization’s default page type on the Preferences page.
October 23, 2019
Conversions
Parse.ly now offers the option to automate conversions reporting. Ensure your boss and colleagues know the impact your content is making, every week in an email. When someone asks, “What is this content doing for the business?”—you’ll have answer. And you’ll get back the hours you might spend combining conversions data from separate spreadsheets!
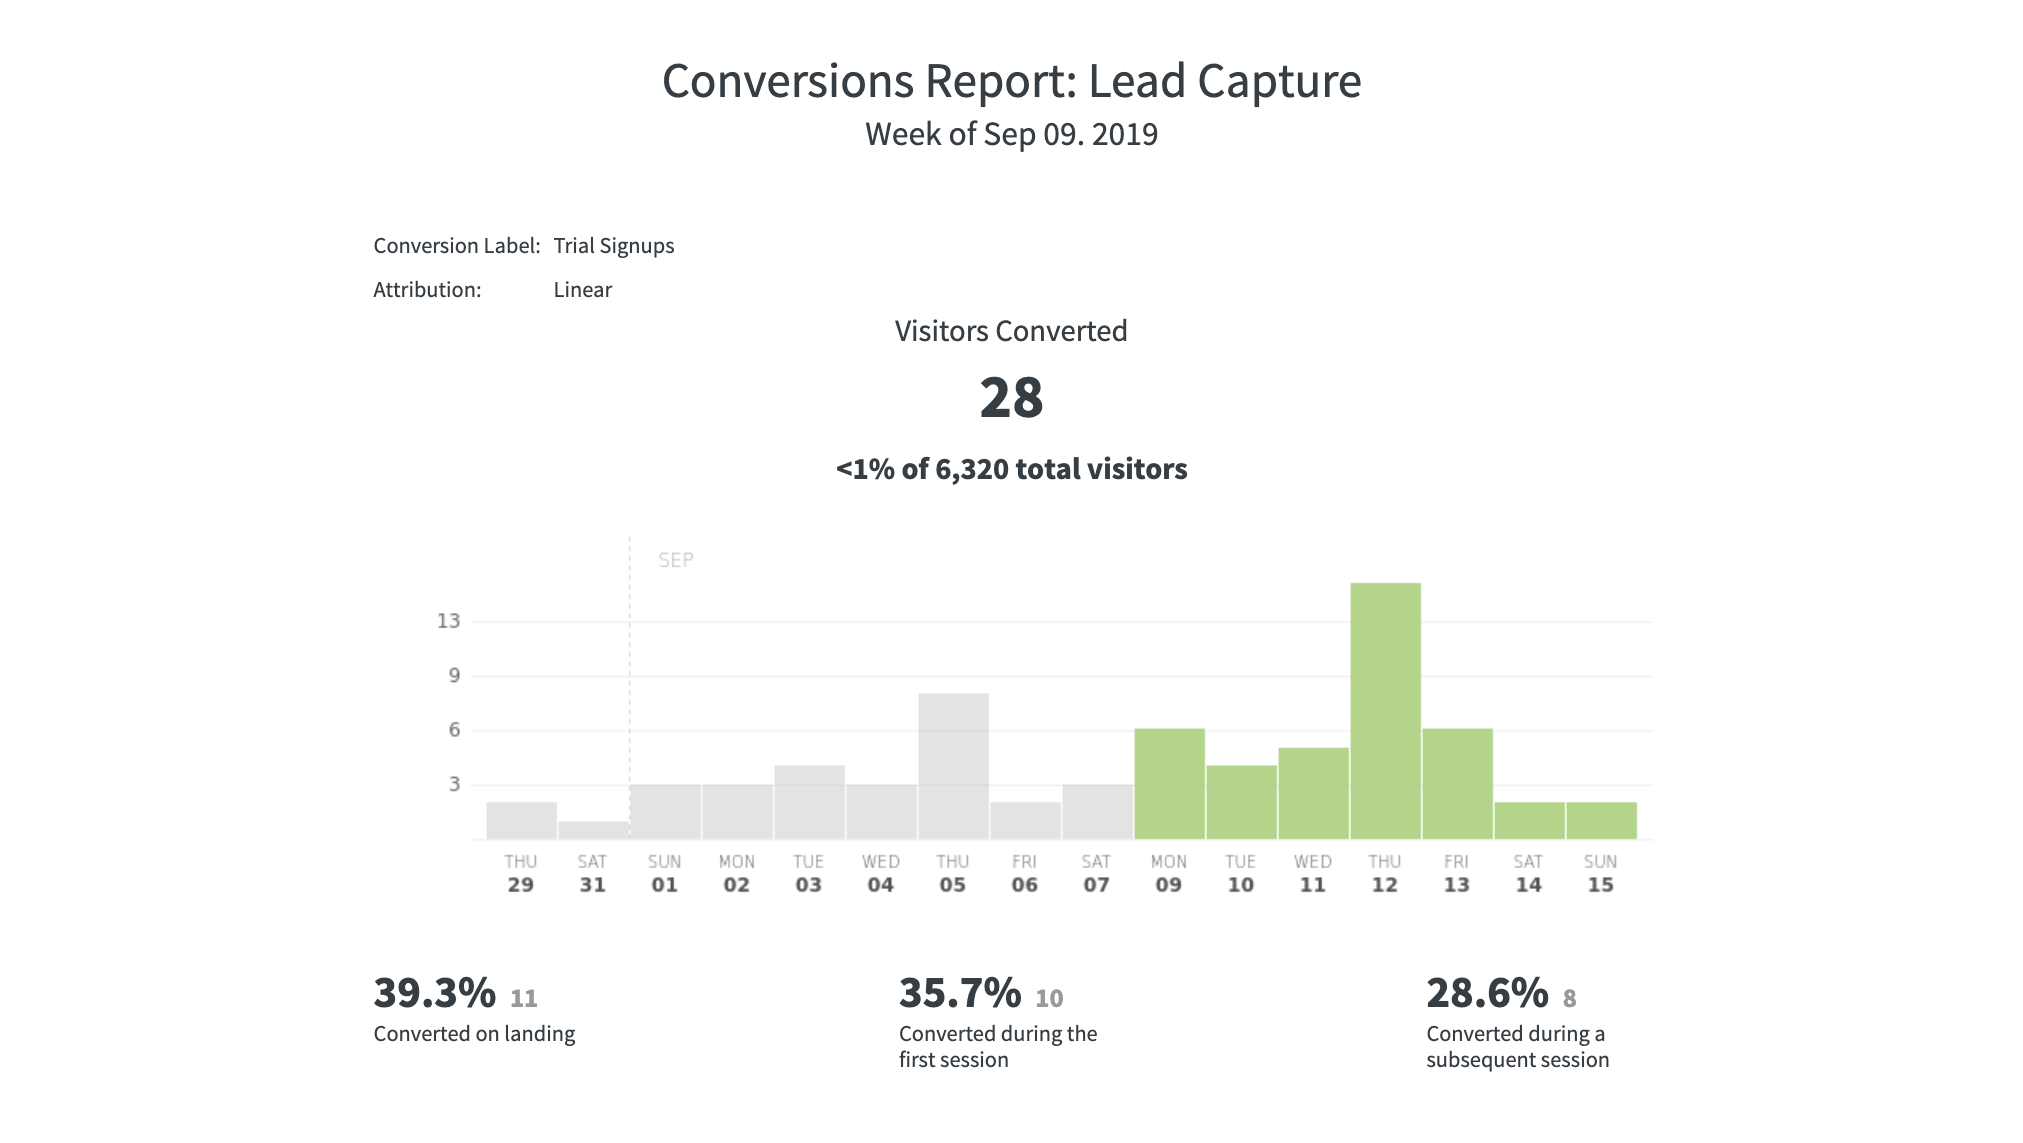
The conversions report shows
• content that converts the most readers • content that assists the most conversions • the types of conversions your content drives best
This feature is available at an additional cost. If you’re eager to get started, please reach out to your account rep or email hello@parsely.com to discuss possibilities and pricing. Or check out the announcement to learn more on your own first!
October 1, 2019
See and resend pending invites Network users
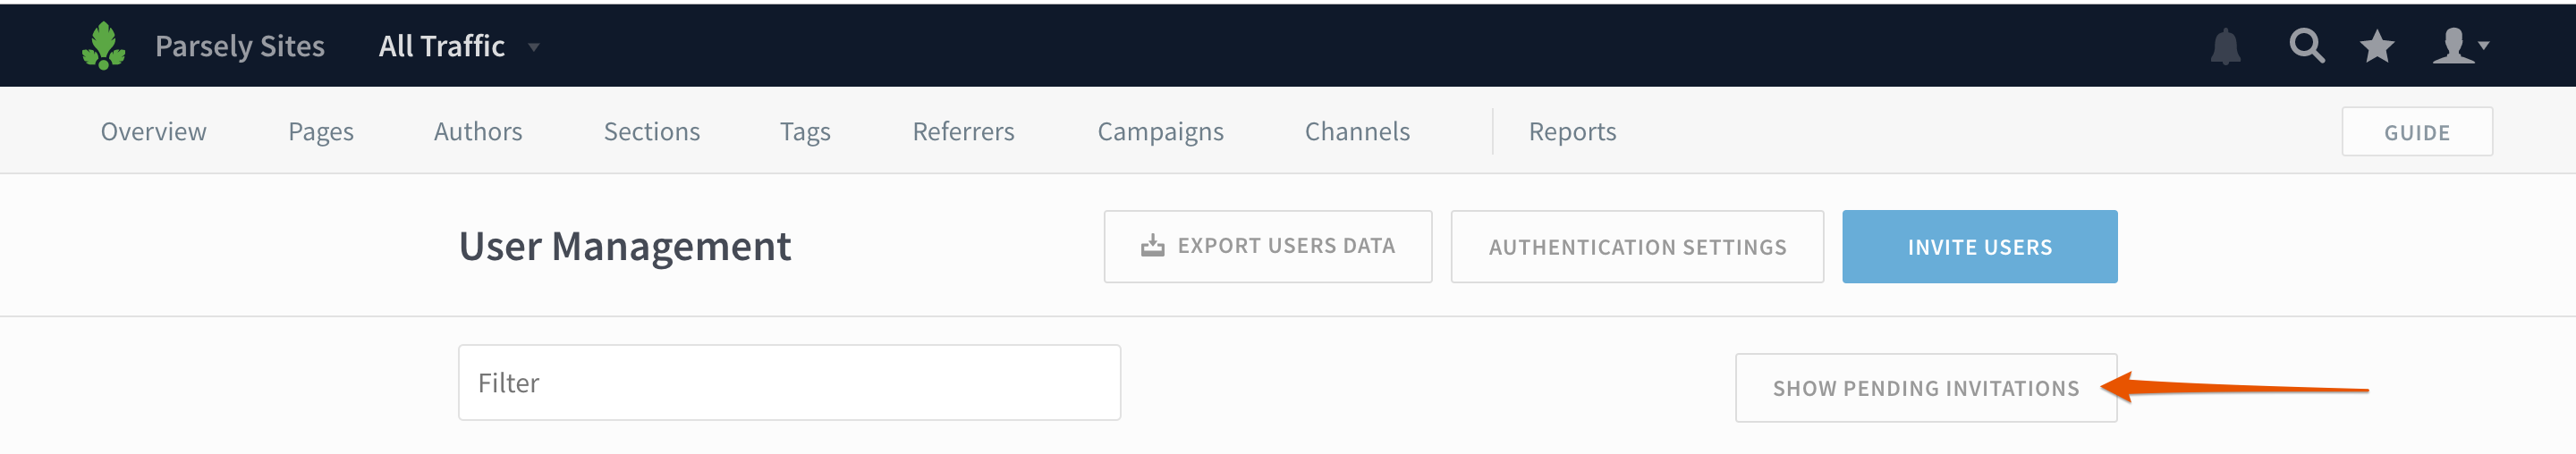
See and resend pending invites
Now admins can easily see which users haven’t accepted their invitation to create a Parse.ly account and give them a friendly reminder.
On the Users page, click Showing Pending Invitations. (If there are no pending invitations, this button won’t appear!)
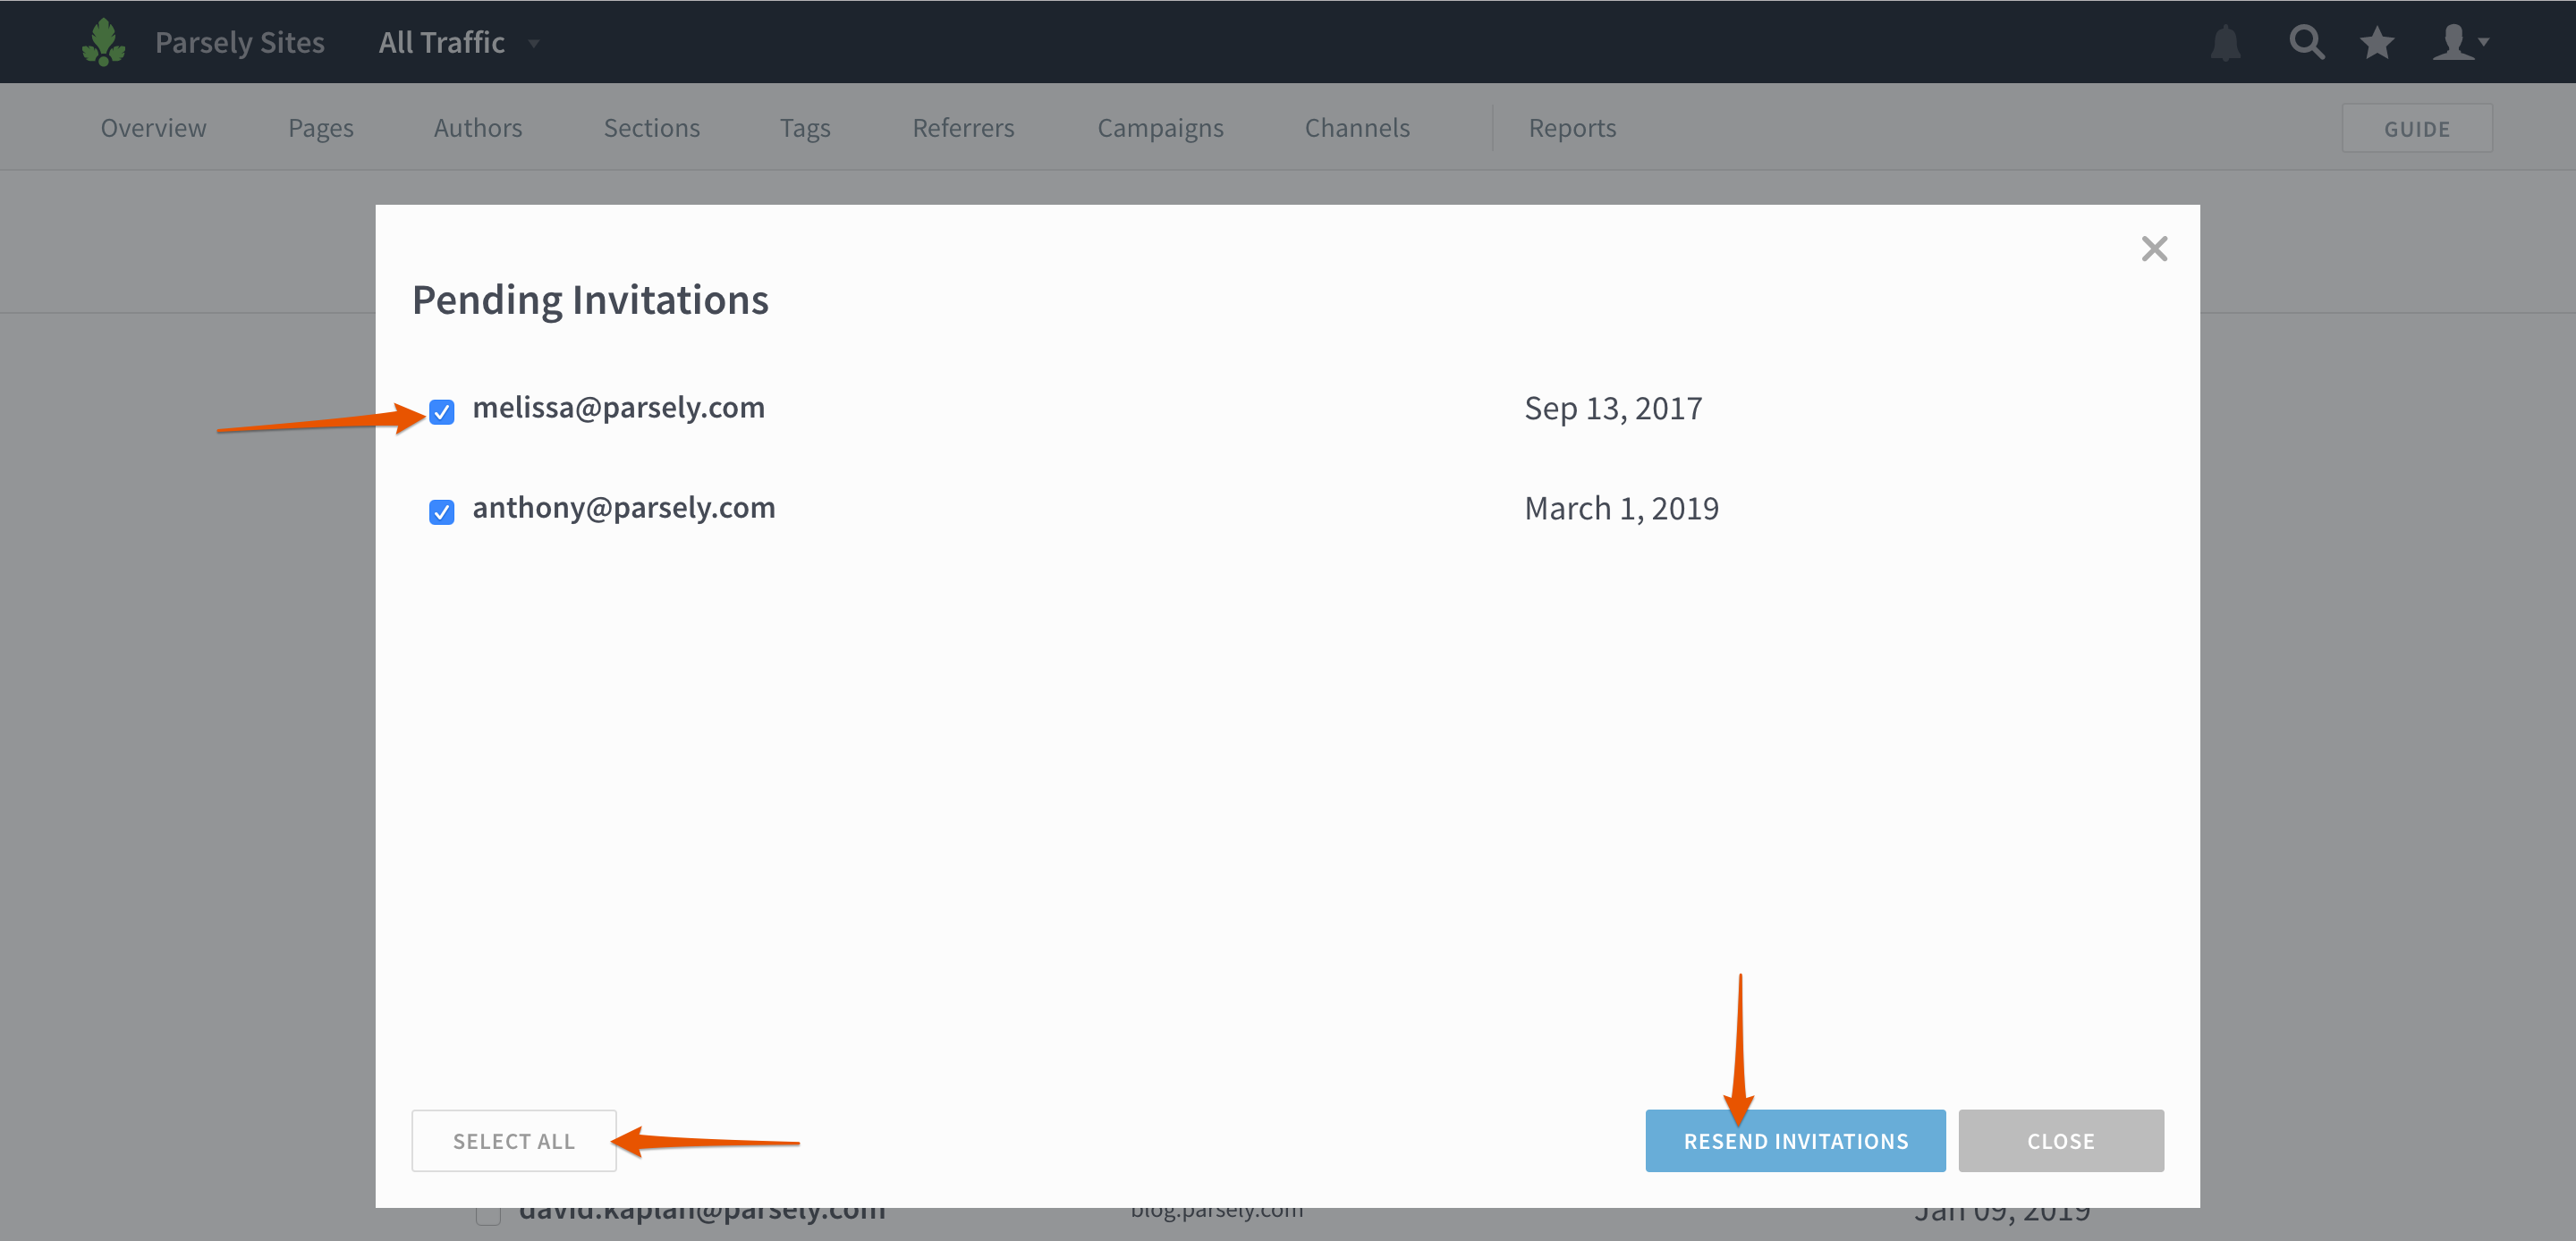
You’ll then see a list of pending invitations. Check the boxes next to individual users or click Select All to bulk invite. Click Resend Invitations, and you’re done!
Network users
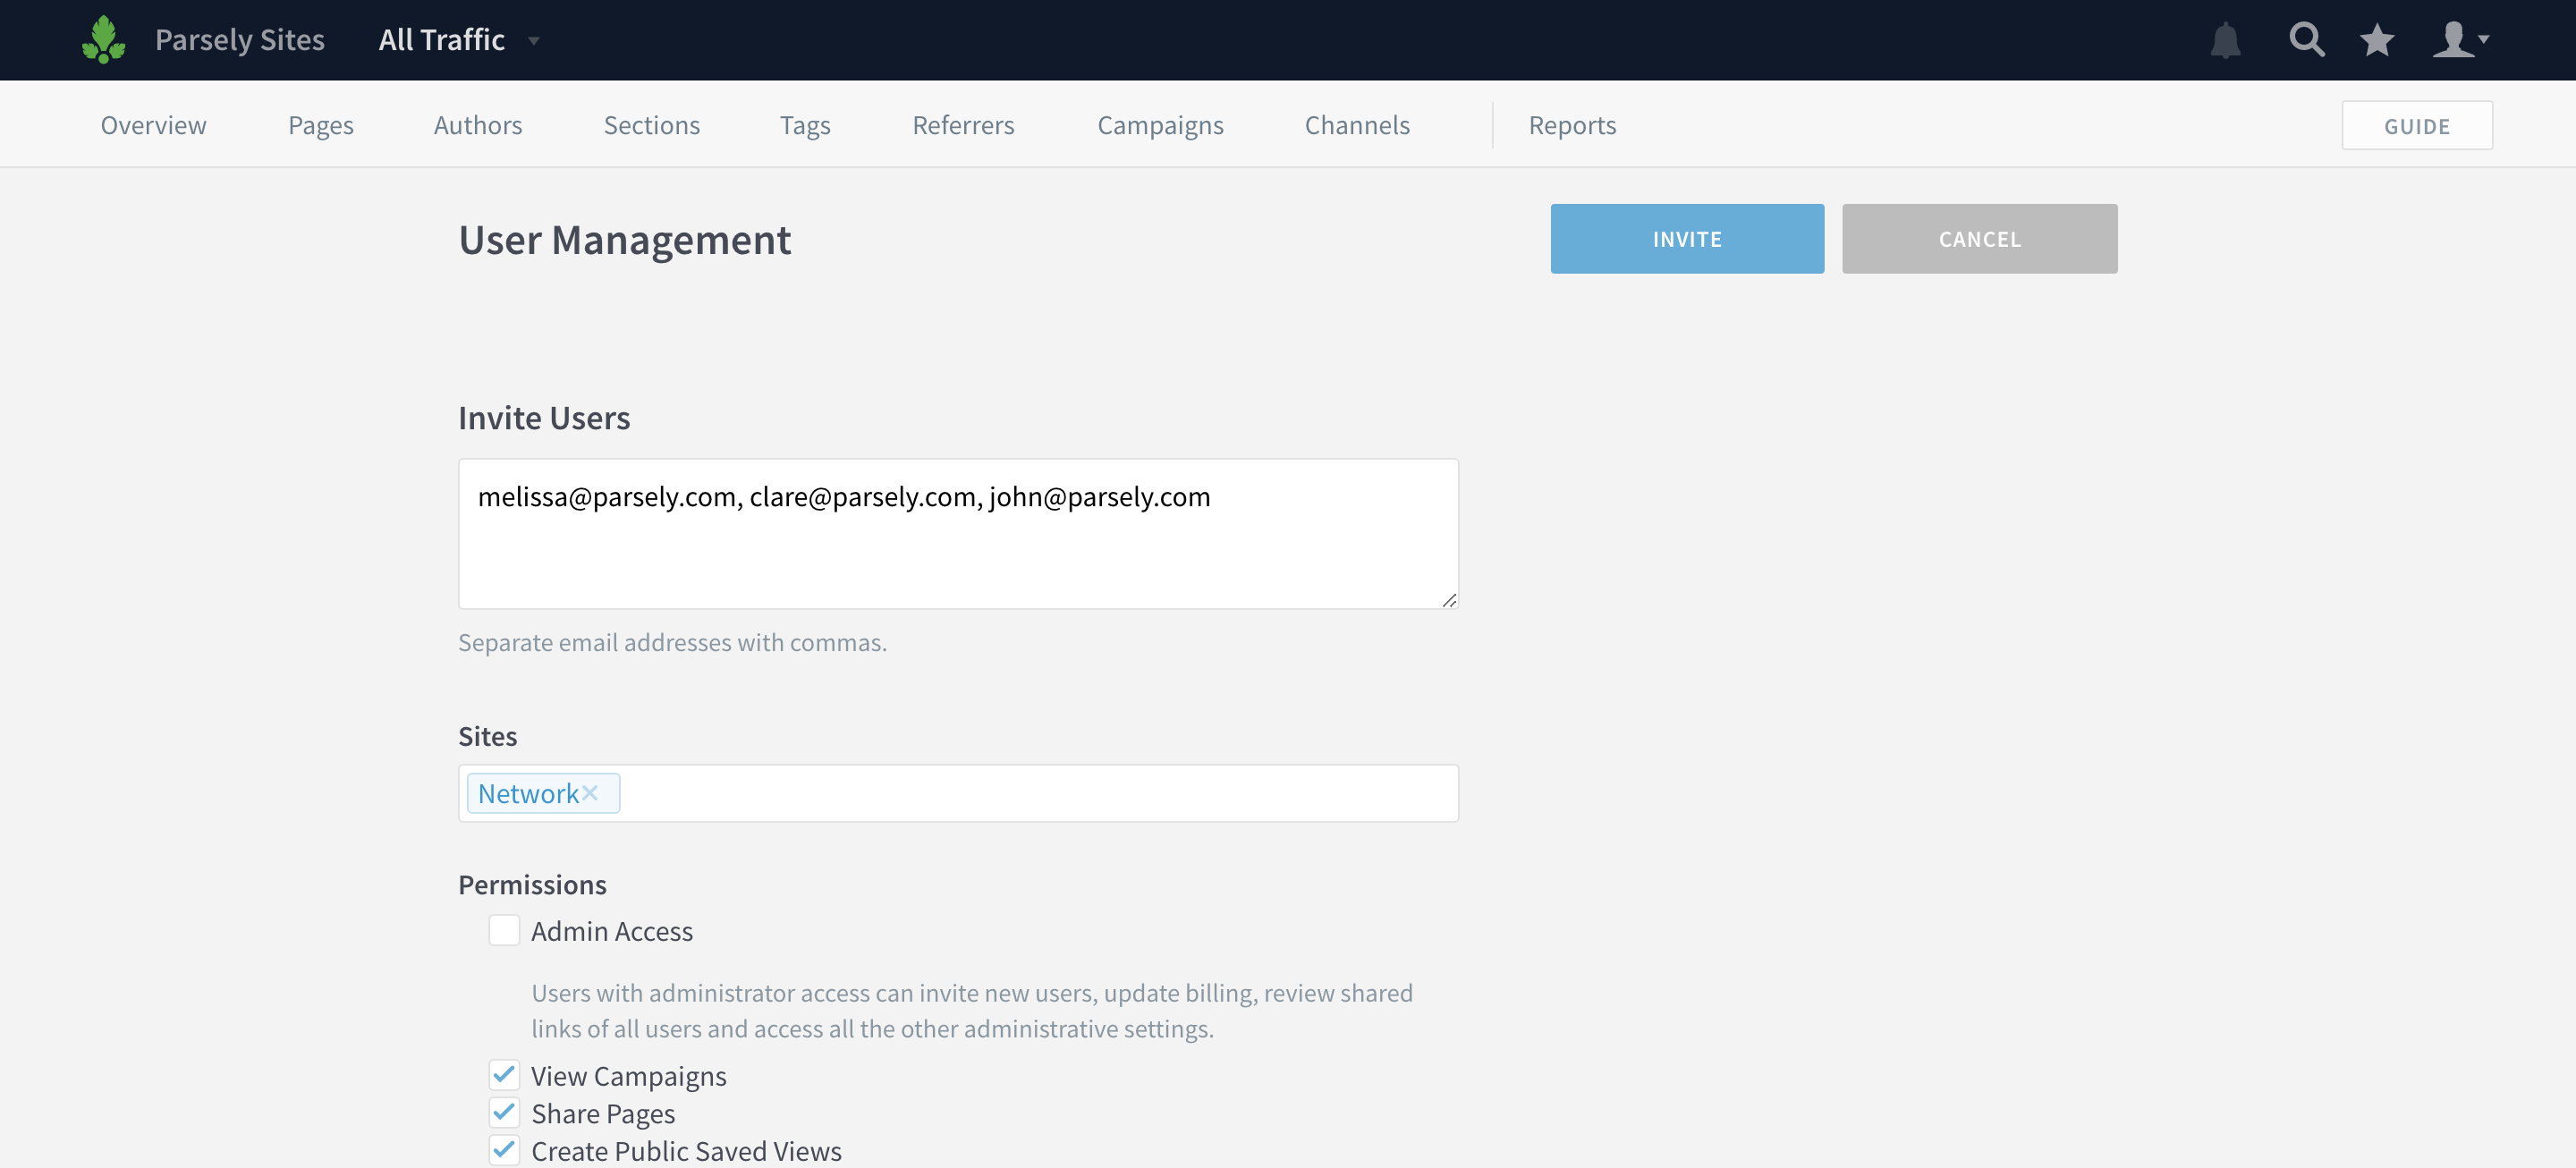
Network admins can now create “network users.” This is useful if you operate a large network of sites and want to grant users access to all current and future sites.
From the network-level Users page (tip: if you see “All Traffic” in the top left corner, you’re on the network level), click Invite Users.
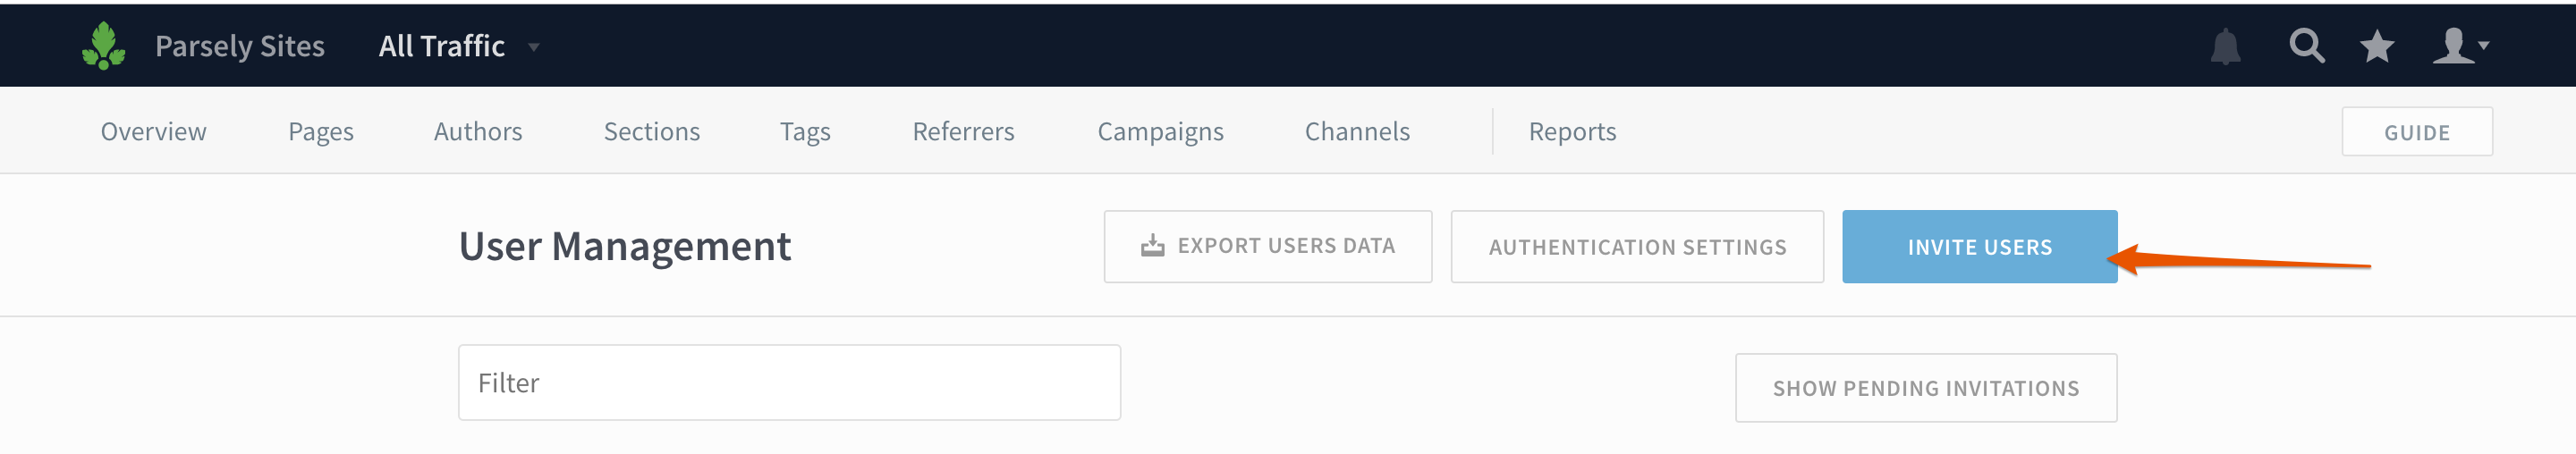
Type in a list of user email addresses and select Network from the Sites dropdown.
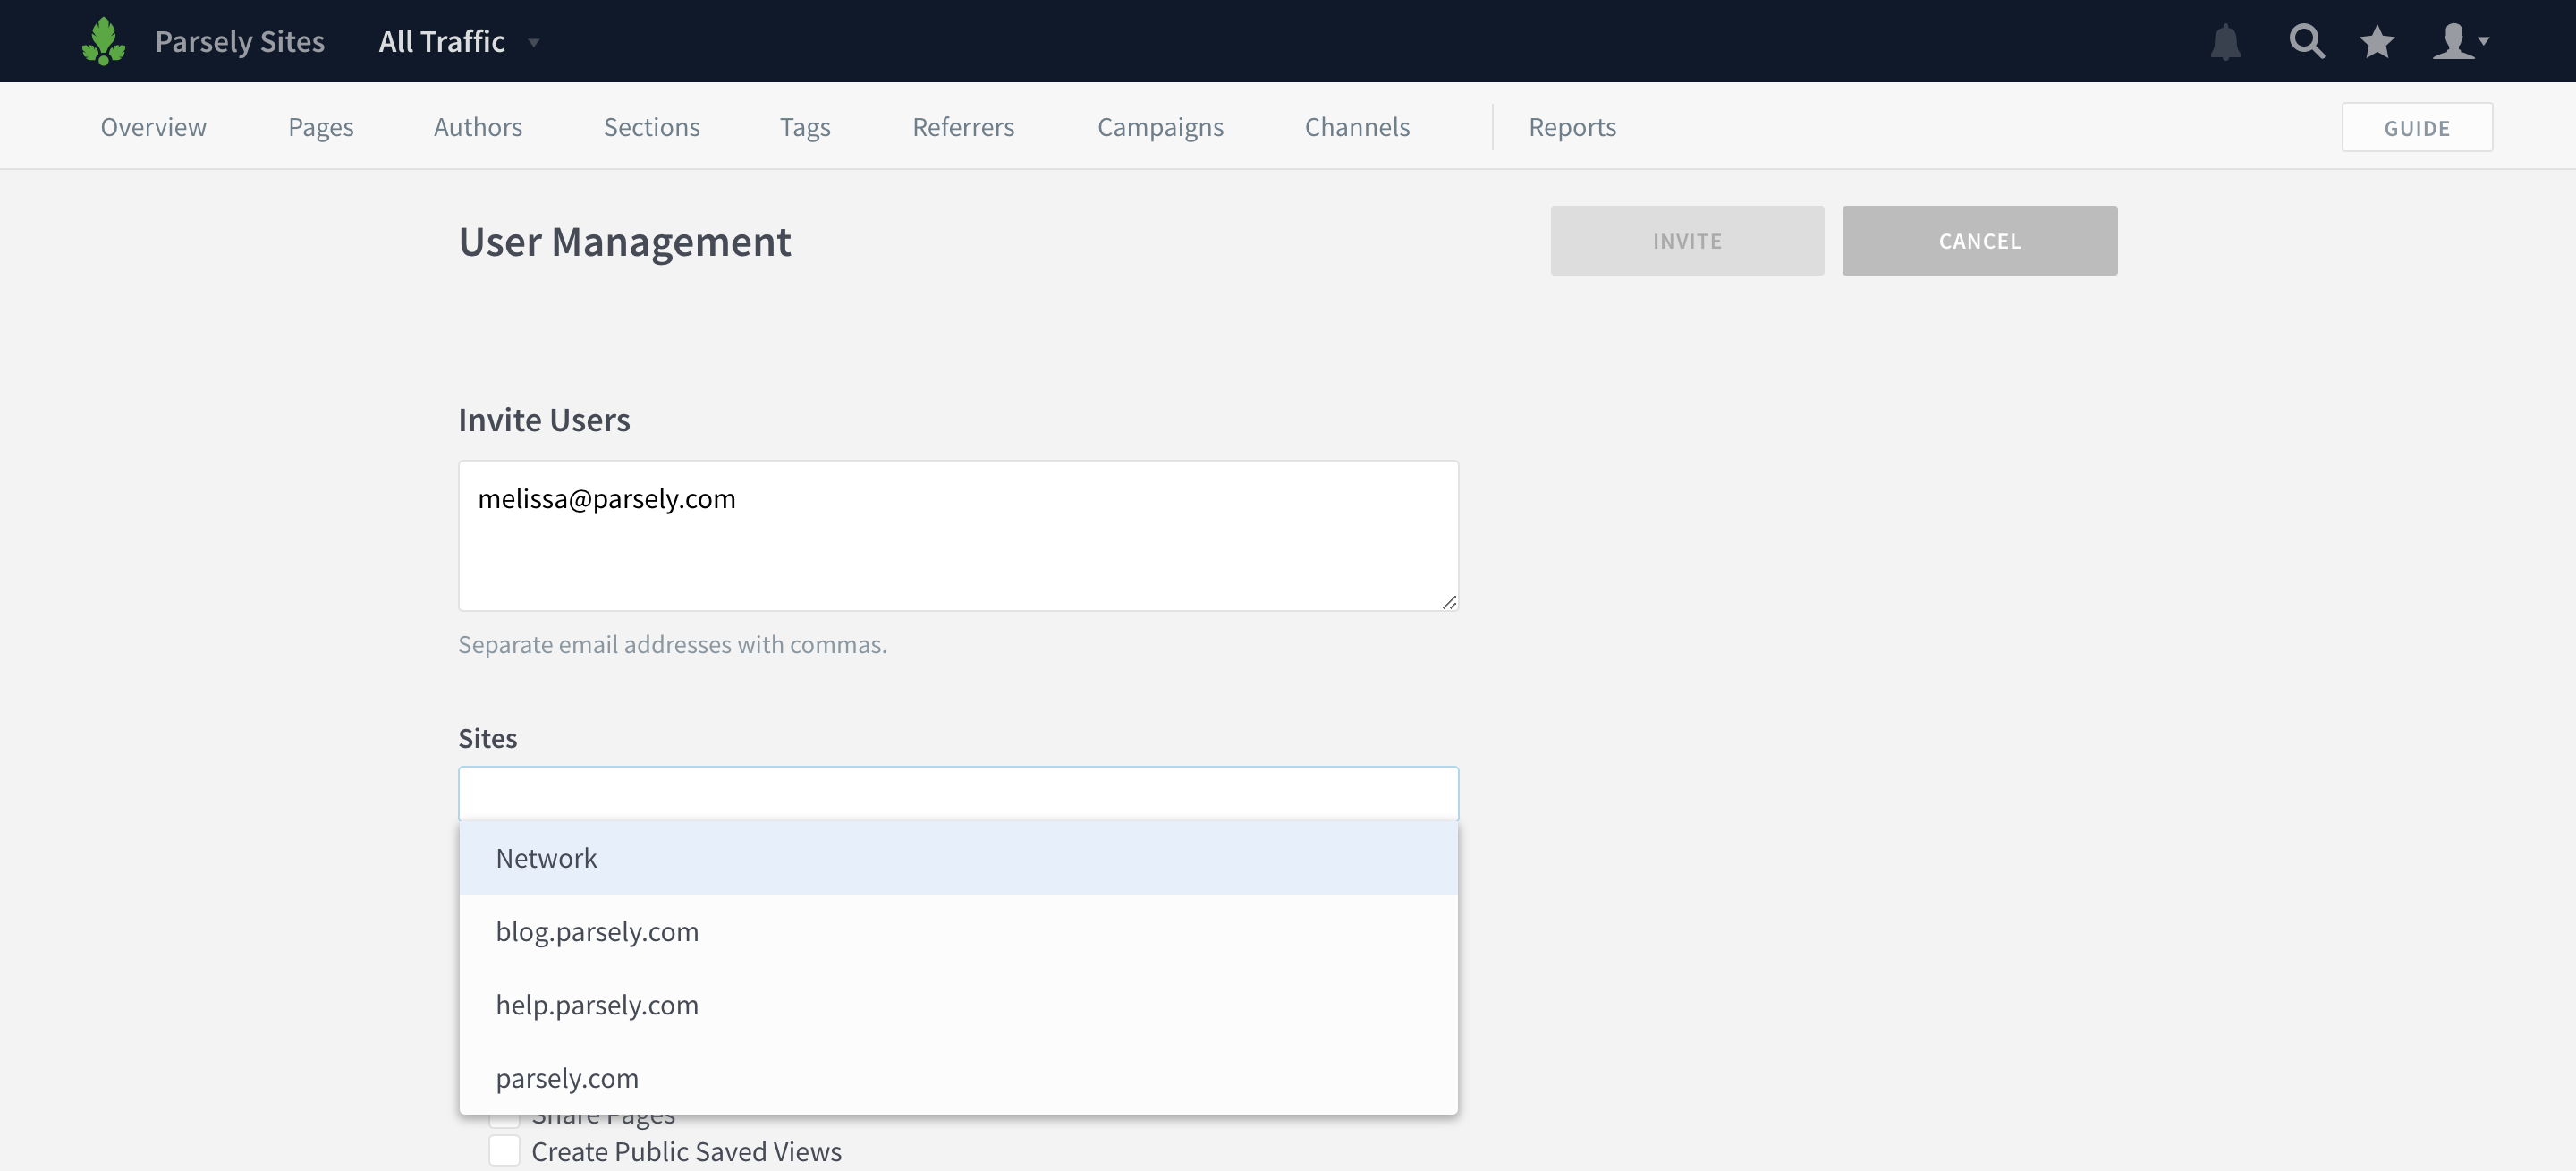
You can create multiple network users at once, and assign them specific permissions on the network-level. Click Invite when you’re finished.
September 5, 2019
Apple News analytics
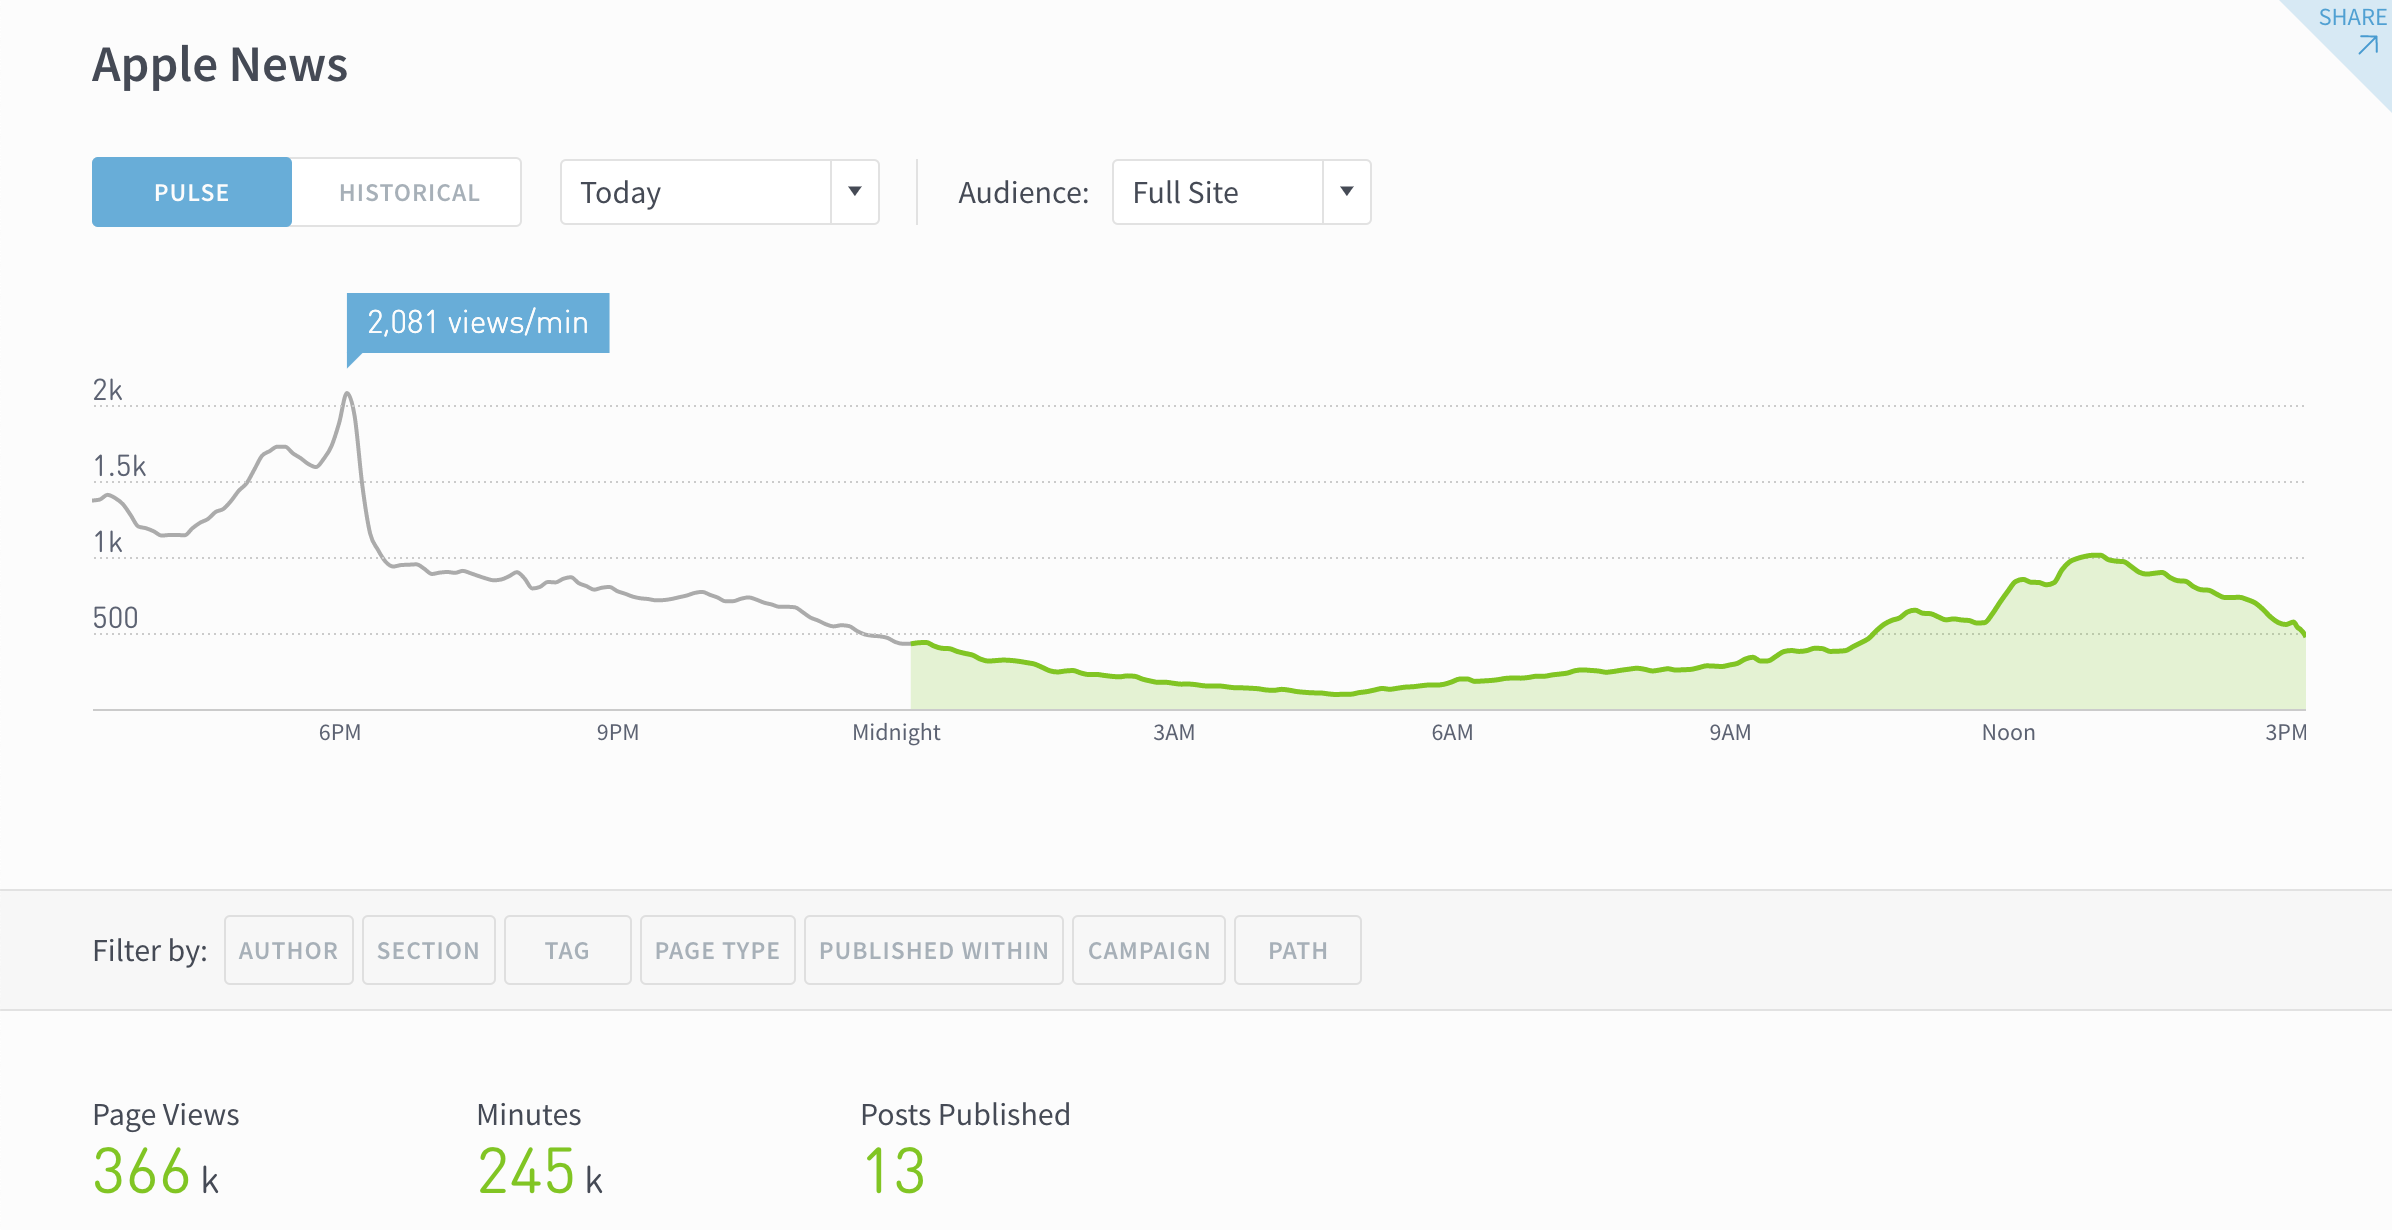
Parse.ly now supports Apple News analytics, including real-time and historical
- Page Views
- Total Engaged Minutes
- Avg. Engaged Minutes
Apple News analytics are available at an additional cost to Parse.ly Enterprise customers. Reach out to your account rep or fill out the form in this product announcement to learn more about pricing.
August 21, 2019
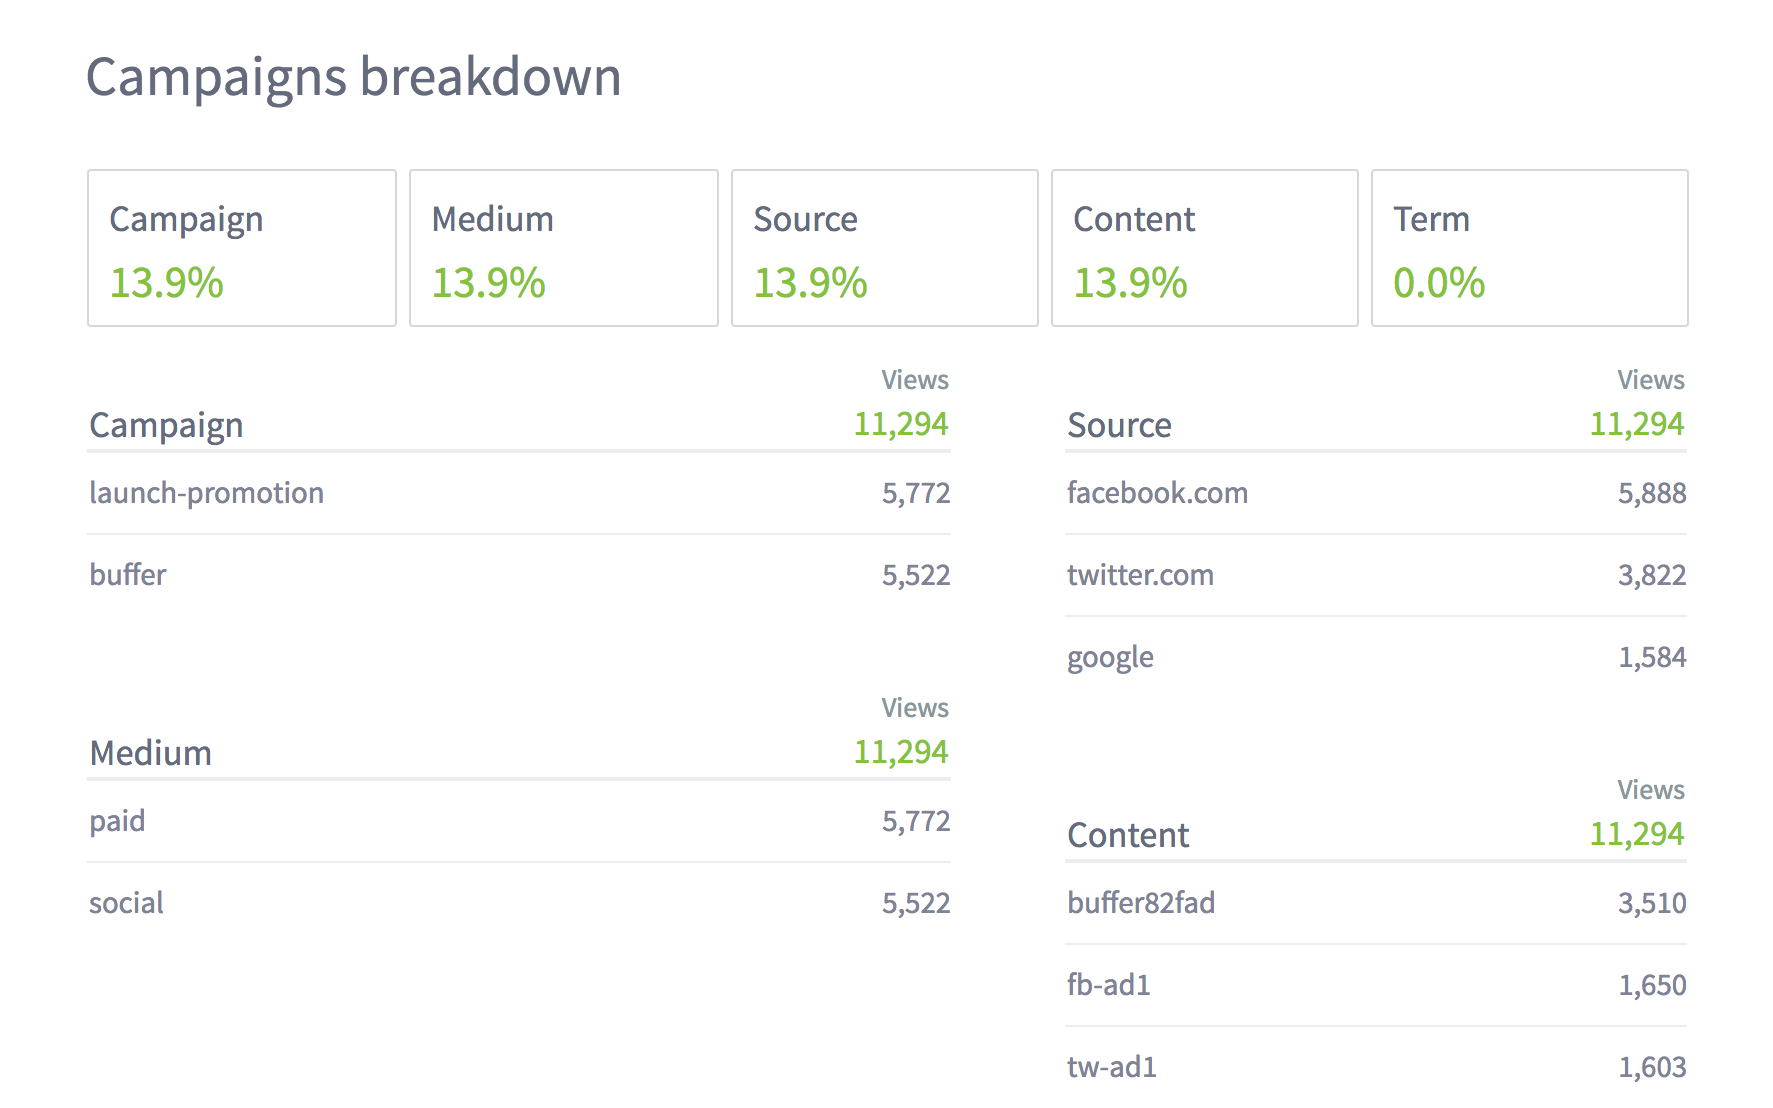
Campaign filters
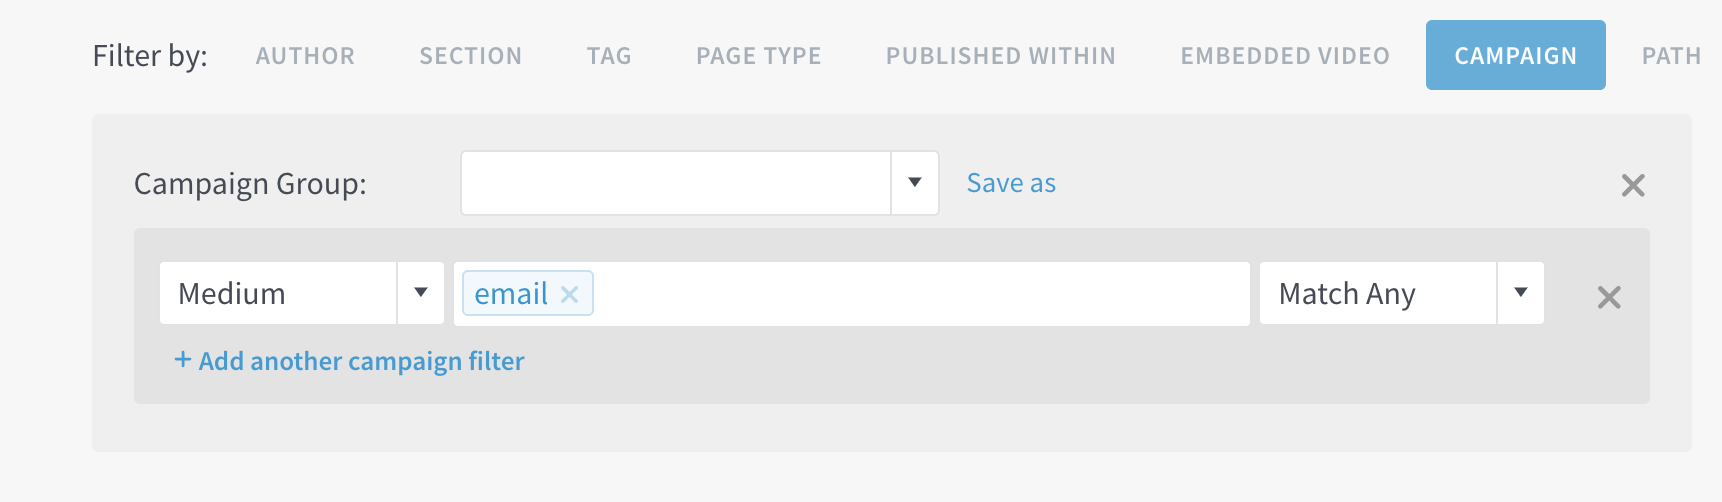
You can now filter by individual campaign parameters (e.g. campaign, medium, source etc.) on any listings page. Click “Save as” to create a new Campaign Group or update an existing one on the fly!
Here’s how to do it:
- Go to a listings page, like Posts.
- From the Filters, select Campaign.
- Click Show individual campaign fields. (Or pick an existing Campaign Group.)
- Add fields.
- If you want to save or update the group, click Save as.
- You’ll then be prompted to update or name your new Campaign Group.
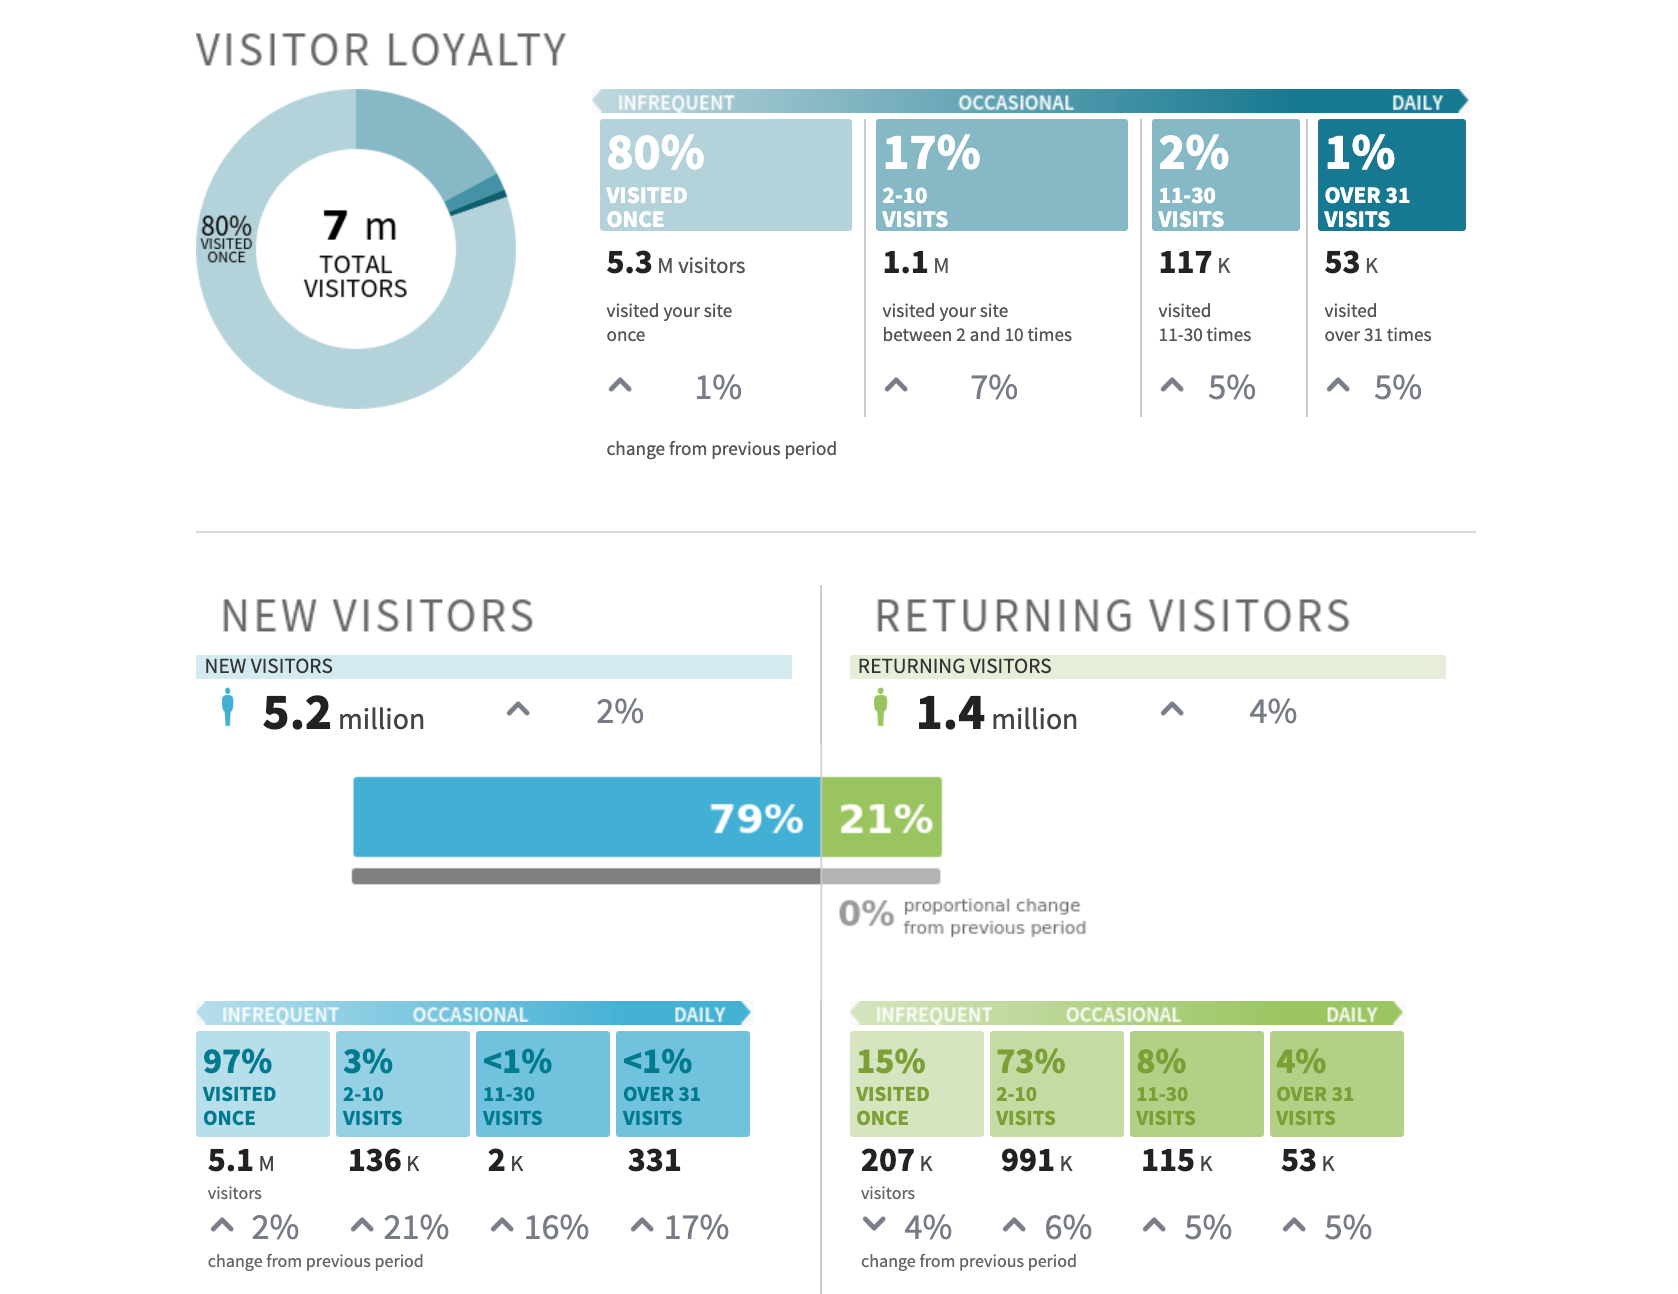
Audience Overview report
On September 4th, all Parse.ly Enterprise customers can run a report to get a better understanding of loyalty and visitor behavior for August 2019. Schedule this report to run monthly to receive it automatically in future months! (You can find it in the reporting suite under Advanced.)
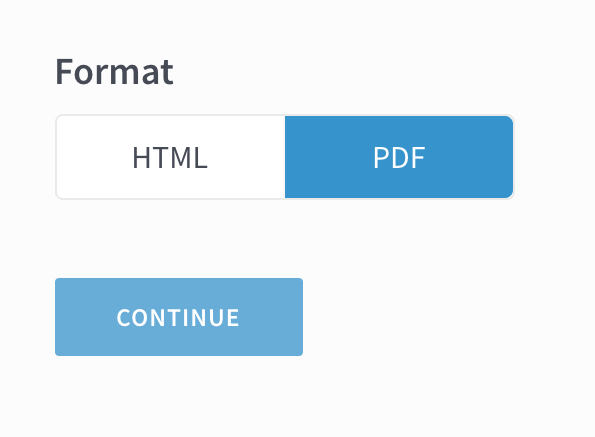
PDF reports
There’s a reason the PDF has been around since 1993. It’s easy to save, store, and forward to your colleagues. And now you can do that with your Parse.ly reports!
All you need to do is select PDF as the format when you create a report:
Export a spreadsheet of Parse.ly users

Need to get a better understanding of your organization’s Parse.ly usage? Admins can now export a list of Parse.ly users from the Users page.
- Click the account dropdown on the right.
- Click Users.
- Click Export user data.
Check your organization’s Parse.ly usage
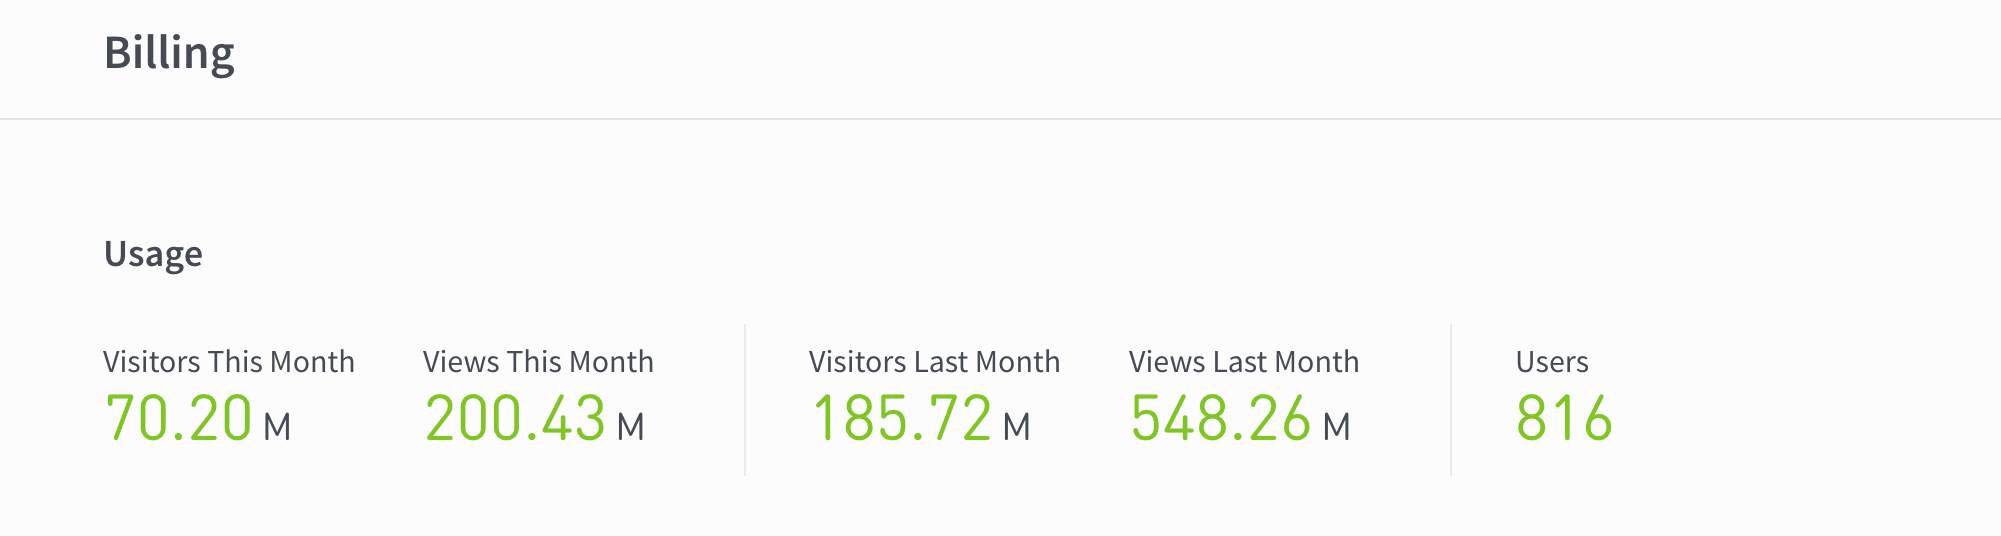
On the Billing page, admins can now see the visitors and page views for this month and the last month, as well as total users.
- Click the account dropdown on the right.
- Click Billing.
See your Parse.ly permissions and admins
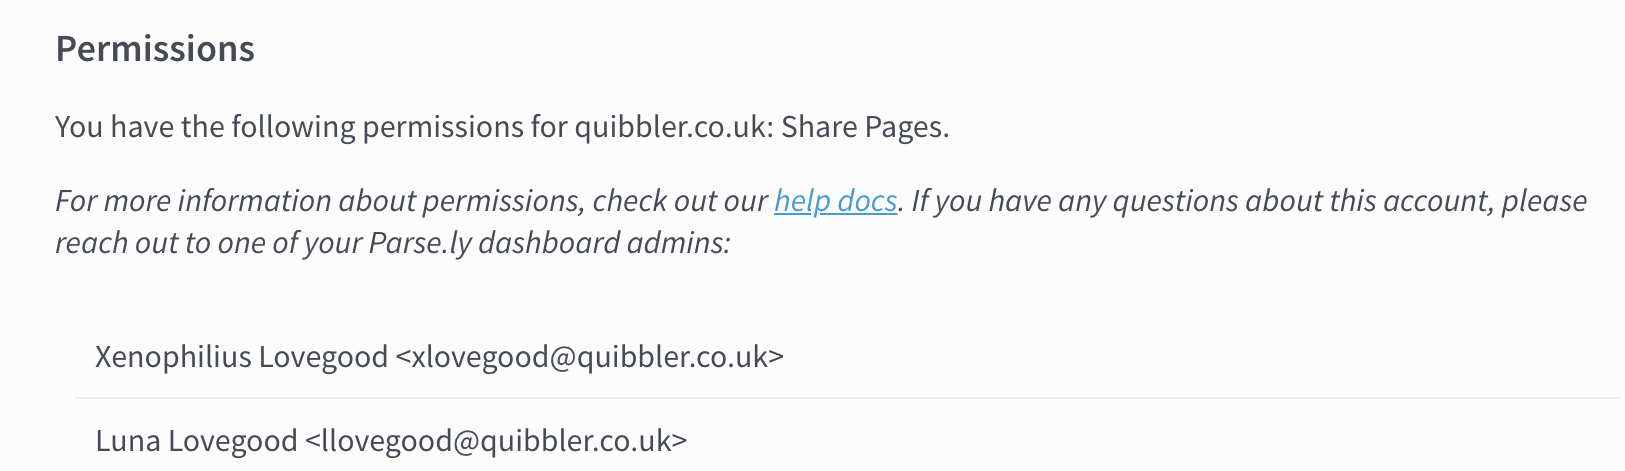
For those who have ever had a question about Parse.ly but but weren’t sure who to ask, this update is for you! Parse.ly now shows a list of your permissions and admins on the User Settings page.
- Click the account dropdown on the right.
- Click the cog next to your email address.
- From this page, you can change your password, see your permissions, and get a list of the names and email addresses of your Parse.ly admins.
LinkedIn removed from social sort metrics
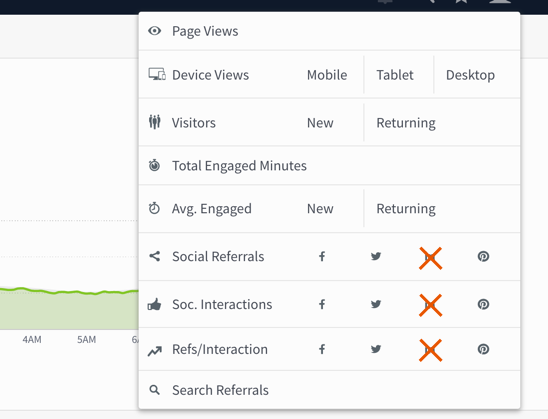
We’re removed both LinkedIn interactions and referrals from social sorting metrics because LinkedIn shut down an API providing social interaction data for all third-party tools and vendors, not just Parse.ly. We made several attempts to re-gain access to this data by working with LinkedIn’s content and news partnerships team, but we were unsuccessful. Therefore, we had no choice but to drop support for this metric from our product.
Moving forward, Parse.ly will continue to support interactions and referrals as sort metrics for Facebook, Twitter, and Pinterest.
Parse.ly will treat LinkedIn like any other referrer (such as Instagram or Reddit). You will be able to see LinkedIn referrals:
- on the Referrers tab
- on the LinkedIn referrer details page
May 21, 2019
Alerts keep you informed about notable traffic to your content. You can now choose to receive alerts on your browser, on your mobile phone, in Slack, or in email when posts receive significantly more traffic than usual.
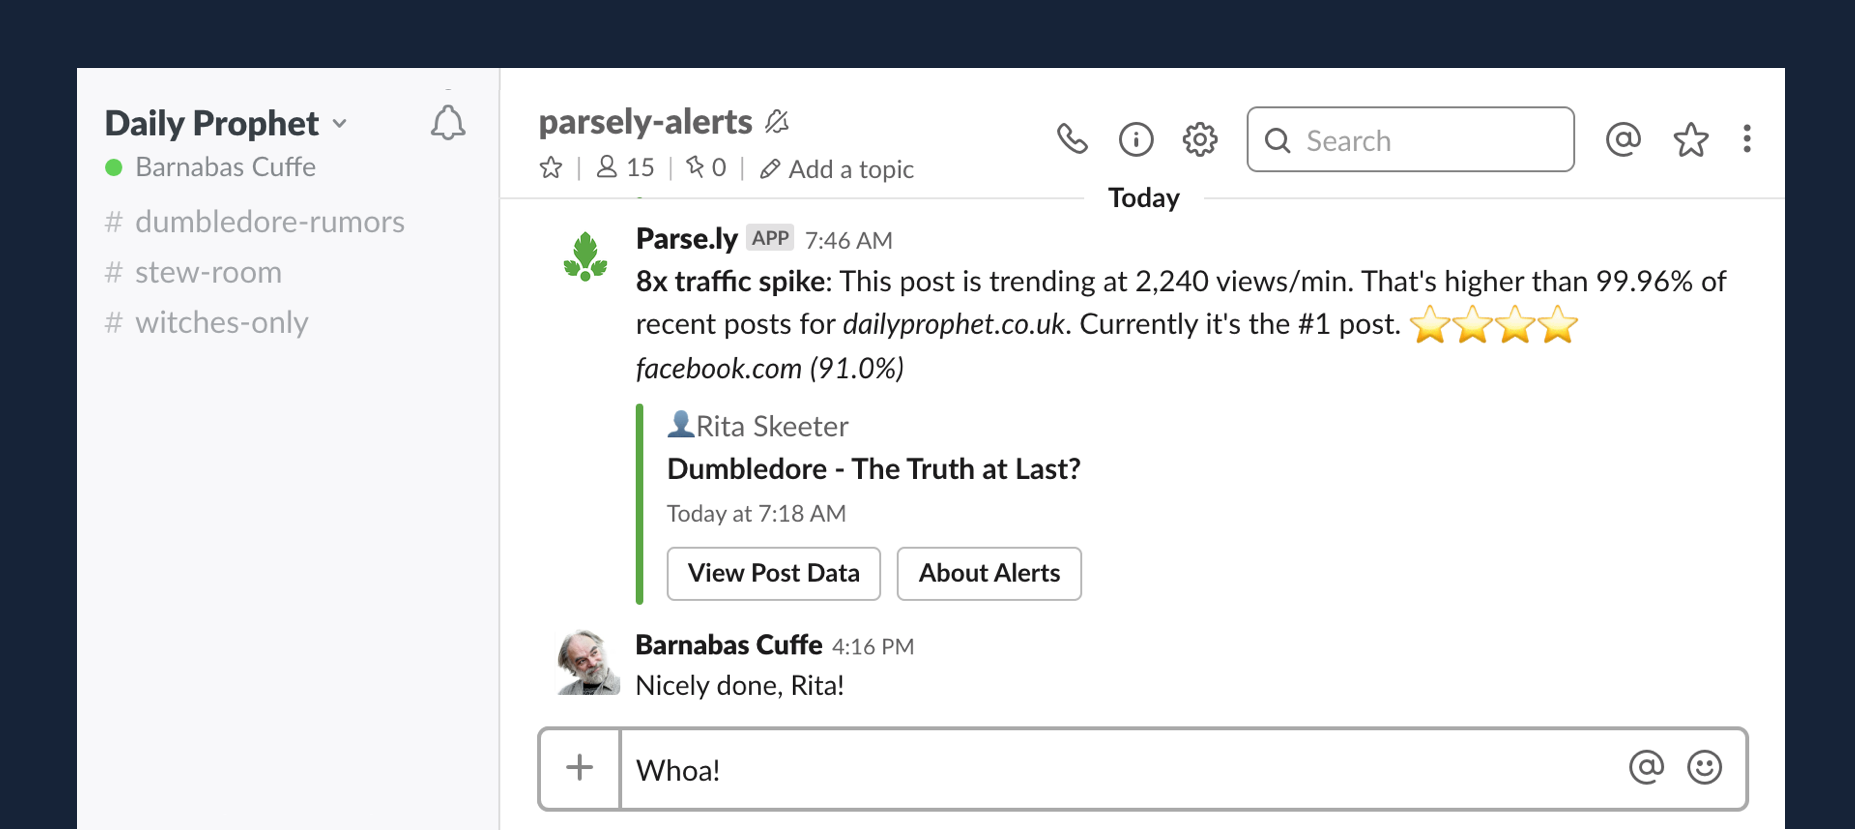
Learn how to subscribe to alerts and how alerts work:
December 13, 2018
When creating a scheduled report, you can now add a custom subject line to the report that will appear when the report arrives in your emailbox.
The new option appears at the bottom of the Parameters screen when creating or editing a report.
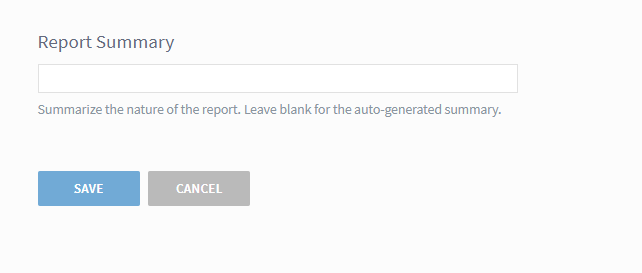
The custom title will also appear in the Recently Run and Scheduled tabs in the dashboard interface and will be the title that appears on your HTML report.
November 14, 2018
Path Fragments
Users now have the ability to use URL path fragments as a filter when viewing post or non-post data.
A path fragment refers to the parts of a URL separated by slashes. For example, in the URL https://tea-fanatics.com/flavors/black-tea/earl-grey/, the path fragments are “flavors” “black-tea” and “earl-grey”.
Two notes about fragments: 1) Data is only available since Oct. 1; 2) Your site must have a URL structure where paths are present in order for data to be available.
Path fragments are displayed like this:
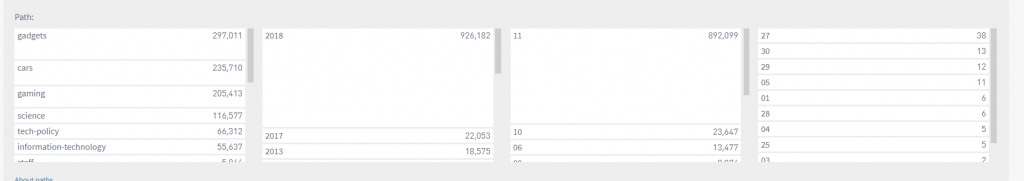
When making a selection, the list of fragments will immediately narrow to show only the lower-level fragments that appear with the selected fragment.
The height of each row shows the popularity of the fragment compared to other fragments. That is, the taller the path fragment’s box, the more page views it received (or referrer views when on a referrer detail page) relative to the other path fragments.
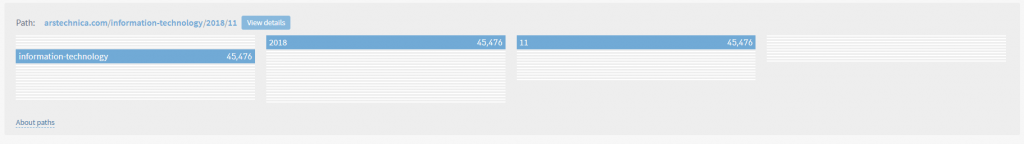
Once you have selected a path fragment, you can click on the “View Details” option to see full information about URLs matching the pattern.
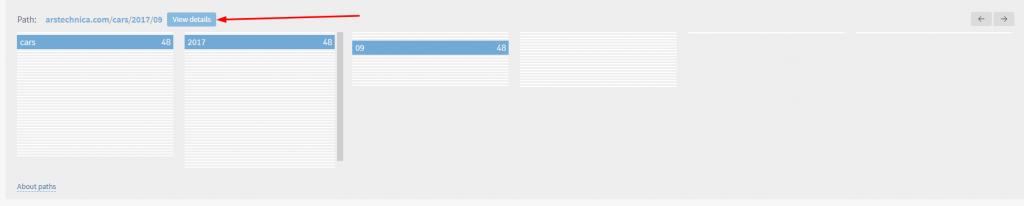
You can drill down as many levels as need be – additional levels can be added to the screen using the arrows in the upper right corner of the Paths box.
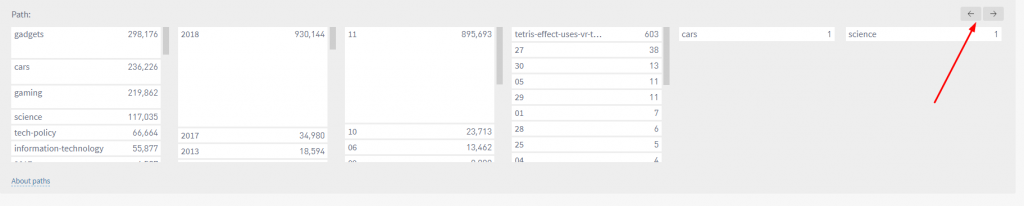
Paths are available as a filter in all sections of the dashboard as well as in the reporting suite.
September 18, 2018
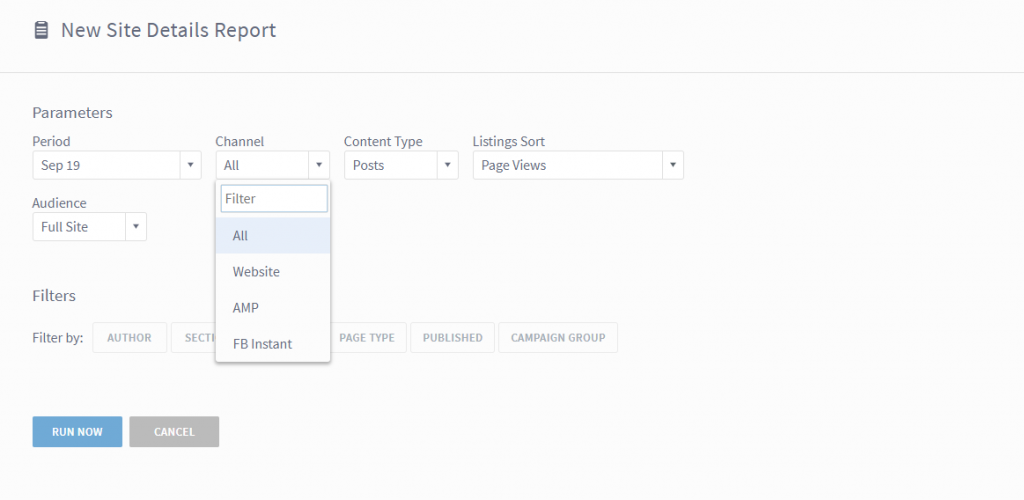
Channel Filtering in Reports
In the reporting suite, you now have the option to see data specifically for Google AMP or Facebook Instant – or specifically without both channels. September 18, 2023 Update: Facebook Instant Articles is deprecated.
In Top Listings, Details and Stats Over Time, these new options are now available, giving you increased visibility into the impact of your efforts on those platforms.
Saved Views
You now have the ability to save configured views in the dashboard, a request we’ve heard from many users and the highlight of this release.
You can now, for example, set up a combination of filters once and not have to redo those configurations each time you use the dashboard. Perhaps you want to quickly see what stories in a specific section received the most traffic from Facebook during the past week. Easy enough:
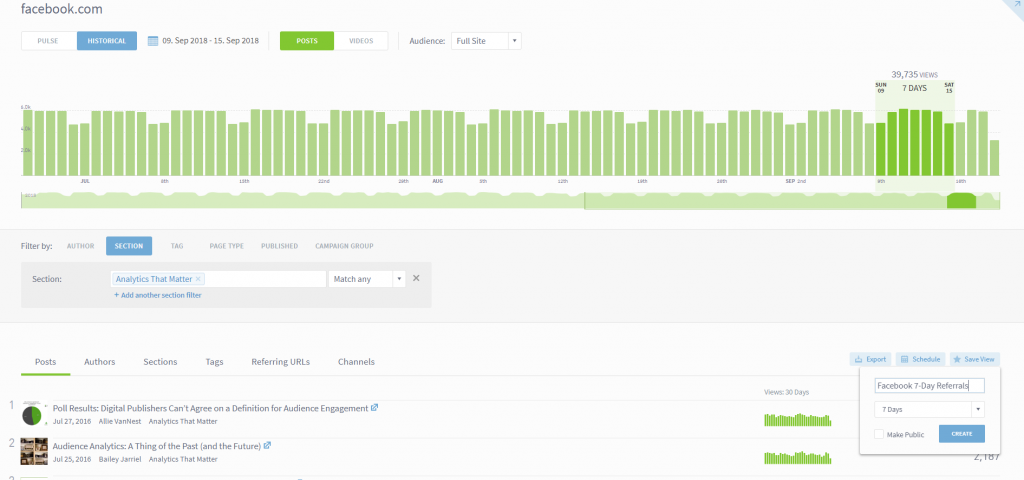
Or perhaps you want to track a specific group of authors on a single screen. Again, easy to set up and save:
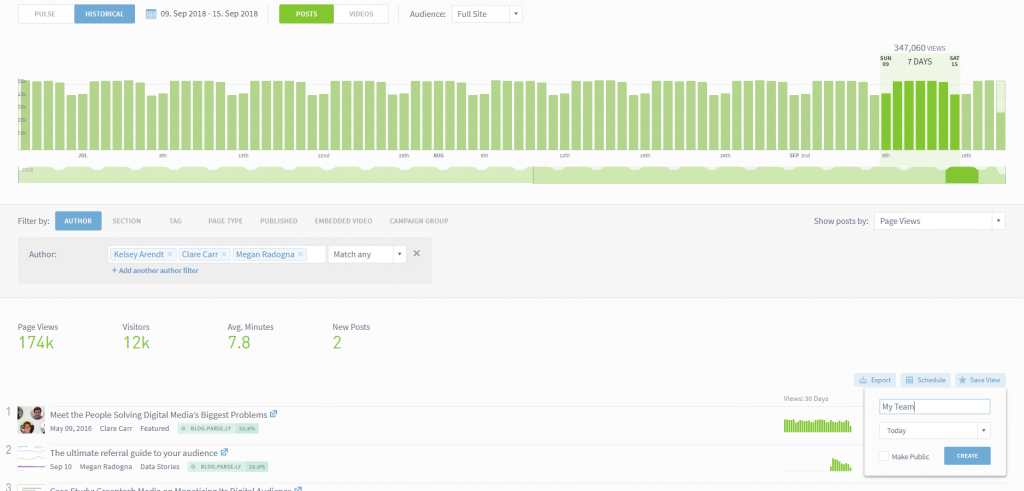
Simply save the desired view and decide whether to share it with the rest of your organization or keep it for yourself.
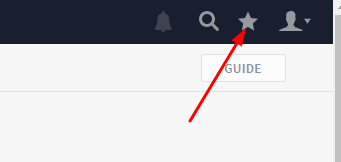
Once you save a view, you can access it by using the star in the menu in the upper right portion of the screen:
Useful Views
In the Guide tool, we’ve also added some quick clicks to popular views. Think of these as useful filters to help you easily find the information you need:
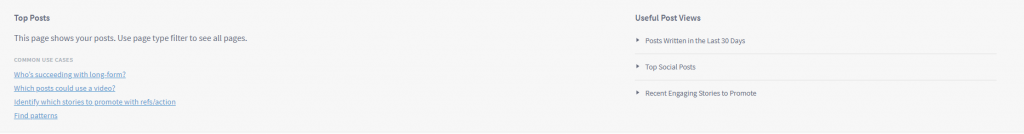
These appear in each dashboard screen where the Guide button is available.
August 7, 2018
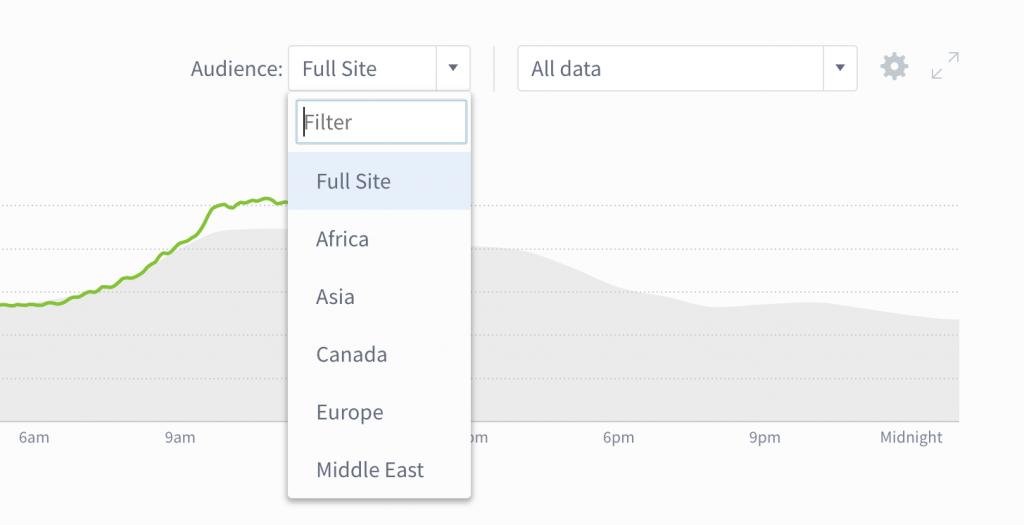
Audience Segments
Often, it’s hard to pick out the habits and interests of niche audiences from sweeping aggregate trends. With audience segments, you can understand and optimize for audience subsets like subscribers, users, regional readers, and more.
- Learn how Bloomberg Media and WSJ put audience segments to work.
- Reach out to your account manager or support@parsely.com to talk possibilities and pricing.
- Read about audience segment implementation.
July 17, 2018
This release aims to help you get more out of the reporting suite.
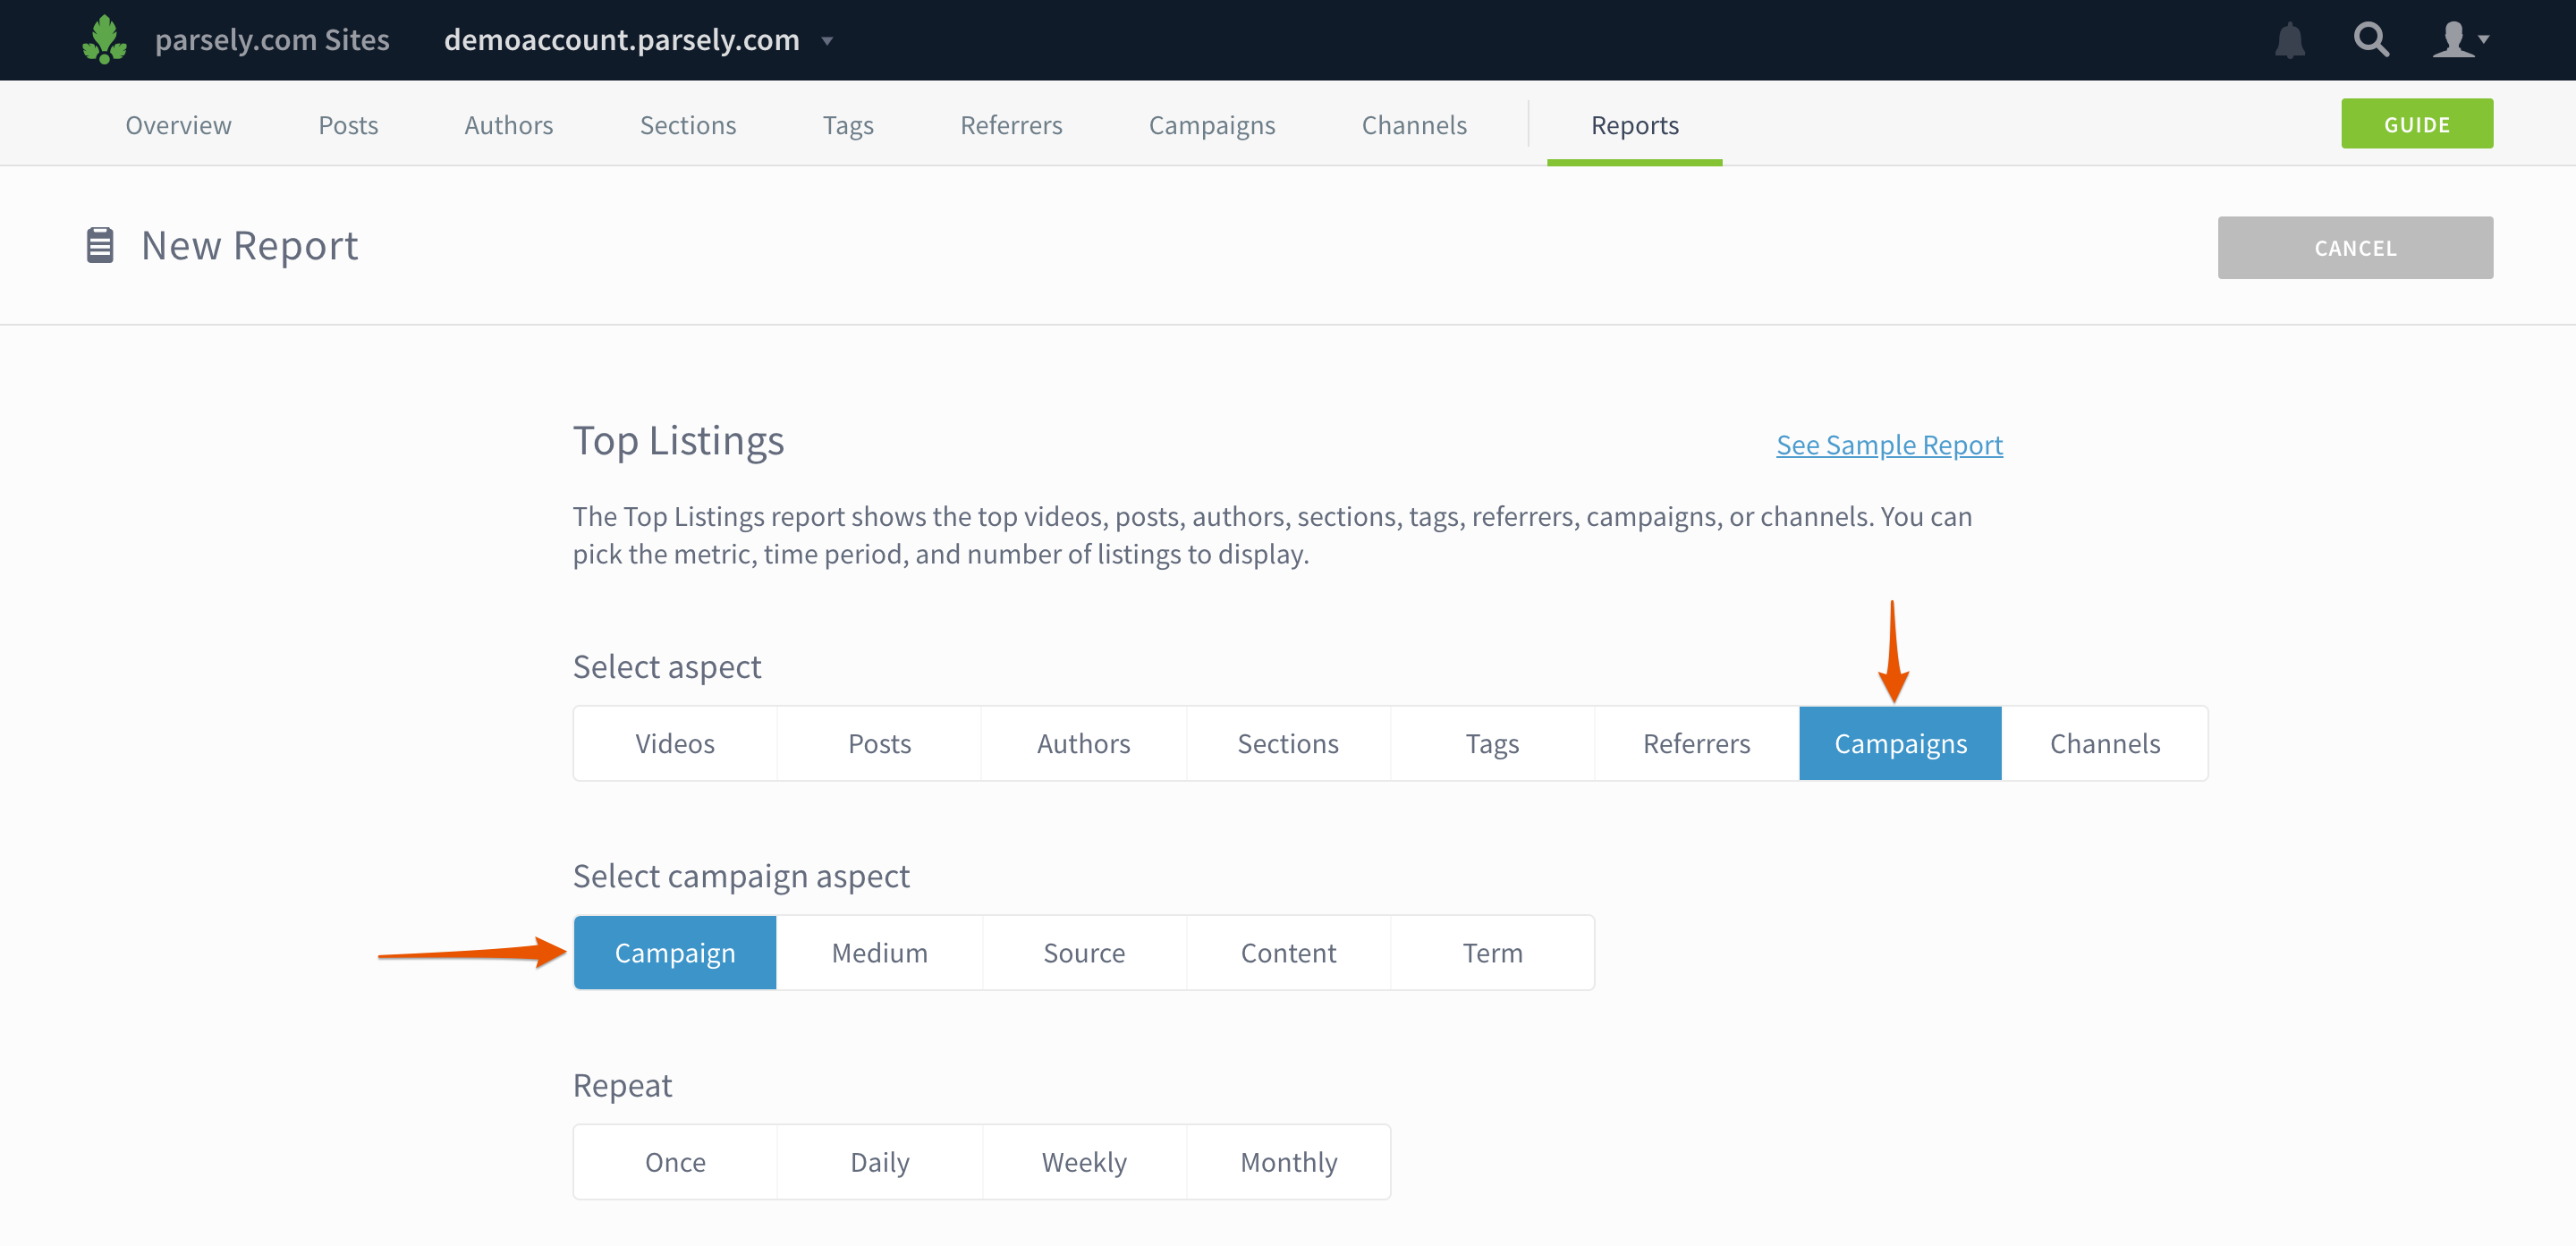
See campaign performance in Top Listings and Details reports
Get a high-level look at the top campaigns or dig into a detailed report on a specific campaign’s performance.
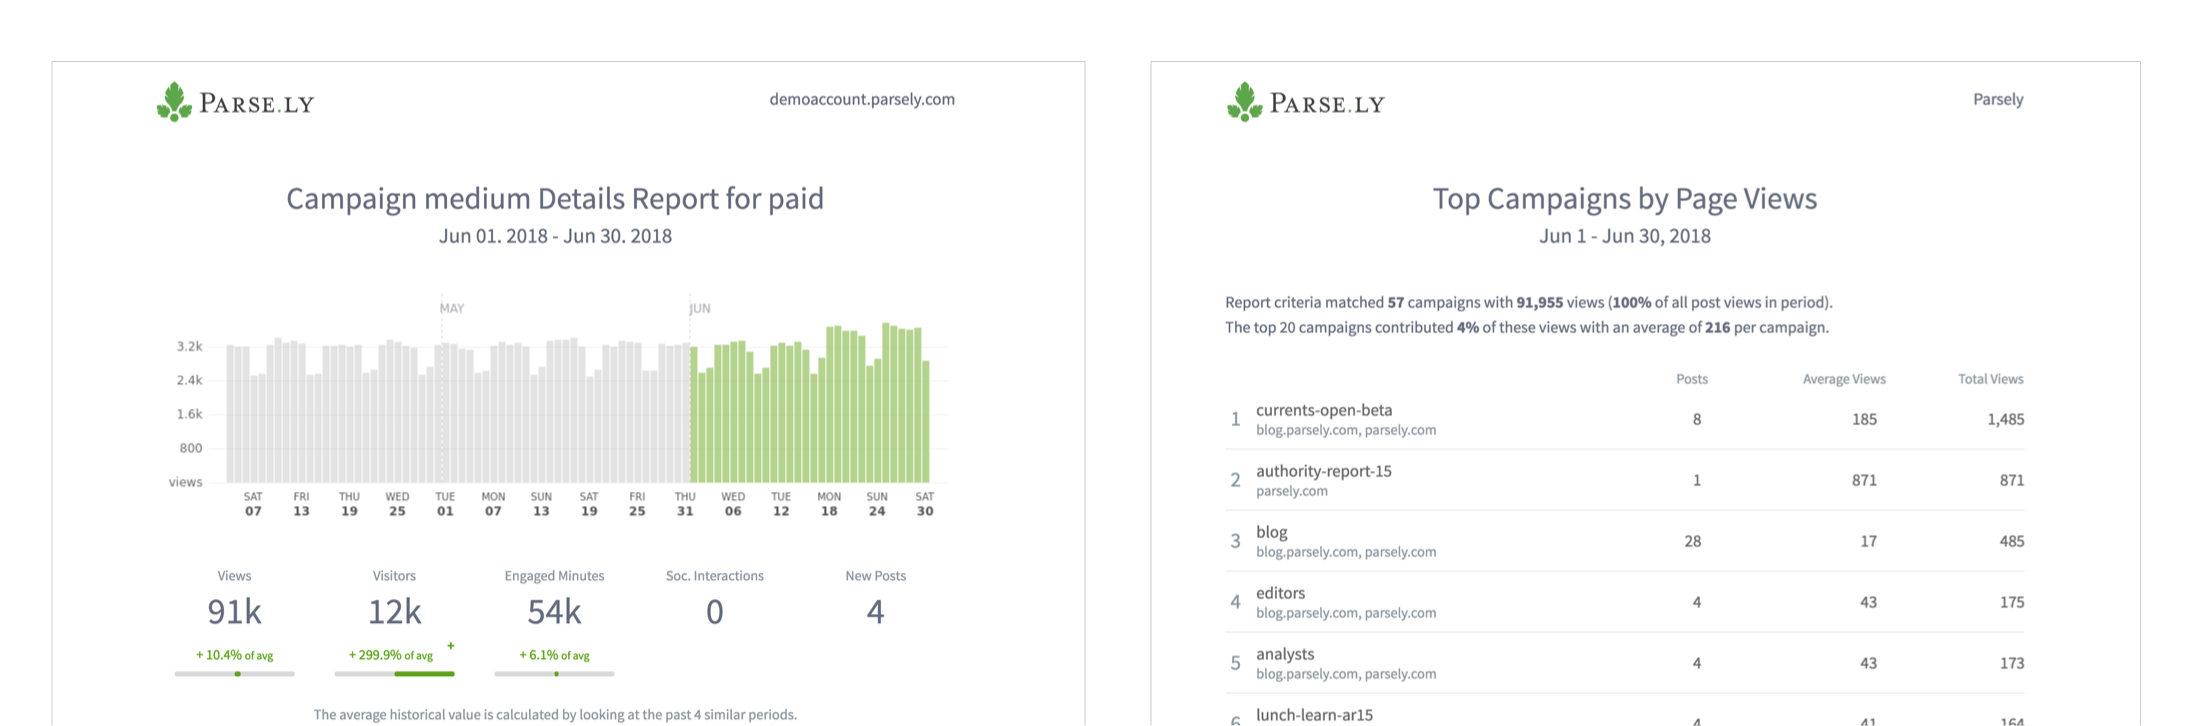
When you create a new report, you can add campaign data by selecting Campaigns and a campaign aspect. (Note: campaign data is not yet available for Stats Over Time, Evergreen Overview, or Audience Overview reports.)
Campaign data also appears in all Details reports, so you can see the top campaigns by section, author, tag, etc.
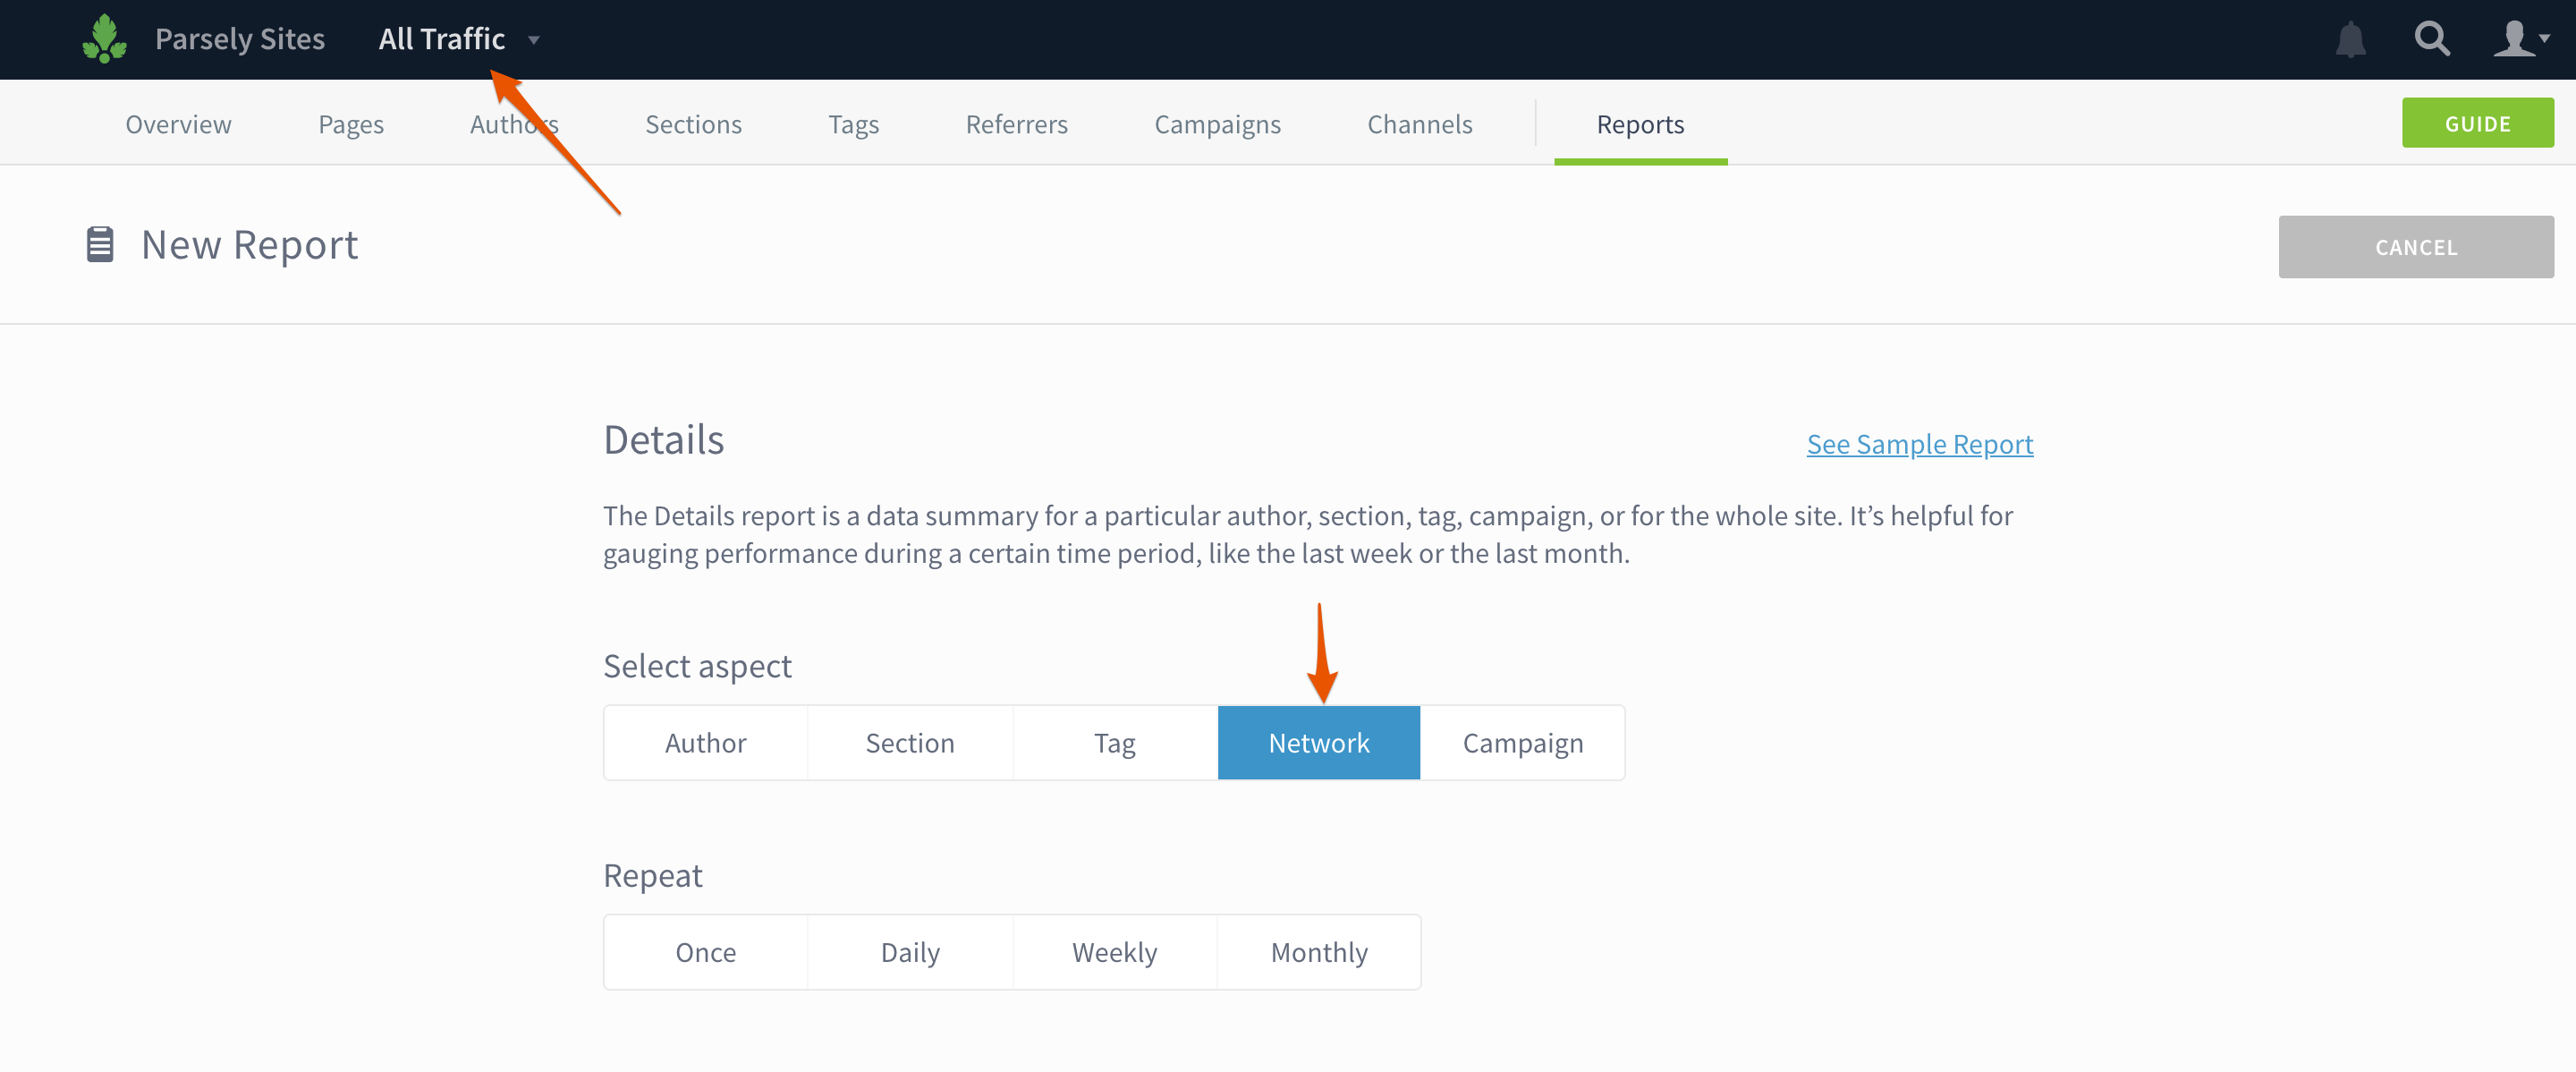
Create a Details report for your whole network or a site group
If you have Network Rollup enabled, you can see how content is performing across your entire network or a group of sites. Select All Traffic or the site group name in the drop down and then select Network or Site Group when you create a Details report.
Filter Details and Stats Over Time reports
Add filters to your reports to show the performance of certain topics in a section, specific sections for an author, etc.
Other improvements
- Stats Over Time reports and exports now contain a column showing the number of posts published in the selected interval.
- Export Top Listings directly from author, section, or tag details pages.
- Get an export or report for a network’s top sites.
- UI updates to the mobile app.
March 29, 2018
New
- Admins can choose the default time range, metric, and more in the new Preferences panel.
Improved
- Filter to see all the tags, campaigns, sections, and authors that start with a certain string of characters (Show me all campaigns that start with daily).
- Use multiple filters at once! (Show me all posts by Samwell Tarly in the Science section tagged with medieval-history).
- The Evergreen Overview report has gone granular. See the top evergreen posts by author, section, tag, campaign group, etc.
- Filter the Top Listings and Evergreen Overview reports by campaign group.
- The Top Listings Export now includes “video starts” and “engaged minutes” columns where video tracking is enabled.
- We tweaked the way we display Tweets.
- We changed the way we calculate new/returning visitors. Learn more.
December 19, 2017
New
- AMP and Facebook Instant Articles are now officially supported, with their own listings page and details pages. Get instructions for integrating Google AMP or
Facebook Instant Articleswith Parse.ly. September 18, 2023 Update: Facebook Instant Articles is deprecated. - Referrer badges appear when a large percentage of a post’s traffic is from a single referrer.
Improved
- The redesigned tweets display introduces new ways to understand Twitter engagement.
- Schedule recurring reports to track progress toward your monthly or quarterly KPIs.
- Filter Overview listings by publish date.
- Video badges now show how many visitors started watching videos on a page.
October 31, 2017
Improved
- Overview can now be customized to show the information that matters most to you, like your stories, sections, or beats.
- The header got a redesign to make things a bit less cramped.
New
- Create a campaign group to filter paid traffic or any other traffic tagged with campaign parameters.
- Network admins can now group multiple sites (by vertical, location… you name it) to see data in one place.
- We’ve added a footer that lets you send feedback and shows tips for getting more out of the Parse.ly dashboard.
July 27, 2017
Improved
Parse.ly’s on-page analytics bookmarklet now has seven metrics for evaluating slot performance, as well as referrer, visitor, and device breakdowns on each and every page.
June 5, 2017
New
- You can now gauge the impact of marketing campaigns on video engagement. The Campaigns page shows how video starts, visitors, and minutes watched vary from campaign to campaign. Video details pages also display campaign data.
May 19, 2017
Improved
- When you’re on a listings page, like top posts or top authors, you can either export up to 10,000 rows of data instantly or schedule a Top Listings report.
May 16, 2017
New
- IT experts will be happy to know that Parse.ly now supports SAML 2.0. This makes it possible for admins to connect Parse.ly to identity management services like Okta or OneLogin, set up single sign-on, and onboard and offboard users in one place.
- Admins can enforce log ins with Google Authentication or their preferred identity management service.
Improved
- Creating reports is much simpler with a clean new interface.
- Admins, rejoice! You can now change permissions and site access for multiple users, instead of trudging through one by one.
- Network admins can manage users for all sites in their publishing network and grant other users network-level access.
- Admins of more than one site can filter users by site access, permissions, and email address.
Many updates occurred before May 2017, but they aren’t recorded here. Check out these tips for using Parse.ly at your organization.
Last updated: July 12, 2024