Benchmarks
The benchmarks page allows you to:
- compare stats for an author, section, or tag against other authors, sections, or tags
- compare month-over-month or quarter-over-quarter stats for an author, section, or tag
- see how pages perform for an author, section, or tag
Navigate to the benchmarks page
To navigate to a section benchmarks page:
- Go to the section listings page.
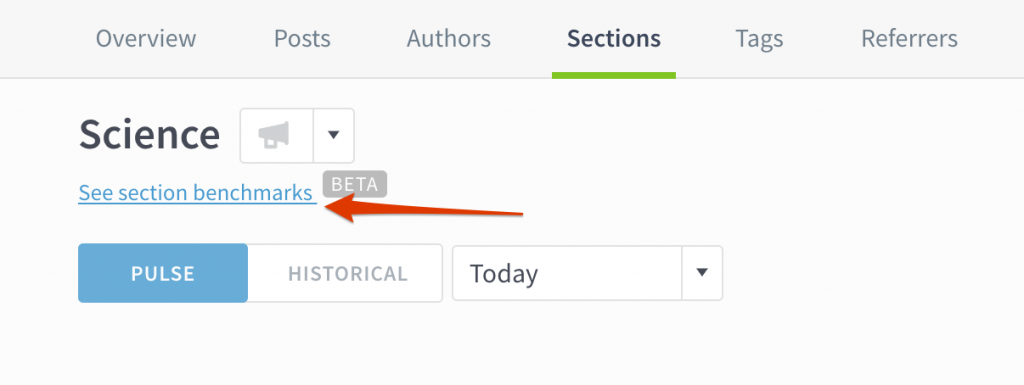
- Click on a section name to go to its details page.
- Click “See section benchmarks.”
You can follow the same flow to navigate to an author or tag benchmarks page.
Apply filters
You can slice and dice data more granularly by using filters. These filters operate similarly to other filters throughout Parse.ly. Toggle between Month and Quarter, and then choose a specific time period (e.g. April 2020, 2020 Q2).
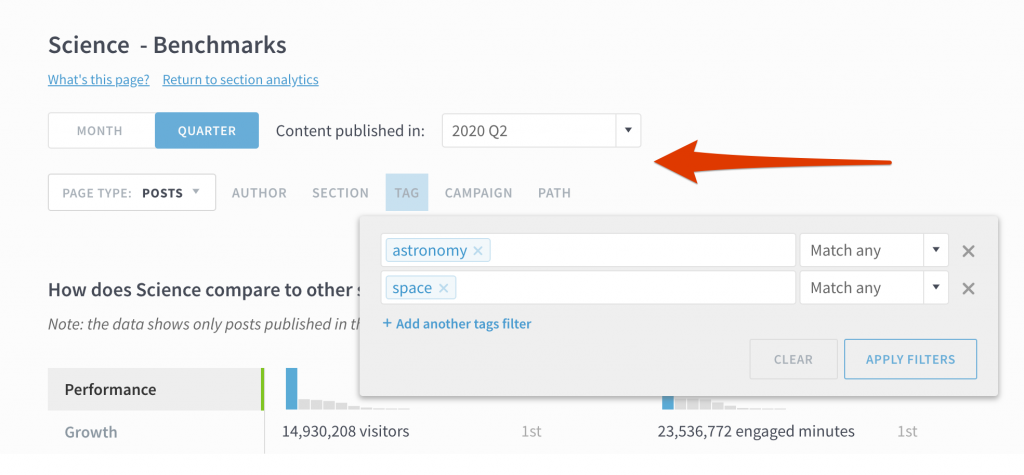
Filters apply to whole page (both the stats histograms and the bubble chart).
Note: if you apply an author filter to an author’s benchmarks, a tag filter to a tag’s benchmarks, or a section filter to section’s benchmarks, this likely won’t change the bubble chart because the bubble chart shows only content for that author, section, or tag.
For example, if you’re looking at the Science section benchmarks page and apply the section filters of Science and Economy, those two sections will appear in the histograms up top, but the bubble chart will continue to show just content from the Science section.
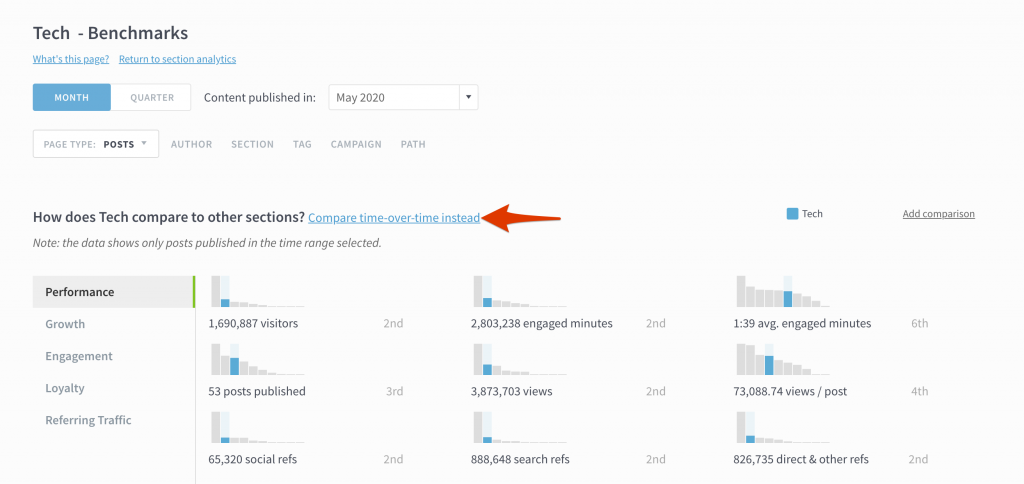
Compare stats against other authors, sections, or tags
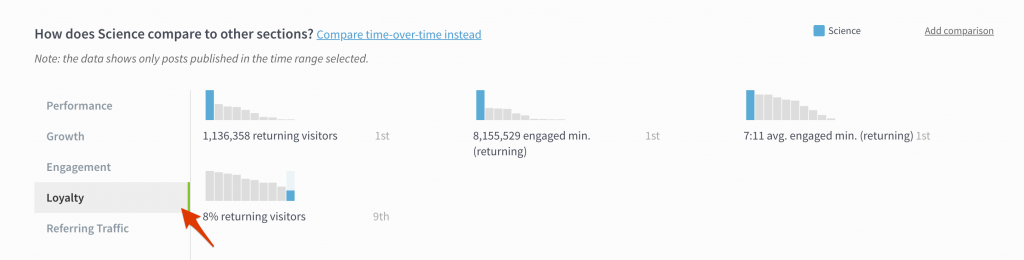
In the top part of the Benchmarks page, you can compare stats for an author to other authors, a section to other sections, or a tag to other tags.
What’s your priority? Growth? Loyalty? Better SEO? Click the the tabs on the left side to focus on the metrics that matter to you.
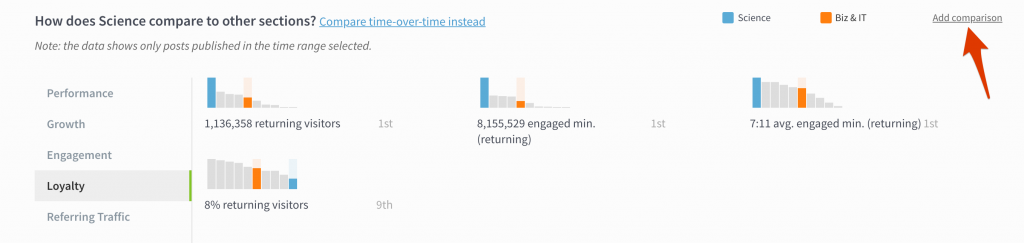
Click “Add comparison” to compare one tag, for instance, to other tags (you can compare up to seven items all together). Each selected item will show up on the charts below in a different color.
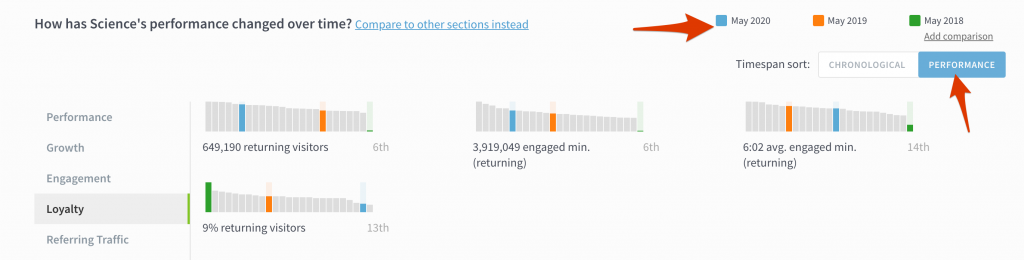
Compare time-over-time stats
Click “Compare time-over-time instead” to compare one author’s, section’s, or tag’s performance month-over-month or quarter-over-quarter.
Now, each bar in the histograms represents a time period. Click “Add comparison” to stack up your success against other time periods. To quickly pick out your biggest wins, sort the graphs by performance, instead of chronologically.
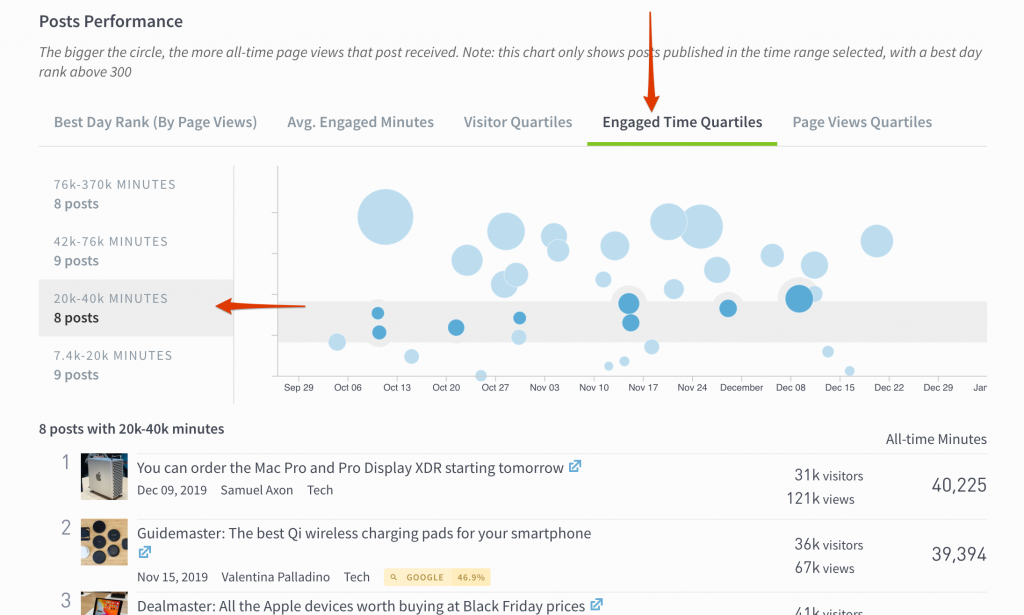
See post performance
The Posts Performance section buckets content performance for an author, section, or tag by different metrics. This lets you see what posts or pages are really working for that author, section, or tag—and what’s not.
Select a metric, like Avg. Engaged Minutes or Visitor Quartiles, and then select the lowest range to see a list of less successful content.
FAQ
- What does best day rank mean? This is the highest position a post achieved based on page views. If you’ve applied no filters, the rank shown takes into account all posts across the site. The ranking may change based on the filters you apply. For instance, a post with a best day rank of #3 across the whole site may have a best day rank of #1 in the business section.
- What do bubble sizes mean? Bigger bubbles indicate more all-time page views, and smaller bubbles indicate fewer all-time pages.
What is the cutoff for posts shown on this page? Posts will appear on this page if they were published during the time range selected (e.g. January 2020, Q4 2019) with a best day rank of 300 or above. This means that evergreen posts published outside the time range selected will not show up.
Last updated: August 15, 2024