Parse.ly Usage
The Parse.ly Usage page is available for admins to monitor adoption of Parse.ly across their team. We’ve designed this section to help you understand how often your team accessed the Parse.ly dashboard and reporting suite in the past 30 days.
Looking for your billable metrics? See our Billing guide.
Location in dashboard
- Log into your dashboard.
- Select the Site ID you want to review (this feature is not available at the Network level).
- Click on the silhouette icon 👤 to access the Account menu in the top bar.
- Select “Parse.ly Usage”.
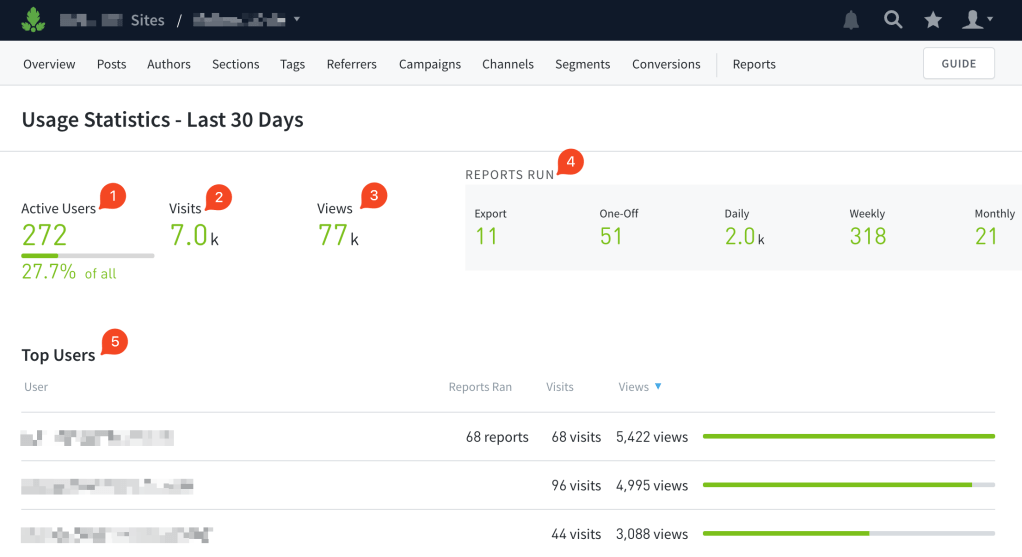
What’s displayed in Parse.ly Usage?
We provide statistics for the last 30 days of data.
- Active Users – we provide a total number as well as a percentage of active / total registered users
- Visits – the number of times the logged into Parse.ly
- Views – the number of pages they looked at while logged into Parse.ly
- Reports run
- Export – includes Top Listings and Stats Over Time exports
- One-Off
- Scheduled – Daily, Weekly, Monthly
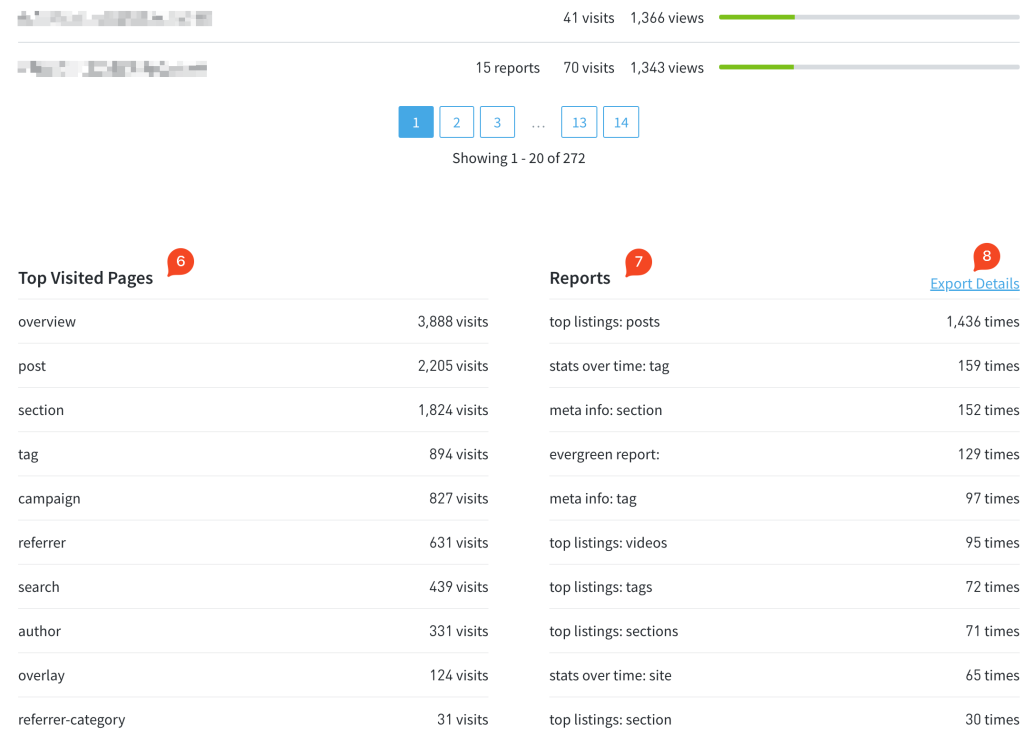
- Top Users (identified by email address)
- Reports Ran
- Visits
- Views
- Top Visited Pages, .e.g, Overview, Posts/Pages, Authors, etc.
- Reports
- Export Details link: provides xlsx file with columns: User, Date, Summary, Report, Aspect, and Schedule.
Last updated: June 05, 2025