Metrics Overview
The Parse.ly Dashboard provides support for a bevy of metrics beyond the world’s most popular analytics metric, the venerable page view.

These metrics update both in real-time through minute-by-minute, live-updating screens and over time, as a historical record, rolled up and summarized by day. We’ll run through each one in this post, with suggestions on when to use each.
Conversions
A conversion occurs when a desired action has been taken, such as making a purchase, signing up for a newsletter, or downloading an ebook. Conversions is a key metric for bottom-of-funnel content performance because the ultimate goal of your content should be to drive visitors toward revenue-related actions. Your site should have a customer-journey strategy to direct users toward conversion.
There’s a wide range of conversion events you can track within your site content, along with a variety of attribution models you can use measure success. Here’s more on how Parse.ly tracks conversions, what types of events you can track, and how our attribution models work.
Page Views, Device Views
Measured by our Javascript pixel firing on your site, this metric shows the volume of pages viewed by visitors. It’s the analytics metric that’s been around the longest; see a short history of the page view. You’re likely already familiar with it.
Unfortunately, people have learned to distort or “game” this metric, from clickbait and galleries to bots. Savvy content providers have also realized that page views, gamed or not, don’t tell the whole story about a piece. We show page views as a measure of volume, but we always show them alongside the context of other metrics.
Three built-in segments also use page views: views by mobile, tablet, or desktop. Here’s an example of how the dashboard can adjust to center on mobile views.

Uses:
- Best for campaigns, content, or roles where broad awareness and total reach is a main goal
- Evaluating the marketing or distribution of a page or link. Large number of page views indicate that the link reached a huge amount of people and that it got them to click, the first step in getting awareness.
- Understanding differences between your mobile and desktop audiences
Pitfalls:
- Potential for “gaming” with paid boosts, bot traffic, or on-site use cases like slideshows.
- Doesn’t show much nuance on its own, best when used in combination with other metrics
Visitors
Moving beyond page views, measuring by visitors looks at unique individuals who come to your site. The easiest way to think about the difference between these two metrics is that a single visitor could visit three pages, meaning you would have one visitor but three page views. The ratio of visitors to page views indicates how many pages people typically look at.
We distinguish visitors between two groups: new visitors and returning visitors. We separate these groups by checking to see if the visitor has visited your site in the previous 30 days (on the same device and without clearing cookies). If they have, they qualify as “returning,” if not, they are “new.”
Uses:
- Similar to page views, total visitors still focuses on volume and reach. However, it can normalize comparing a post or section that may intentionally drive up page views, for example, comparing a slideshow post to a single page text-based post.
- If you are trying to reach a new audience, launching a new initiative, or trying to grow your audience, measuring by New Visitors will give a good indication of your success.
- If you want to build audience habits, increase loyalty of an audience or customers, making Returning Visitors your KPI can help ensure you’re focusing on what’s working for that segment.
Pitfalls:
- If you are only looking at anonymous visitors (which most sites will be), we rely on first-party cookies using the user’s browser and some estimations to provide this value in real-time. Certain things affect the accuracy of this metric, including: if you do not use cookies on your site, if visitors do not accept cookies through their browser, and if someone reads your content on multiple devices or browsers.
- “The hotel problem” is a universal web analytics problem we’ve explained here. Because of this, you cannot export visitor information and aggregate it outside the Parse.ly dashboard. If you need to process visitor information differently, we recommend using Data Pipeline.
Engaged Minutes
Alright, so, Parse.ly knows about your visitors and your views. How about the time they spend with your content?
The Engaged Minutes metrics answer this question. Unlike page views, which come from a single JavaScript event, we measure this metric via a “JavaScript Heartbeat.” How does that work?
The Parse.ly tracker determines which of your users are currently engaged with your content, and for every individual visitor who is, we produce a “heartbeat” telling Parse.ly’s systems that the user is still engaged. This not only makes it possible to track precise time spent, but properly attributes time spent for richer forms of content, such as video, long form, and interactive. (See how this differs from Google Analytics’ “Time on Site” metric.)
“When we chose total engaged minutes, we had made a decision as a company that we wanted a driving metric that would help emphasize the loyal audience.” Julia Turner, former EIC, Slate
Uses:
- As a measure of “satisfaction” with content, especially for pieces meant to hold reader attention, like long-form writing or in-depth guides.
- You may use total engaged time as an equalizer across different types of content. Compare short pieces, meant to reach more people, more fairly with longer pieces meant for smaller audiences.
- Used in context with visitor count, pages with high engaged time but low visitors can be good candidates for additional distribution and promotion
- Can be a very effective measurement for certain content tagging strategies, including word count or content type.
Pitfalls:
- For certain pages, a long engaged time could indicate some sort of user confusion.
- Understanding what a “good” average engaged time for a piece can take time and effort from your team to determine and then to socialize.
Social Media Metrics
For anyone focused on social media engagement, these social media metrics will be your go-to within the Parse.ly dashboard.
Social Referrals
First, social referrals (aka “social refs”) shows how much traffic, measured in page views, came to your site from social media platforms, which we define as Facebook, Twitter, Pinterest, and other social networks. If at least part of your goal for social media is to direct people back to your site and content, get acquainted with this metric. You can also look at each referral on its own, for example, you can view which individual threads drove clicks from Reddit.
Social Interactions
Next up: social interactions. This captures all off-site engagement on the social networks for a select group of social networks that Parse.ly officially supports through API integrations with that platform. These include Facebook and Pinterest.
You can see interactions in total, or broken down by platform (Facebook or Pinterest). Facebook interactions include: shares, comments, and likes. Pinterest interactions include saves (pins) and comments.
Since we derive these metrics from API connections to these platforms, they are a powerful signal of organic off-site sharing of your content. Monitor posts (or sections, or tags) for their interactions throughout the day, and even if those interactions are not driving much traffic yet, they will be a strong signal that your content resonated with a socially-active audience.

Social metrics in the Parse.ly dashboard.
Refs/Interaction
Finally, “refs/interaction” is a ratio metric that allows you to contextualize how these two metrics (social refs and social interactions) relate to one another. For example, in the image, we see posts by Facebook interactions. These posts had 64 interactions (that is: 64 shares, comments, or likes) which drove 226 page views back to our site (226 social refs), with a ratio of about 3.5 referral views per interaction (that is: 3.5 refs/interaction).
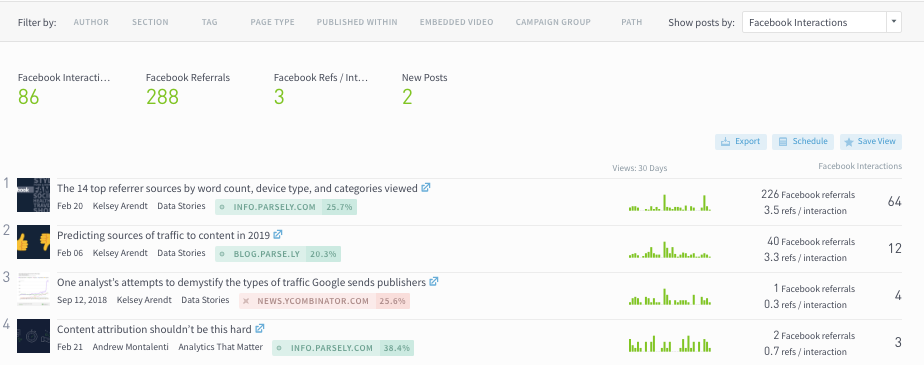
A post with this ratio of 3.5 refs per interaction could be viewed as being quite “Facebook optimized”, as it means that for every organic share it gets on Facebook, it gets over 3 clicks back to your site. If over one-third of those who see this post from Facebook share it, this post would likely grow in traffic on Facebook rapidly.
This information can help with choosing which content a team might promote in limited Facebook page posting slots, or whether to cross-promote the post in other platforms that behave similarly to Facebook (e.g. Twitter or Reddit).
Search Metrics: Search Referrals
Need to know which of your writers brings the most search traffic? Maybe they can teach the rest of your team a trick or two. Sorting by search referrals should be key to any content driven SEO strategy.
Uses:
- Want to make the most of existing content? Find pages that are already driving some Google traffic and make updates to them. Make sure each of them points to updated links and has relevant call to actions or related content.
- Already have a strong SEO program? Keeping an eye on search referrals can indicate if any posts are dropping, indicating you need to update keywords or information in that post.
- Share stats and information with teams that run paid programs to increase ROI and click-through-rates on search ads.
Recirculation Rate
Recirculation rate is the percent of page views on your site that went to another internal page of your site. We are doing some math on your behalf, calculating the percentage of views that went to another internal page of the site from a particular page or post. The formula is:
(Referred Next Views / Total Page Views ) * 100
Read more about Recirculation Rate.
Post Count
Want to know which author has written the most in the past week, month, or year? Or how many articles have been read in a certain section of your site? What about the number that have a specific tag you need to evaluate?
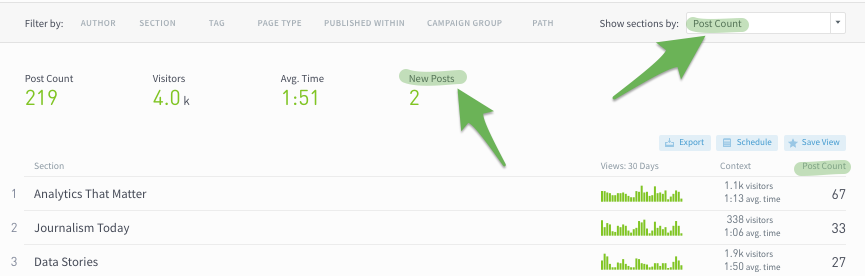
Post Count in the Parse.ly dashboard
You can see the total post count for every “post” read in the selected timeframe and filter. We’ll also let you know how many of those posts were published during that time frame as “New Posts.”
Metrics “Post Count” and “Page Views Per Post” are available on the Authors, Sections, and Tags pages.
Video Metrics
We offer the following these video-specific metrics:
- Video Starts – The number of instances that a video is started. A new video start will be collected if a visitor watches a video to the end and restarts it. Pausing, resuming or scrubbing a video does not trigger additional video starts.
- Visitors – The number of visitors that started a video.
- Total Minutes Watched – The total minutes of watch time across all visitors.
- Average Watch Time – The average minutes of watch time per visitor.

Last updated: June 05, 2025