Dashboard Overview
Overview is the first page you’ll see when you log in to the Parse.ly dashboard. Overview shows a snapshot of what your audience is paying attention to today, so you can make fast decisions about what content to produce or distribute.
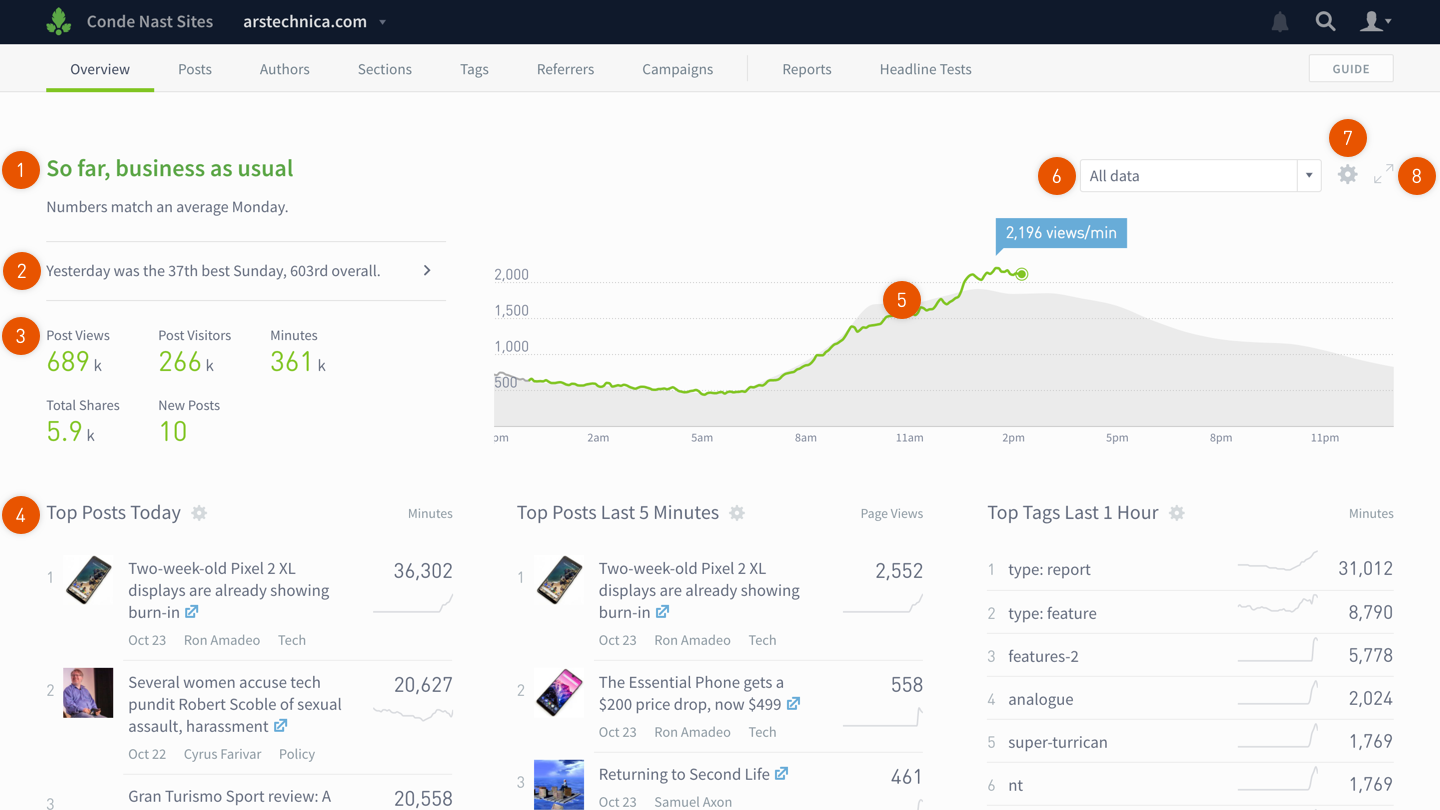
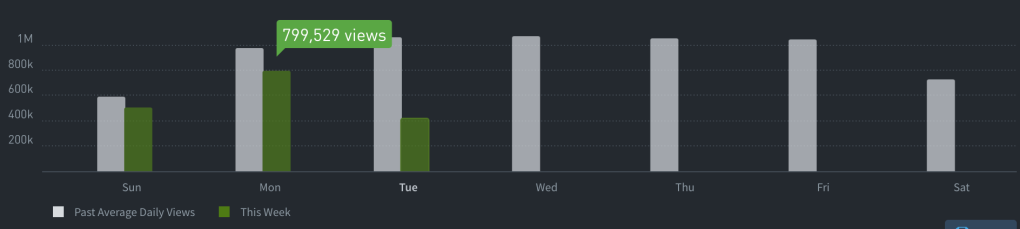
- The Parse.ly Headline: how today compares to the same weekdays of the last eight weeks.
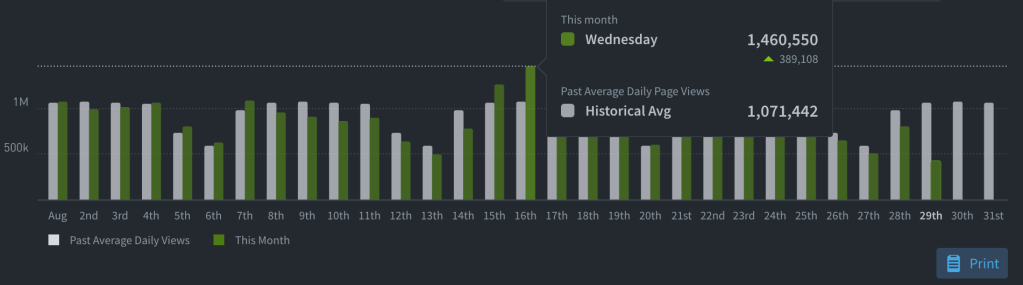
- How yesterday compares to past days (since you started tracking data in Parse.ly). Clicking the arrow will show yesterday’s stats and top posts.
- Today’s overall stats. Adjust the metrics and time range in the settings panel.
- Listings show what’s getting your audience’s attention. You may change each listing appearance in the settings panel.
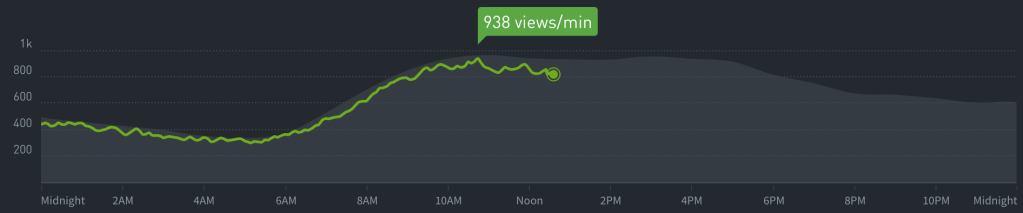
- The real-time graph shows page views per minute. You can see how today (green) compares to the eight-week average (gray).
- This filter applies to Overview. “All data” means you’re seeing all traffic for your site, network, or site group. You can make up to five custom filters.
- Click any of the cogs to open the settings panel and customize your view.
- Click the expander icon to open a full-screen version of Overview and display it on TV or monitor.
Filters
You can filter the Dashboard Overview by a particular author, section, or tag.
Create a filter
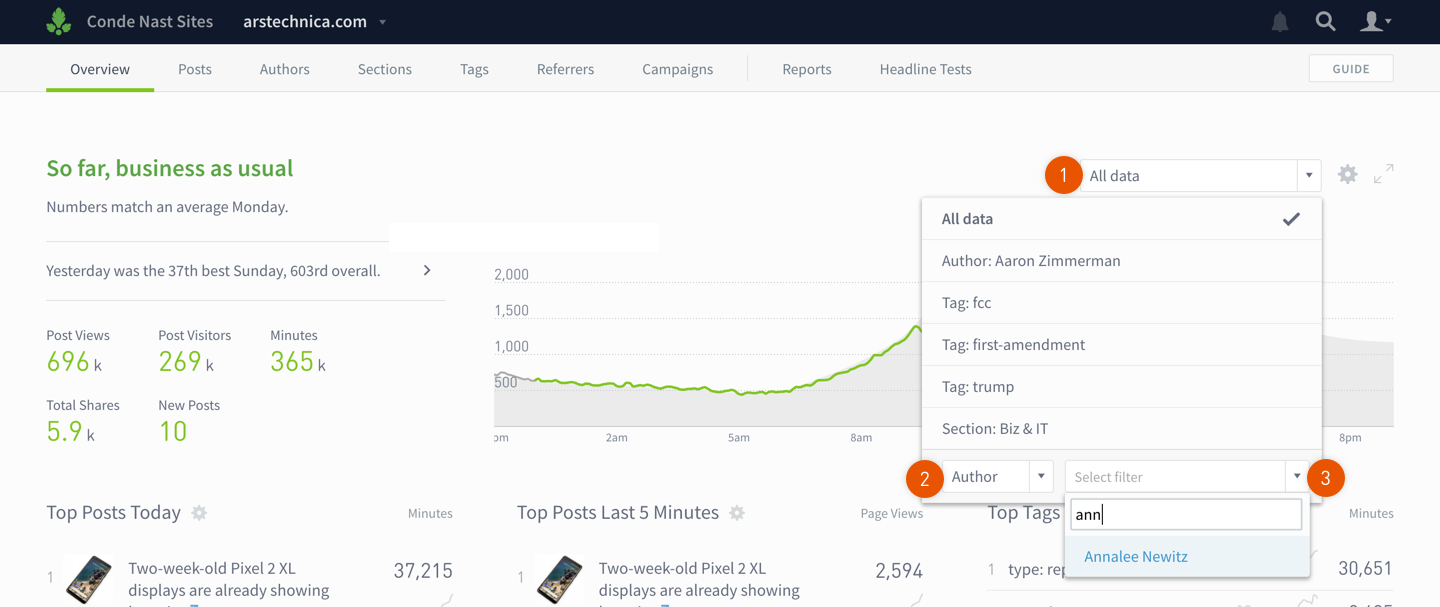
- From Overview, click the drop down.
- Click Add filter. Choose the type of filter: author, section, or tag.
- Click Select filter. Search for and select the name of author, section, or tag.
How Overview filters work
- You can save up to five custom filters at a time.
- You may use the filters on Overview for the fullscreen version.
- The eight-week rolling average doesn’t appear on the filtered version of Overview.
- A query string stores your Overview filters in the URL (e.g. ?overview_author=JK_Rowling). Bookmark the URL to come back to the filtered view quickly or share it with your team so you’re all looking at the same data.
Dashboard Overview Settings
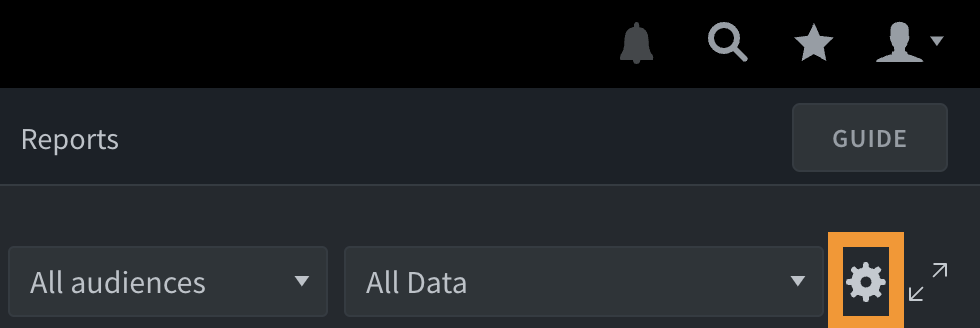
Click on the cog in the upper right corner to open the settings panel.
From here, you can pick what stats and listings to display. Your browser will save your settings.
Change overall stats
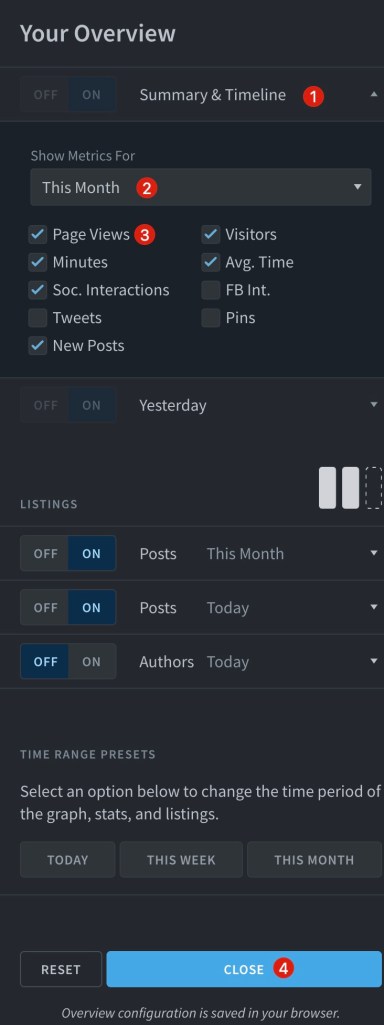
- Click the top drop down in the settings panel.
- Click the “Show Metrics For” drop down to change the the time range for the overall stats.
- Select the metrics you want to display in the overall stats.
- Click Close.
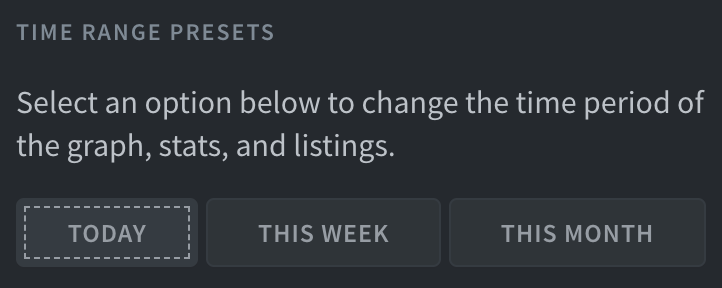
Note: changing these settings won’t affect the time range of the post listings. To change the time range of the graph, stats, and listings (at the same time), select one of the “Time Range Presets.”
Time Range Presets
The Dashboard Overview defaults to showing Today’s data (based on your team’s Time Zone setting). However, there are a variety of places to change your timeline (the Overview graph, listings, etc.). Read more about comparing with past performance.
Change listings
You can change what appears in the listings on Overview and fullscreen Overview.
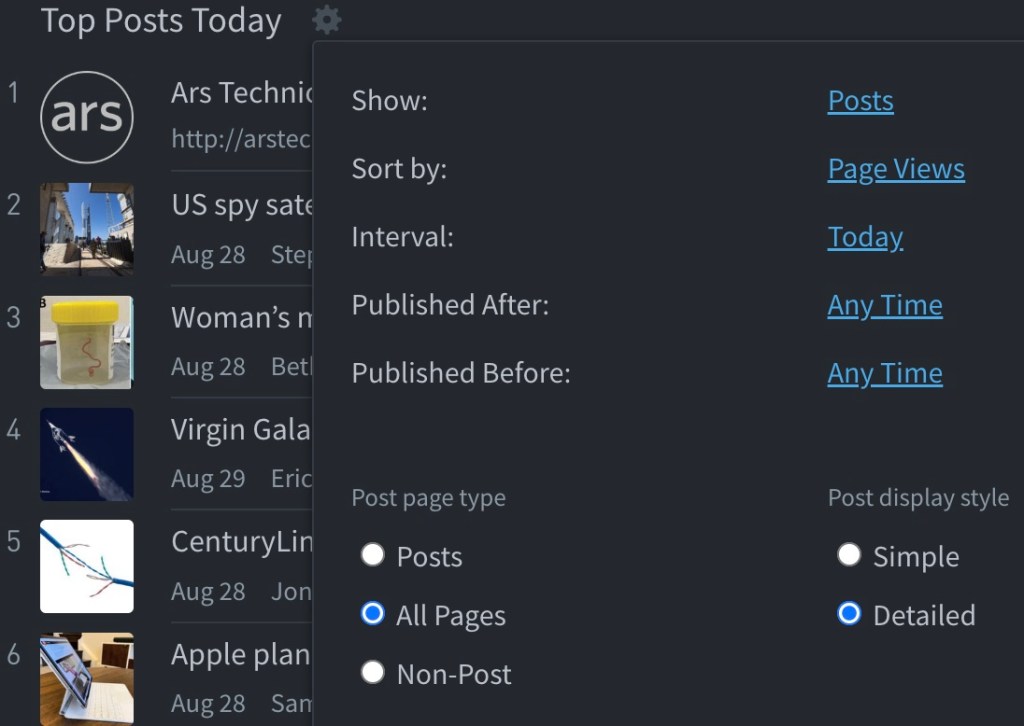
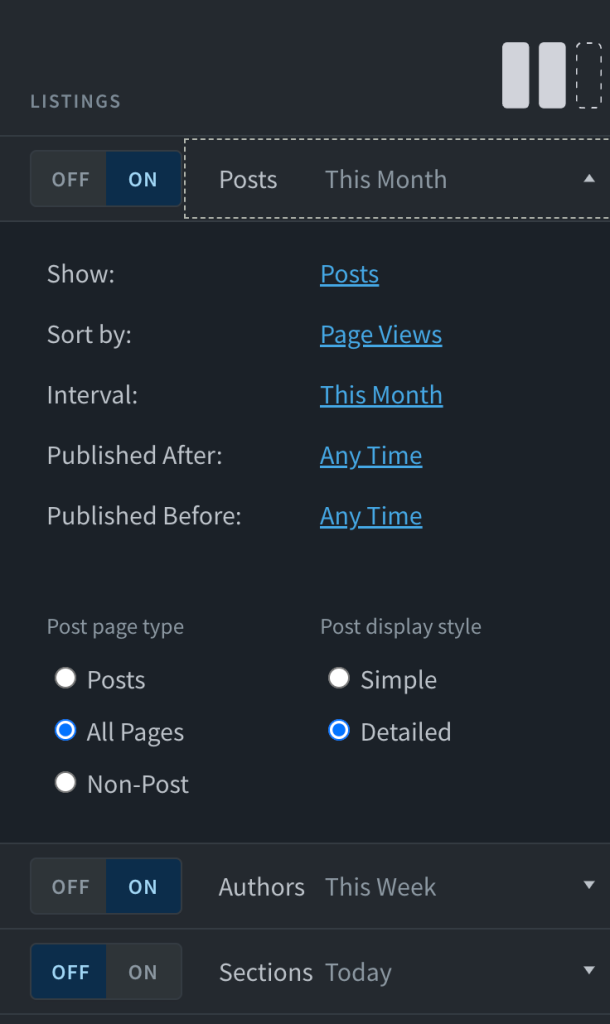
- From Overview, click the cog next to the listing you want to change.
- Pick the type of metadata, time range, and metric. Some types of metadata will have more display options than others.
- If you want to add or remove a listing column, select the cog from the upper right corner of the Overview screen.
How Overview settings work
- Your browser will save your settings. Click Reset to clear settings.
- Settings for Overview and fullscreen Overview are saved separately (fullscreen Overview settings are saved in the URL). If you make changes in the settings panel on Overview, they won’t carry over to the fullscreen version.
- For best results, we recommend disabling ad blockers for the Parse.ly dashboard.
Fullscreen Overview
We’ve designed the fullscreen version of Overview to display today’s data on big screens, like a TV or monitor. Click the expander icon in the top right to open fullscreen Overview.
Change fullscreen Overview filters and settings
The filters and settings options for fullscreen Overview are largely the same as “regular” Overview, with a few exceptions.
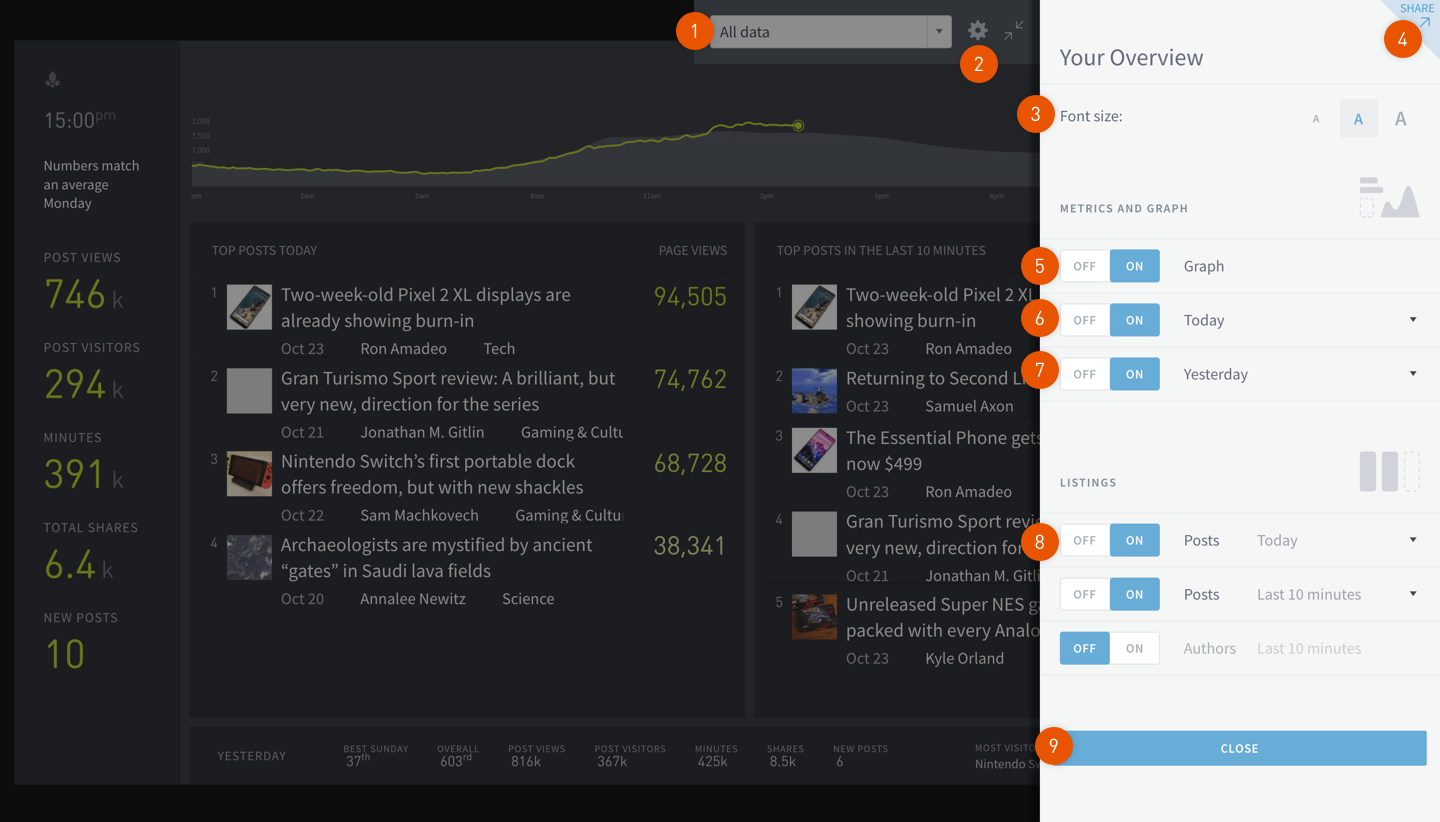
- Filter by author, section, or tag. Fullscreen Overview filters are the same as “regular” Overview.
- Click the cog to open the settings panel.
- Adjust the font size.
- Create a Shared Link to fullscreen Overview. Anyone who visits this link won’t be able to navigate away from the fullscreen version of overview.
- Add or remove the graph.
- Add, remove, or edit today’s stats.
- Add, remove, or edit yesterday’s stats.
- Change what appears in the listings.
- Close the settings panel.
How fullscreen Overview filters and settings work
- On fullscreen Overview, settings in the panel and filters are saved in the URL. Bookmark the URL to come back to the filtered view quickly or share it with your team so you’re all looking at the same data.
- The eight-week rolling average doesn’t appear on the filtered version of Overview.
Last updated: October 09, 2023