Understanding Calculations in Parse.ly
Throughout the Parse.ly Dashboard, you may encounter averages, comparisons, and other numbers that don’t have an explicit description. This guide is dedicated to calculations in Parse.ly, helping you navigate through various metrics and data interpretations. We will discuss the Overview Sentiment, Overview Timeline, Factoids, and Goals.
Overview Sentiment
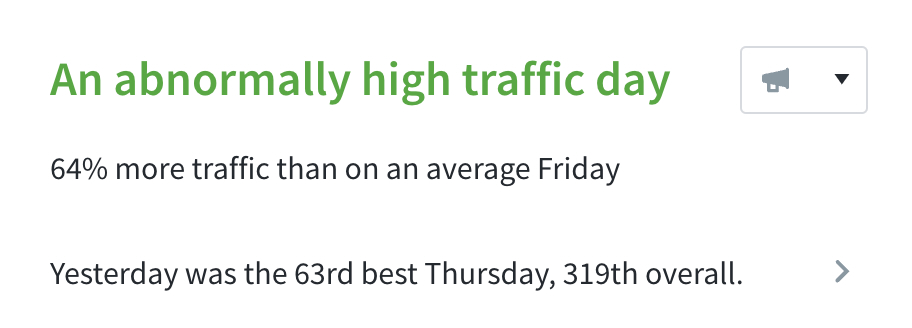
The “overview sentiment” is the second sentence that sometimes appears in the overview, beneath the Headline. It says something like “X% more traffic than on an average Friday”. These are the possibilities for that sentence:
- Numbers match an average weekday
- X% more traffic than on an average weekday
- X% less traffic than on an average weekday
The rules for that sentence to show up are:
The time range preset is “today” AND There’s no filter applied
To calculate this percentage, we query numbers for the last 8 weekdays (where weekday stands for the day of the week that we’re currently in, so if it’s Friday, it’ll query the previous 8 Fridays).
If we’re not tracking the Site ID for that long, it gets as many weekdays as possible up to the track start date – and compares it against today’s number. It also considers whether we’ve included Apple News traffic in the top-line metrics per your specification.
Overview Timeline
The Overview timeline also shows comparisons by drawing a gray line or gray bars in the background of the timeline.
Depending on your time-range-preset selection, we’ll calculate the gray average-graphs as follows:
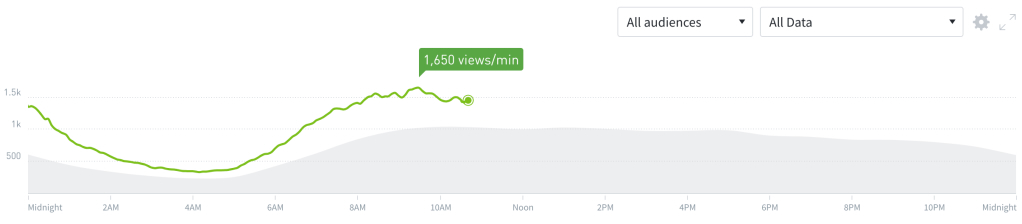
Today
Get the past 8 weeks of data for today’s weekday, then calculate its average and draw the gray line.
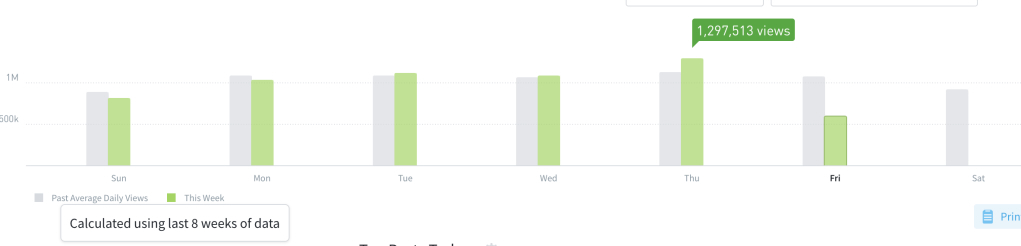
This week
Get the past 8 weeks of data, then calculate the averages for each weekday and draw the gray bars based on that.
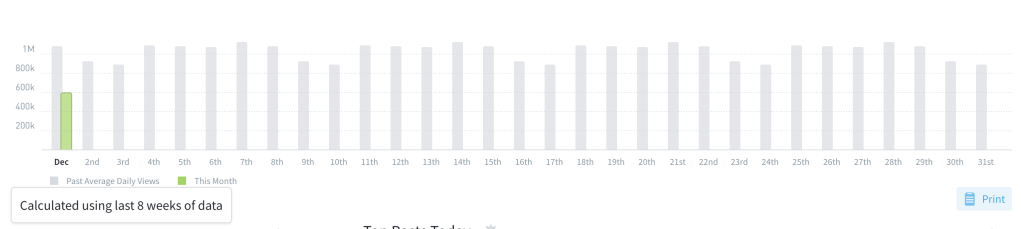
This month
Get the past 8 months of data, then calculate the averages for each day of the month and draw the gray bars based on that.
Timeline Projections

When viewing a listings page, e.g., Posts, Videos, Conversions, switching your view to Historical > Daily will reveal a bar chart. The bar representing today will begin as the outline of a bar that will fill throughout the day. The height of this bar represents the expected amount of traffic that your site will receive today. We calculate this projection from the same day of the week for the last 8 weeks.
Factoids
Factoids are the numbers we display under the timeline and filter bar on many Dash pages.

Comparison Bars
Beneath the Factoids, we display comparison bars. These illustrate the relative performance of the metric to the past 4 similar periods
We only expect these comparison bars to appear when:
In historical mode AND The number of days in the period selected is between 1 and 31 (including both numbers in the range)
Example: month selection
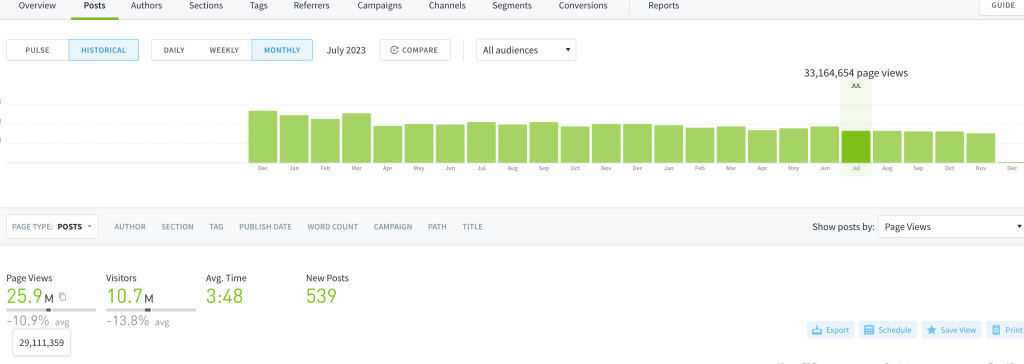
When selecting the month of July with the monthly toggle chosen, the average bar below the factoids appears because it’s the historical mode (not pulse), and July has no more than 31 days. After the bug fix mentioned above, there’ll also be the condition that the given Site ID has been tracked at least since 4 * 31 = 124 days
The -10.9% average compares the 25.9M views with the 29.1M average (which is calculated by getting the number of days in July (31 days) and getting the number of views for the last 4 periods of 31 days. Note that the past 4 periods won’t necessarily match the past 4 months because it depends on whether the past months had 31 days or not.
Example: day selection

In the above image, we see that Wednesday, November 29, received 36,856 page views (as seen in the timeline). The comparison bar indicates this is 3.8% above the average of 35,503.75 page views.
The average is from:
| Date | Page Views |
|---|---|
| Wednesday November 22 | 35,885 |
| Wednesday November 15 | 34,416 |
| Wednesday November 8 | 35,814 |
| Wednesday November 1 | 35,900 |
| Average | 35503.75 |

Goals
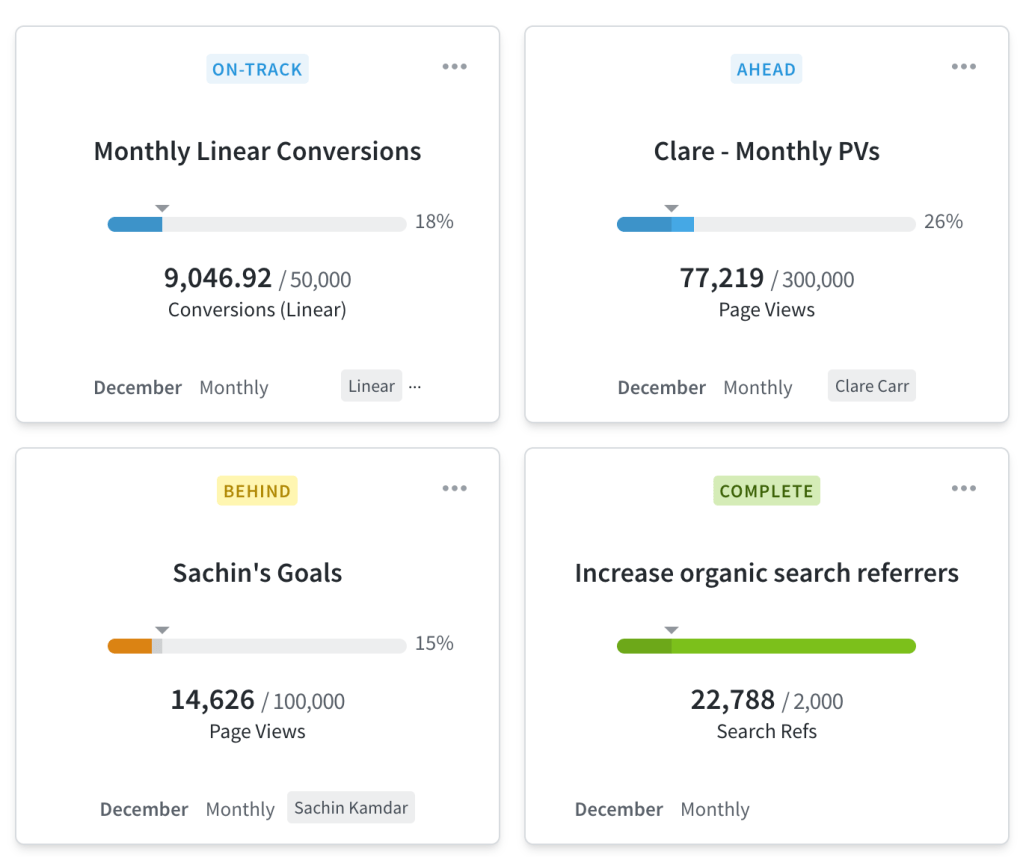
After setting up Goals in Parse.ly, understanding the calculations in Parse.ly for tracking your progress is helpful. We label in-progress goals as Behind, On-Track, or Ahead. We determine these labels based on the pace calculated in Parse.ly as follows:
time_passed_percent = time_so_far / goal_total_time
expected_number = goal_number * time_passed_percent
pace = current_number / expected_number
If the page is lower than 0.9, it’s below the expected. If it’s larger than 0.9, then it’s above the expected. Otherwise, it’s On Track.
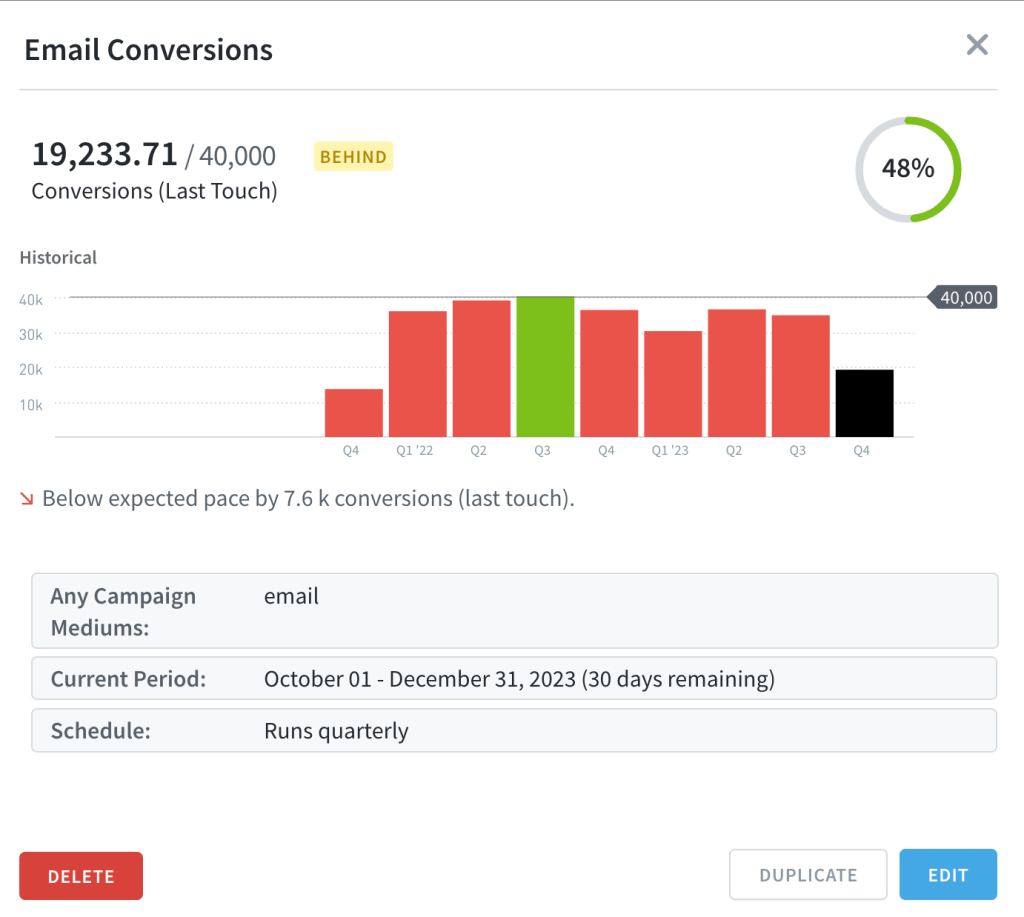
Additionally, when we click on one of these goals, a modal appears. Within it, there’s a sentence that depends on the goal’s pace, with two possibilities:
- Above expected pace by X metric name.
- Below expected pace by X metric name.
Rounding errors
There are some Calculations in Parse.ly that may not seem to agree with each other. And there are a couple of reasons for that. Firstly, there are many calculations running on the page in real-time, so it’s possible to find some of the calculated results lagging behind the others. And secondly, not all metrics are suitable for adding together due to factors like the “hotel problem“.
Conclusion
With this overview of calculations in Parse.ly, you’re now equipped to better analyze your dashboard metrics. If you have a question about these or any other calculation, please contact Support.
Last updated: May 24, 2024