Posts / Pages
The title of this page will depend on your Default Page Type set in Preferences. We will refer to it as “the Posts page”. You can find this page by selecting it from the nav bar.
The Posts page shows the best performing urls based on the selected time frame, metrics, and filters.
Pulse: Real-time data
The Posts page defaults to the Pulse view of today’s real-time data.
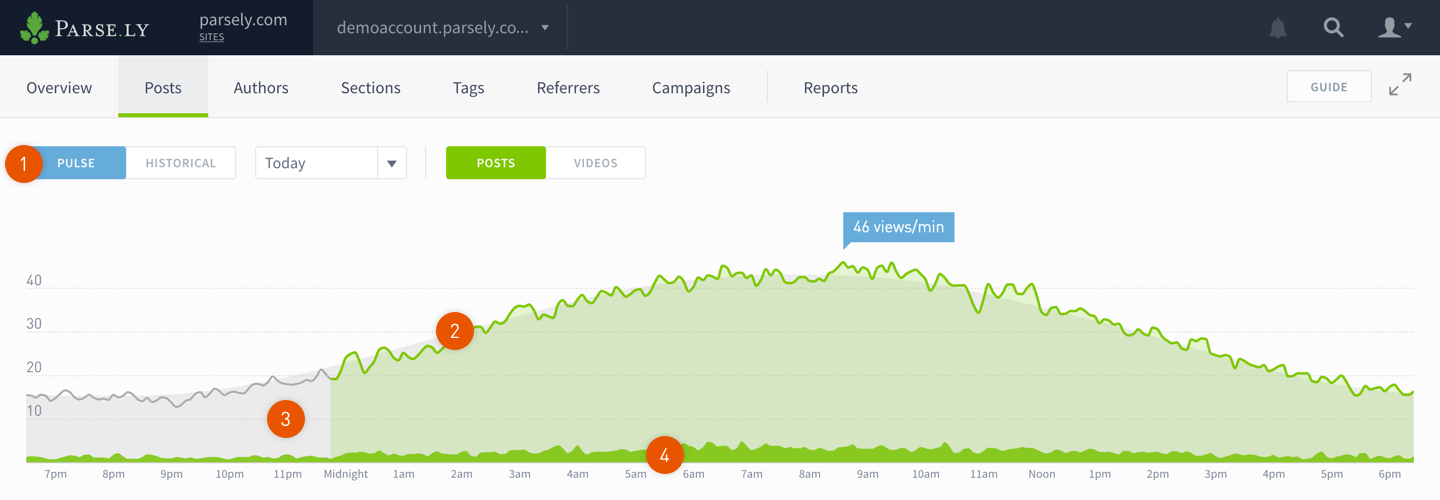
- Clicking Pulse/Historical will toggle between real-time and historical data.
- The green trend line shows traffic for the current day.
- The gray shaded area shows the eight-week trailing average.
- Hovering over a post title will show its proportion of all traffic.
Pulse filter: Specify a time frame for real-time data
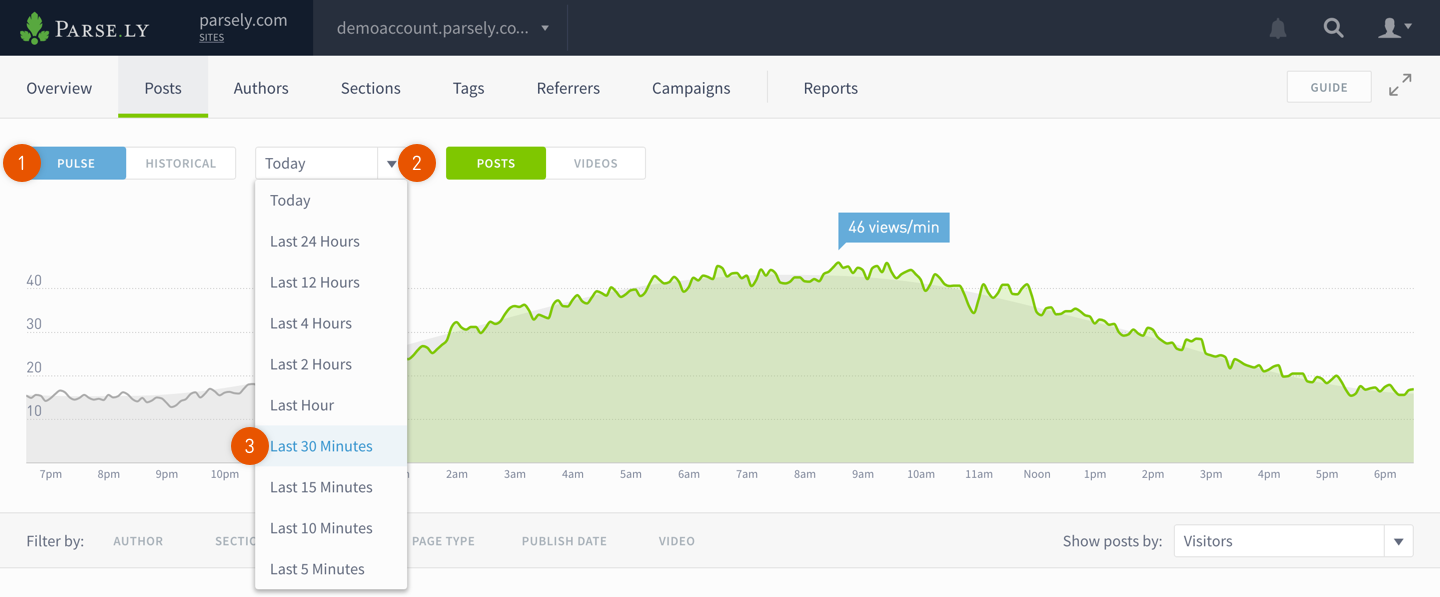
- Click Pulse.
- Click the dropdown.
- Select the time frame.
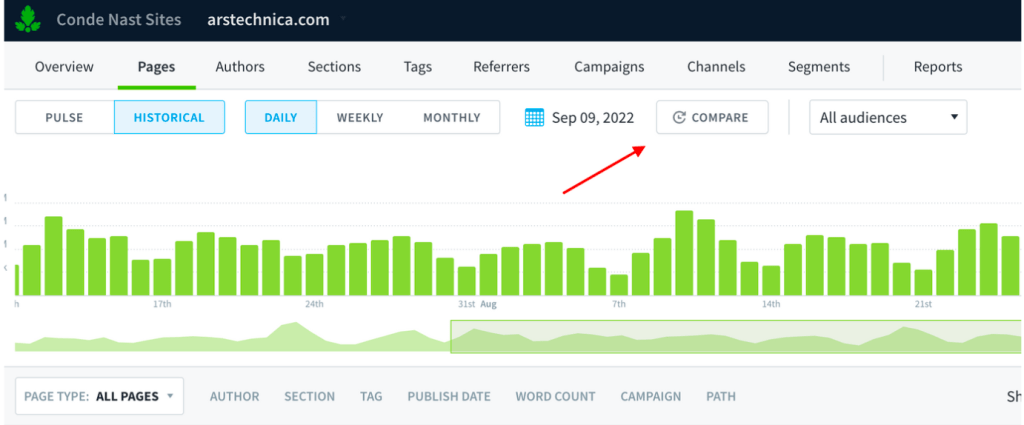
Historical
Click on Historical to see a bar graph of long-term traffic data. Historical defaults to the current day.
Specify a time frame for historical data
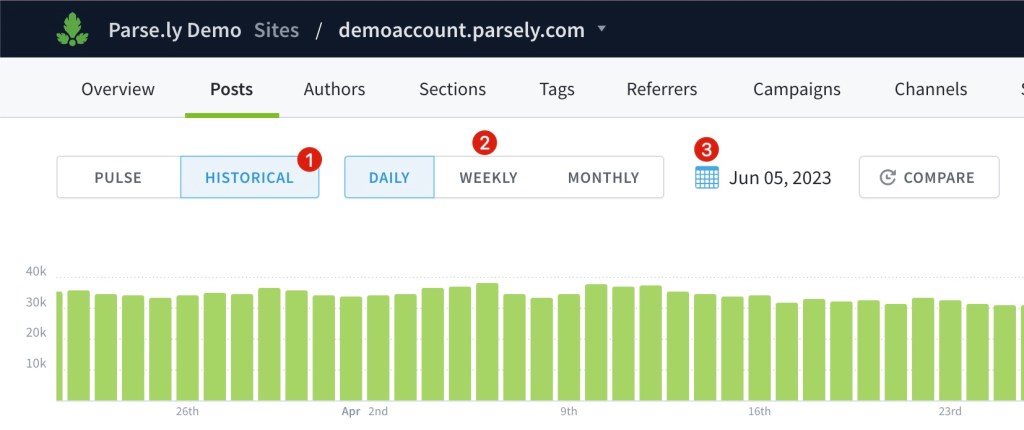
- Click Historical.
- Click one of the presets to toggle between daily / weekly / monthly views or
- Click the calendar icon to specify a specific range.
You can also click and drag the bar graph to select a date range. Click and drag the line graph beneath to scroll through the dates.
Compare
With Historical selected, you may use Comparison Mode.
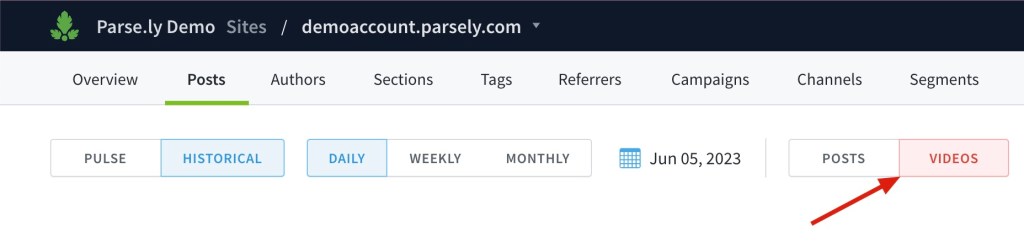
Posts / Videos
If you’ve purchased Video Tracking, then you will see an additional set of toggle buttons to display Posts or Videos. See what our Video Tracking can do.
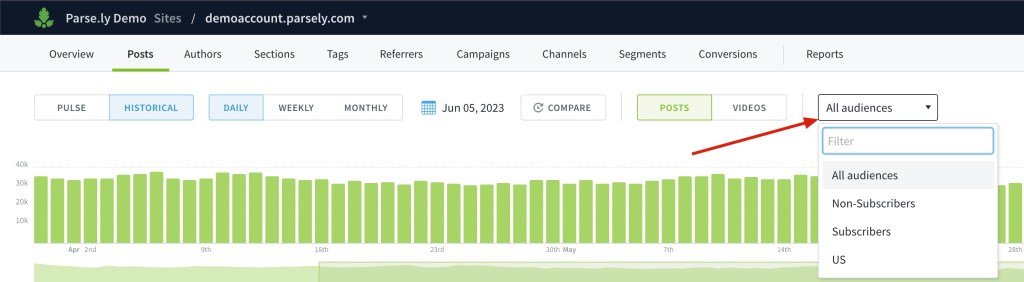
Audience Segments
If you’ve purchased Audience Segments, then you will see an dropdown menu to display filter for a specific audience.
Filters and metrics
Filter posts
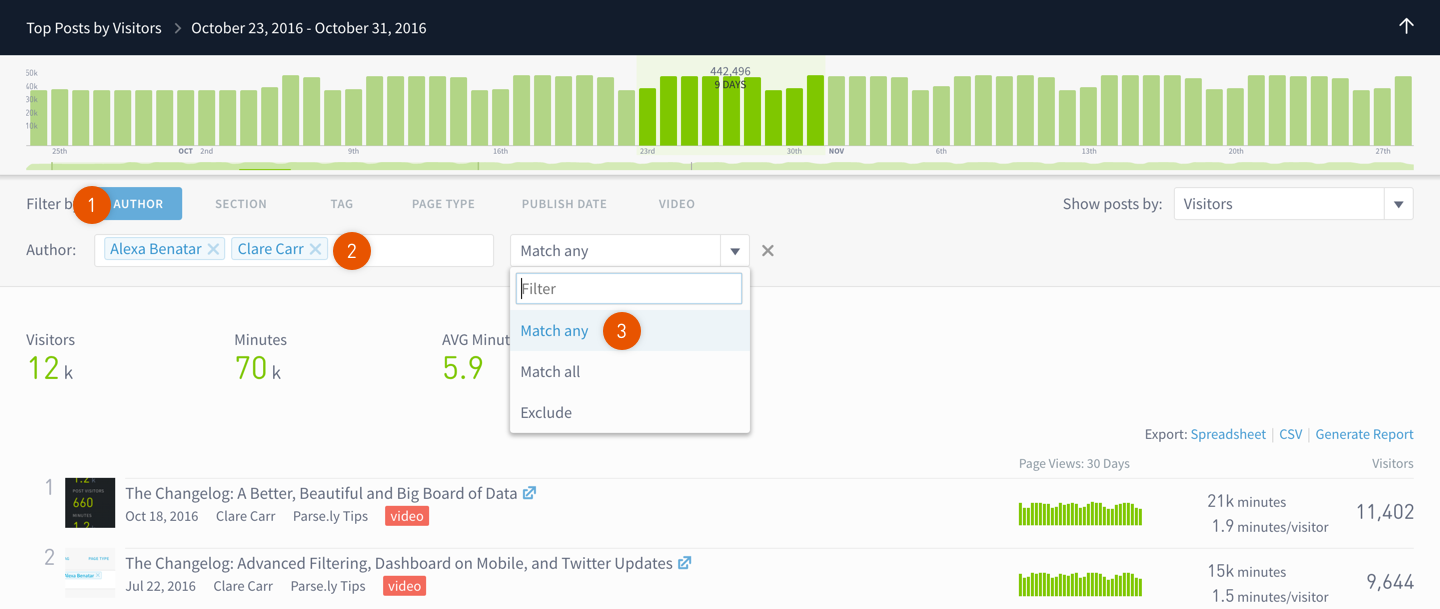
You can filter based on the metadata you’ve provided as described in our filters guide.
- Click a filter.
- Enter who, what, or when you want to filter (e.g. the name of an author, the title of a section).
- Select how you’d like to filter results.
Select a metric
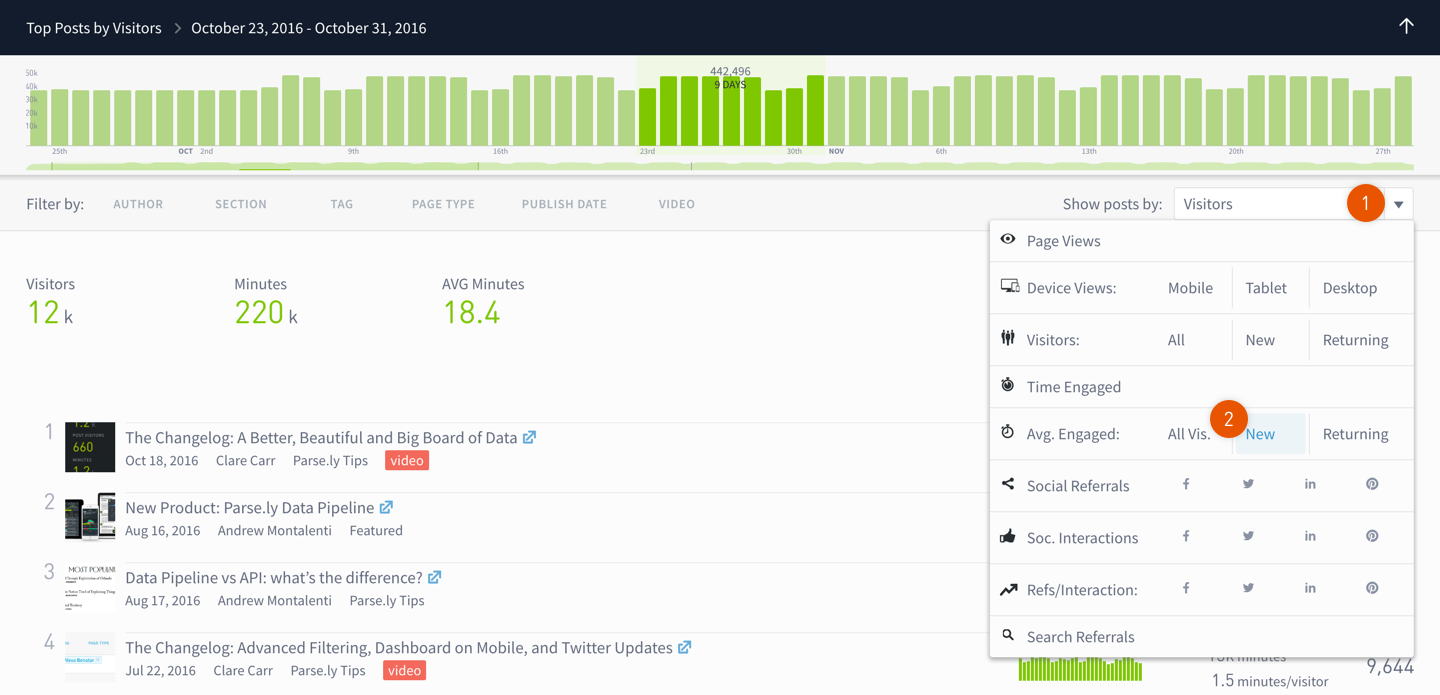
- Click the dropdown.
- Select a metric.
View Top Posts on a big screen
Once you’ve selected the time frame, filters, and metrics that matter most, click the expander icon in the top right to show a big-screen-friendly version.
Get detailed information on any post
Click the title, author or section link of any post to see more details.
Last updated: June 03, 2024