Reports: Details Report
The Details report shows a data summary for a particular author, section, tag, or for the whole site. It’s helpful for gauging performance during a certain time period, like the last week or the last month. See a live example.
The Details Report is split into sections.
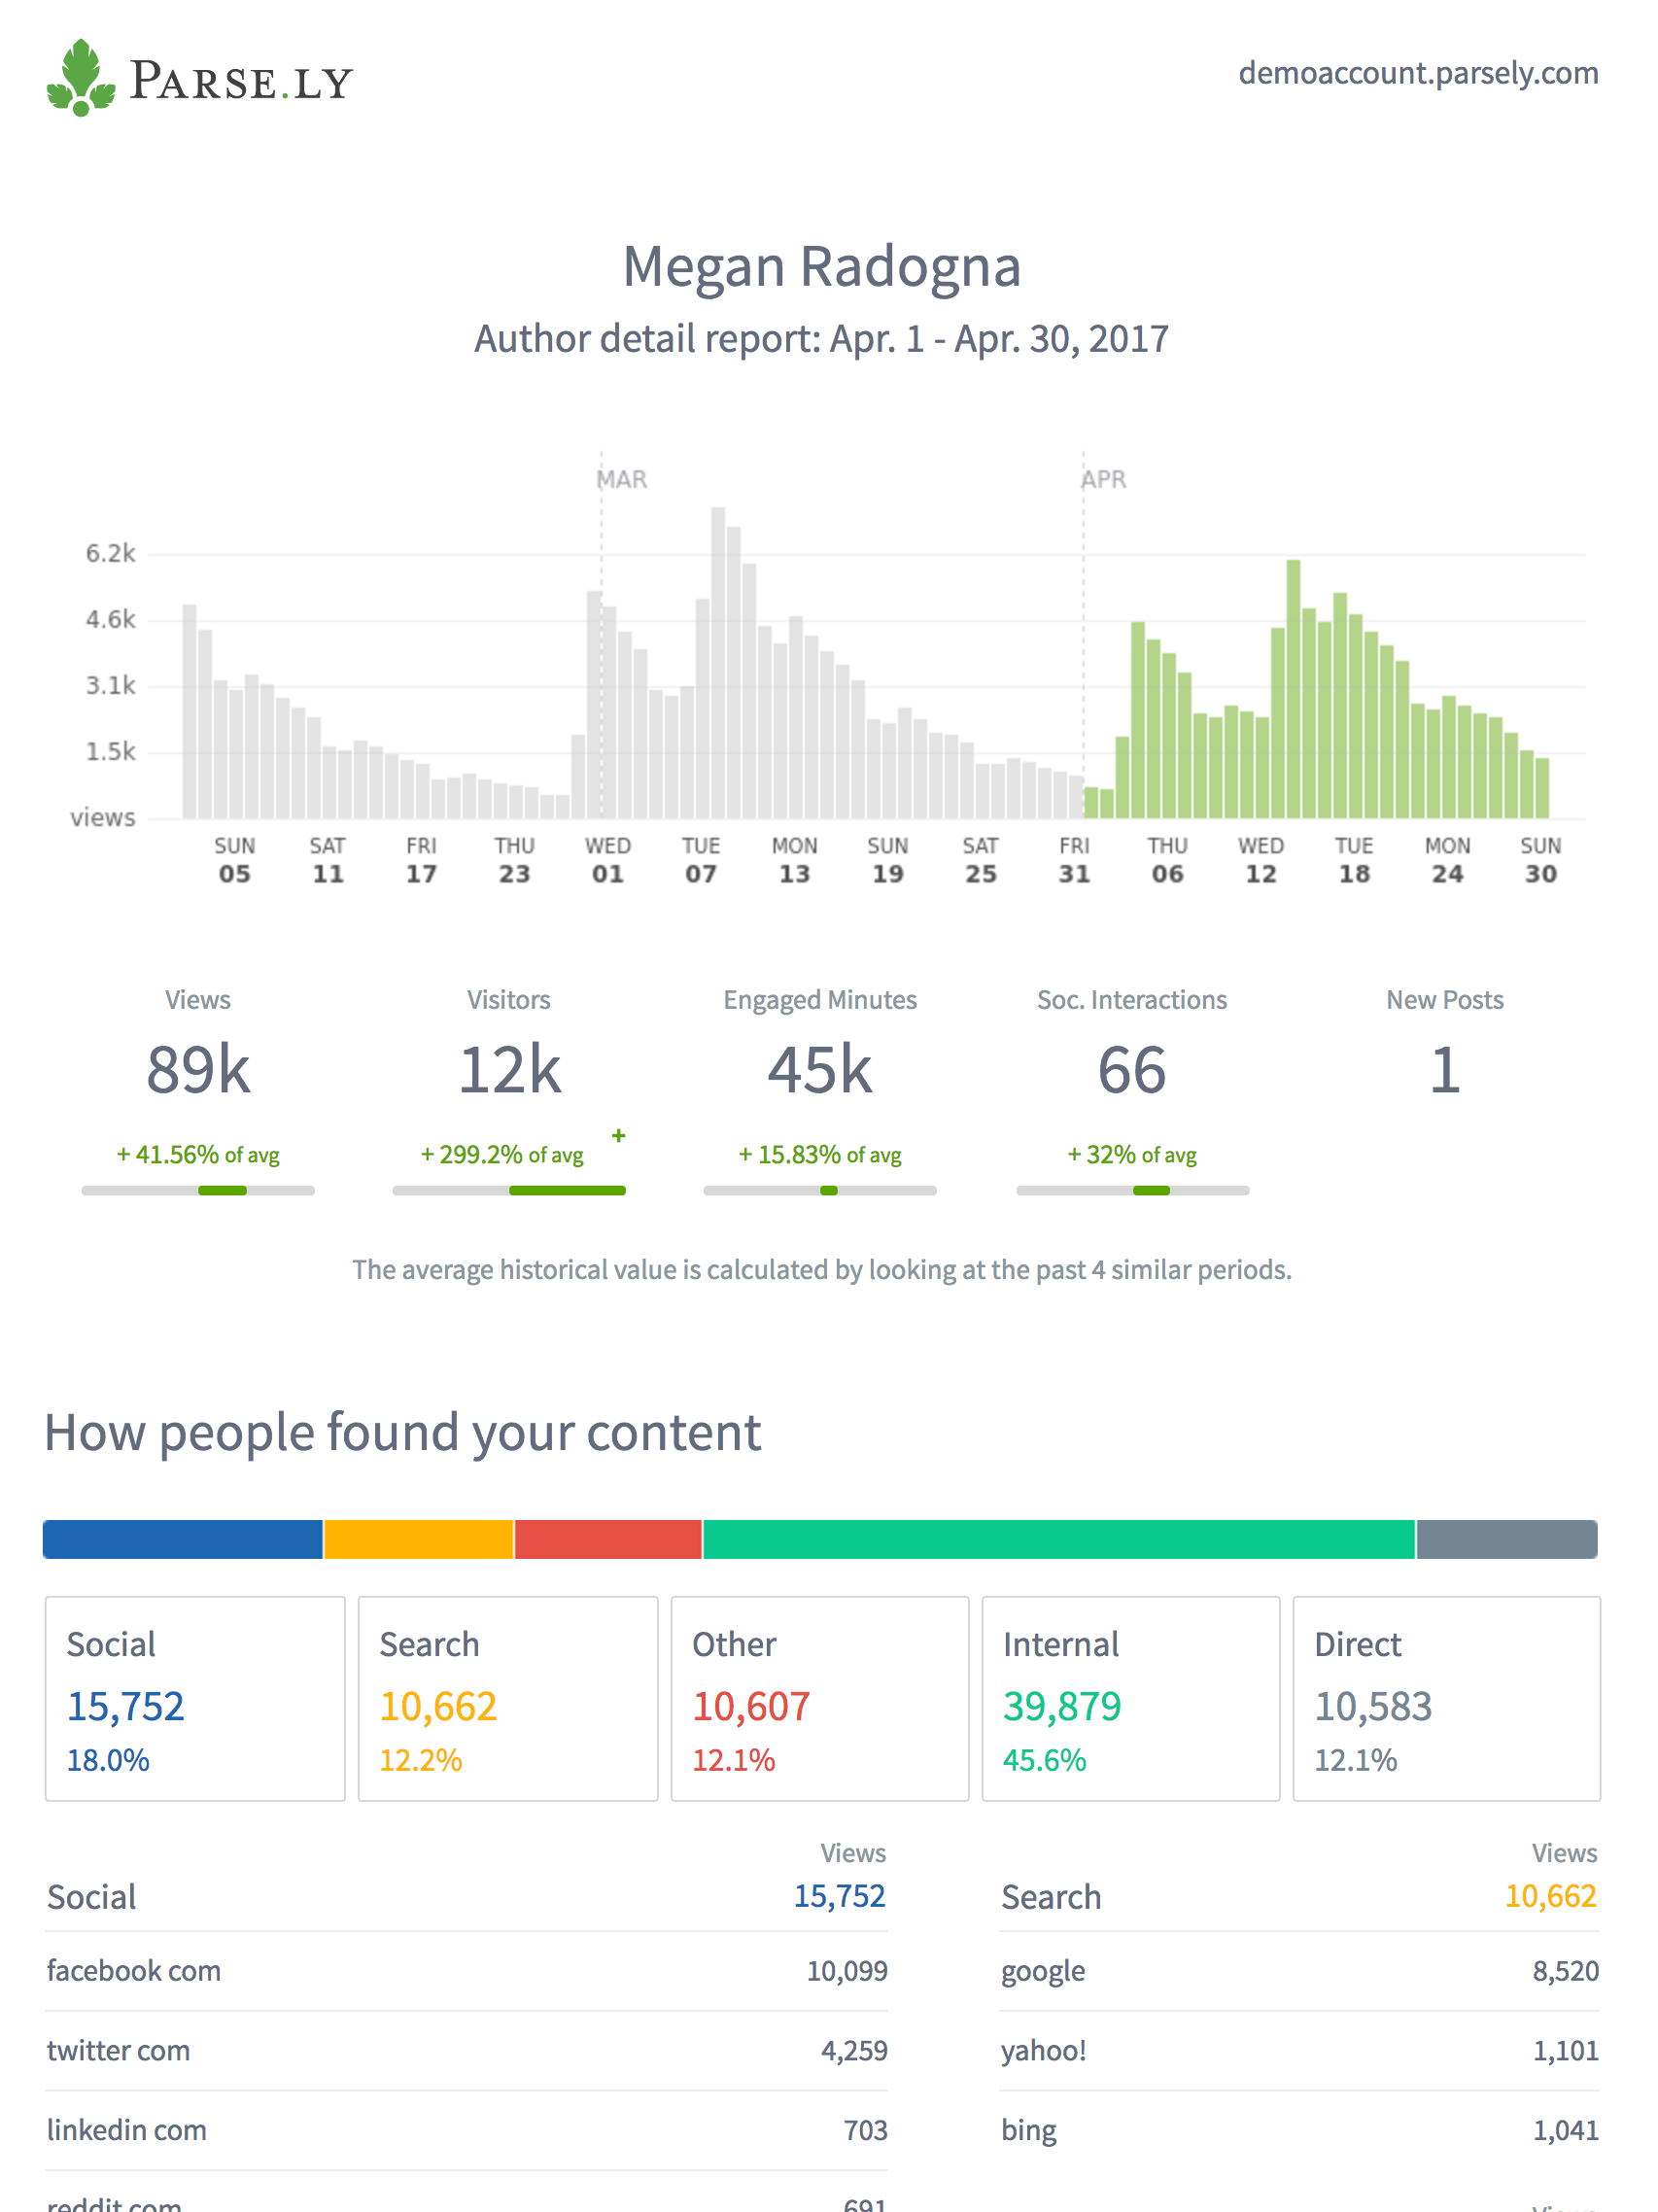
- The first section shows traffic for the selected aspect (author, tag, section, or site) over a certain time period. The benchmarks for each metric provide insight into where your traffic is improving or lagging.
- How people found your content shows a breakdown of referral traffic and the top referrers from Social, Search, Other, and Internal.
- Device Breakdown shows where people read your content—on a desktop, mobile device, or tablet.
- Visitor Breakdown shows how many new and returning visitors you had in the selected period of time.
- Top Authors, Top Sections, and Top Tags list the highest performing authors, sections, or tags by average page views on new posts or average video starts.
- Top Posts and Top New Posts list the highest performing posts or videos based on a selected metric.
Use Cases
- Get a high level overview of site performance with the Site details report including the number of posts published, total site page views, visitors and engaged minutes, how people found your content, and top posts, authors, sections and tags.
- Author/Section/Tag – Get more granular information about a specific author, section or tag.
- We highly recommend that every publisher sets all of their authors up with a weekly recurring Author Details report. Authors will be able to understand:
- Where their specific audience came from, identify which channels have the biggest growth potential, and implement strategies for growing those specific channels.
- Build on their already successful posts by writing follow ups if it is a developing story or writing another piece on a topic that is resonating with their audience.
- Tags details reports are most often used to track sponsored content. By tagging each sponsored post with the name of the sponsor, you can easily generate a sleek and easy to digest report that has a URL that can be shared.
Tips
- This report is interactive. Click a particular referrer, post, author, section, or tag to see more details in the Parse.ly Dashboard.
Last updated: June 05, 2025