Top bar

Across the top of the Parse.ly Dashboard is the top bar. It sits above the navigation bar and contains several features and tools.
Network identifier
The far left of the top bar displays the name of your network. Clicking here brings you to https://dash.parsely.com/[your Network name]/sites/.
If you have more than one production site in the Dashboard, this view is known as Network Rollup, where a comprehensive overview of all sites (production and non-production) in the network can be seen, along with all Dashboard functionality.
If you only have one production site, this view is instead a basic snapshot of the production site and any non-production sites — click any of these from the list to see deeper details.
Site Group identifier

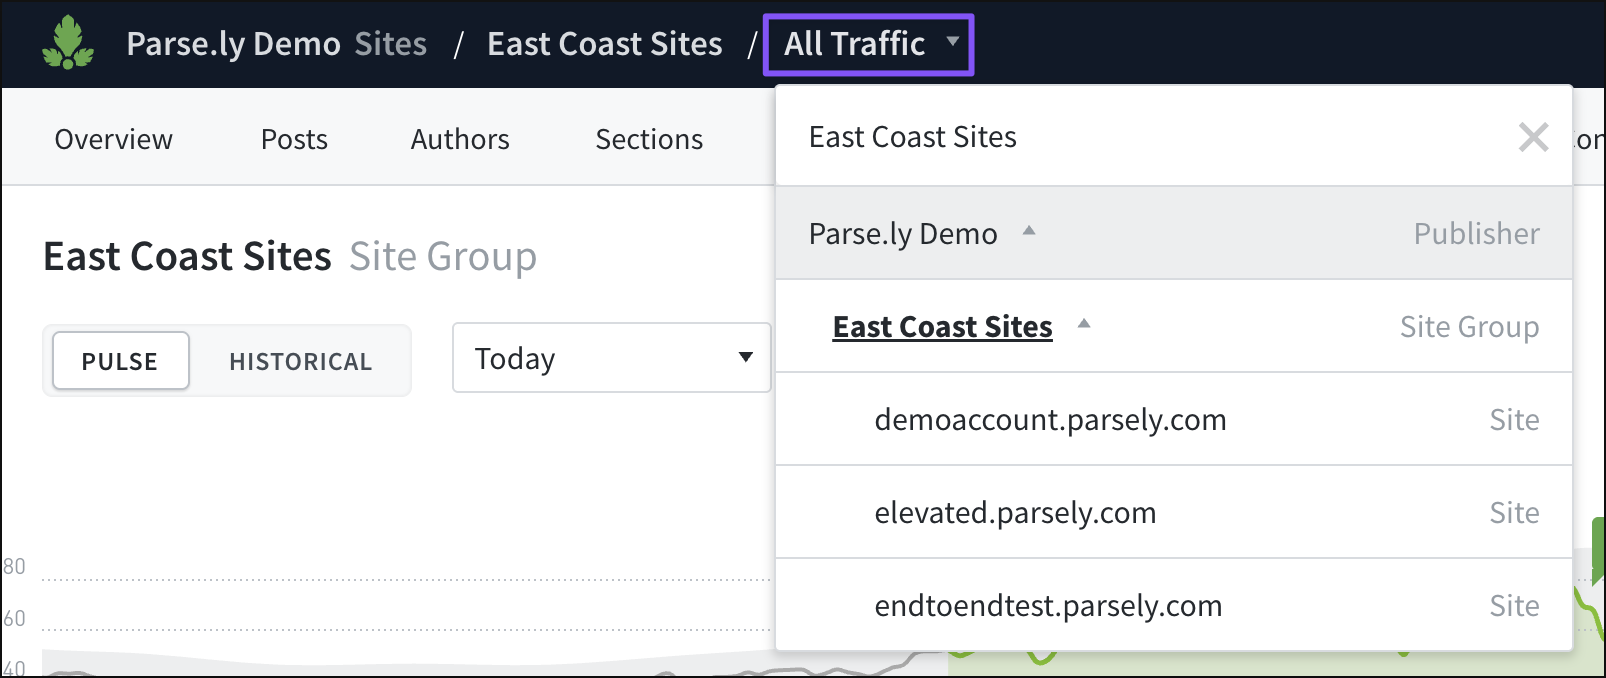
To the right of the network identifier in the top bar, there will be a Site Group identifier if viewing a Site Group. Clicking on this identifier navigates to a view of sites within that Site Group at https://dash.parsely.com/[your network name]--[your Site Group name]/sites/.
Site ID selector
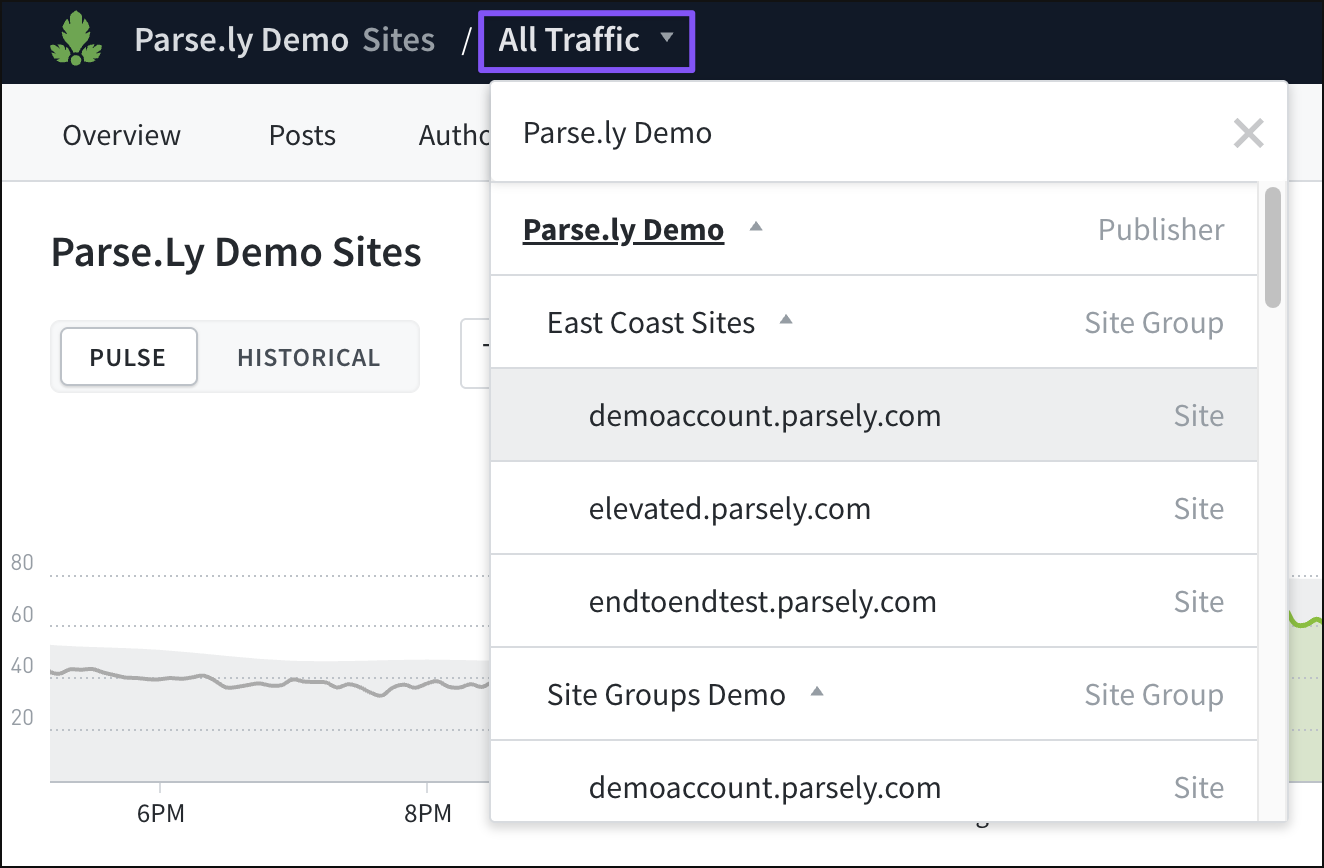
When in Network Rollup, “All Traffic” is seen in the top bar to the right of the network identifier. This drop-down selector allows navigation between various network levels, such as Site Groups and sites. If access is needed to one of these, ask an admin user to grant additional permissions.
In a Site Group view, “All Traffic” can be clicked to navigate to the single sites contained within that Site Group.
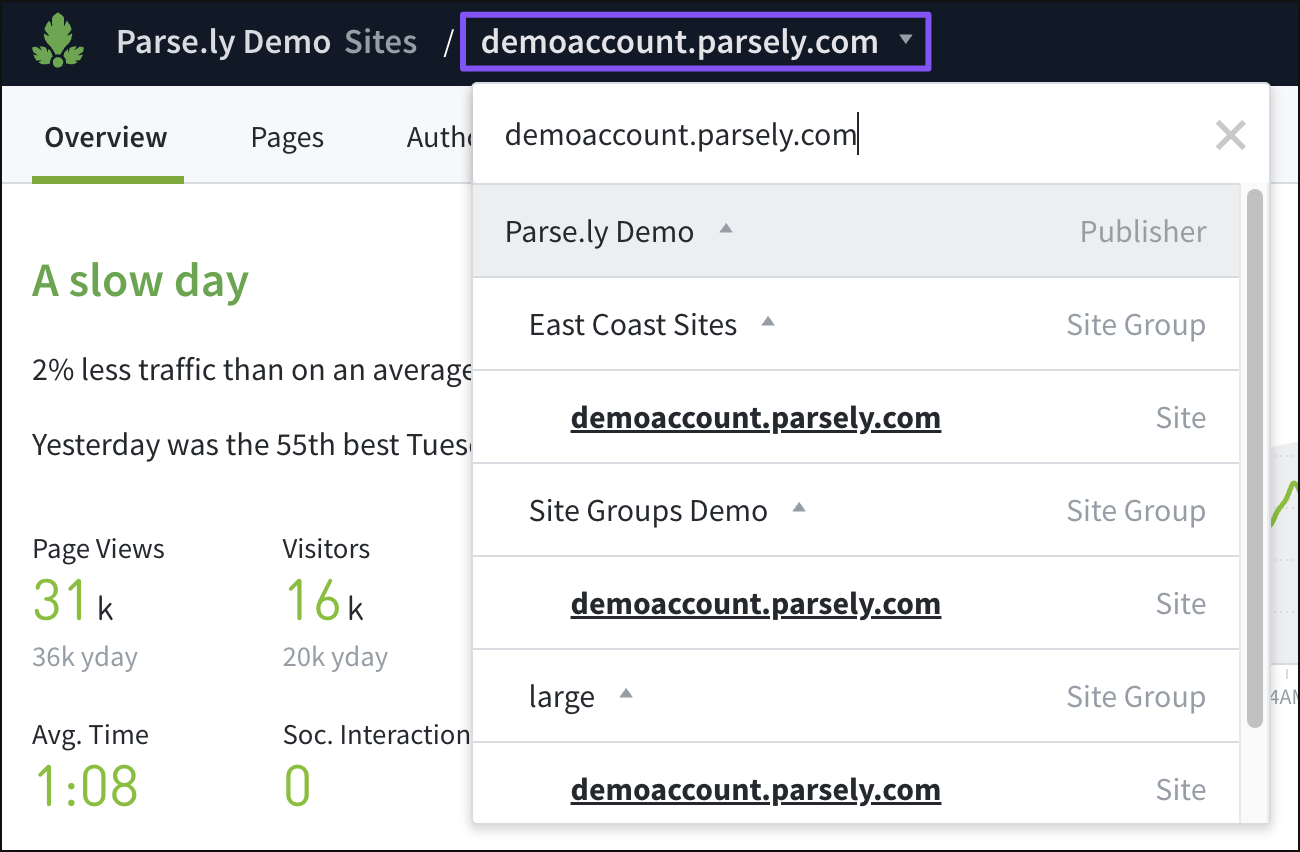
When viewing a single site in the Dashboard, the site ID selector will display that site’s Site ID. Clicking here will open a drop-down menu to allow navigation throughout the rest of the network.
Notifications
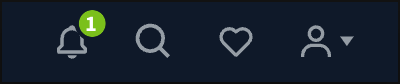
The bell icon on the right side of the top bar will light up with a number that corresponds with any unread notifications: a scheduled report is ready, maintenance messaging, etc. Clicking the bell icon will open the list of notifications.
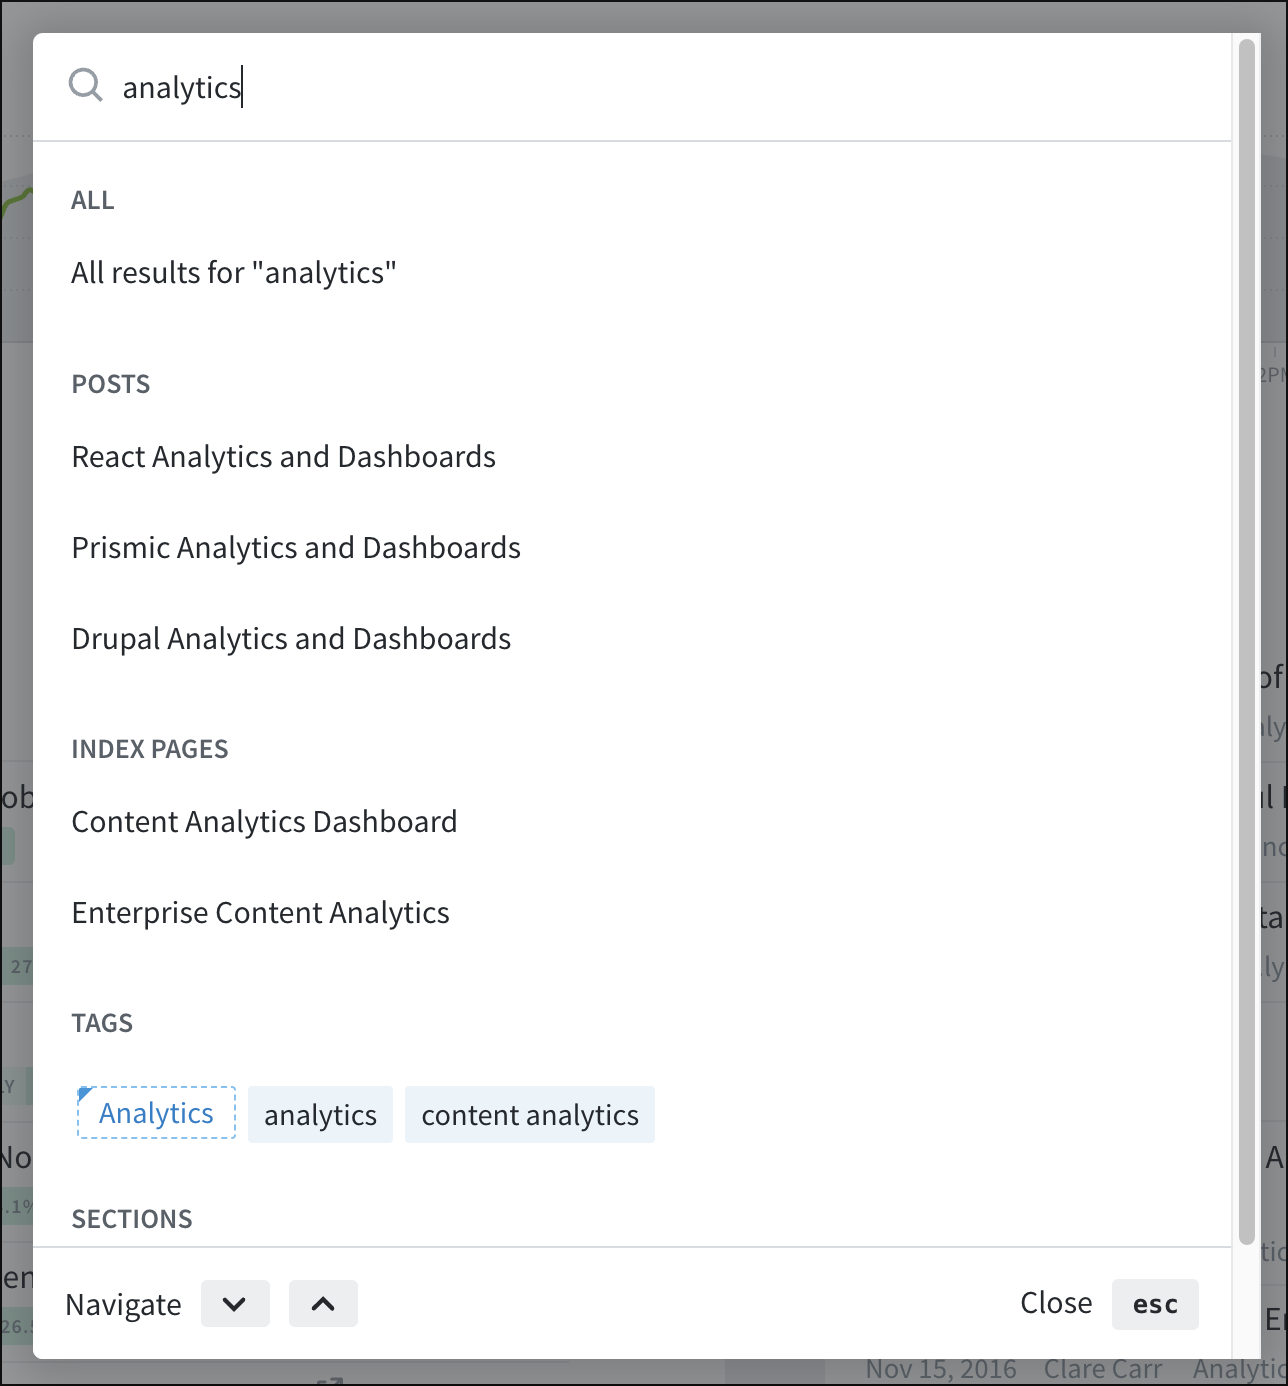
Search
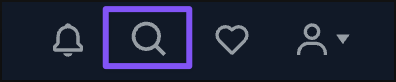
The magnifying glass icon on the right side of the top bar opens a search field when clicked. Typing in this search bar will begin populating a preview of results. Click “All results for…” to see all possible search results.
Saved views
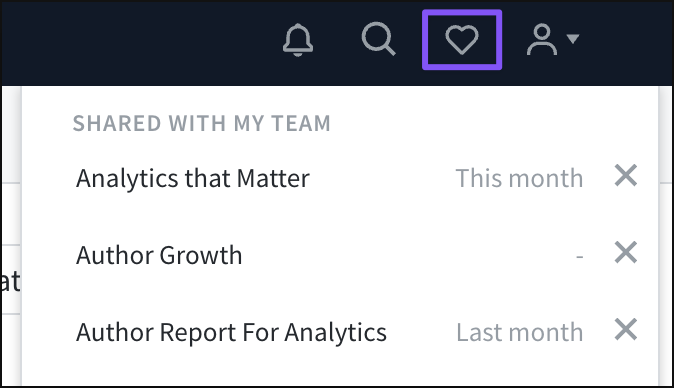
The heart icon on the right side of the top bar reveals saved views, including those you’ve shared and ones that teammates shared with you.
Account menu
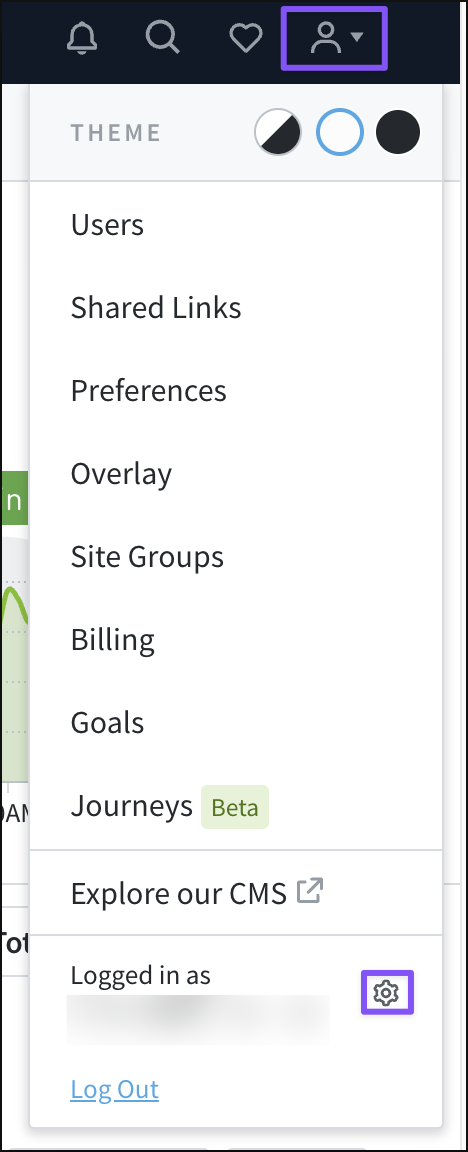
Access the account menu at the far right of the top bar. This menu will look different based on user permissions and whether you’re viewing a single site or Network Rollup in the Dashboard. In general, this is where all account settings are accessed and managed. Click the gear icon here to reset your password.
Last updated: June 09, 2025