Workflows
Now that you’ve integrated Parse.ly, adjusted your preferences, and invited your team, it’s time to understand best practices of Parse.ly workflows. This guide will feature some of the most common questions that teams, like yours, want to know about using Parse.ly analytics.
Team Management
What did my team publish this week?
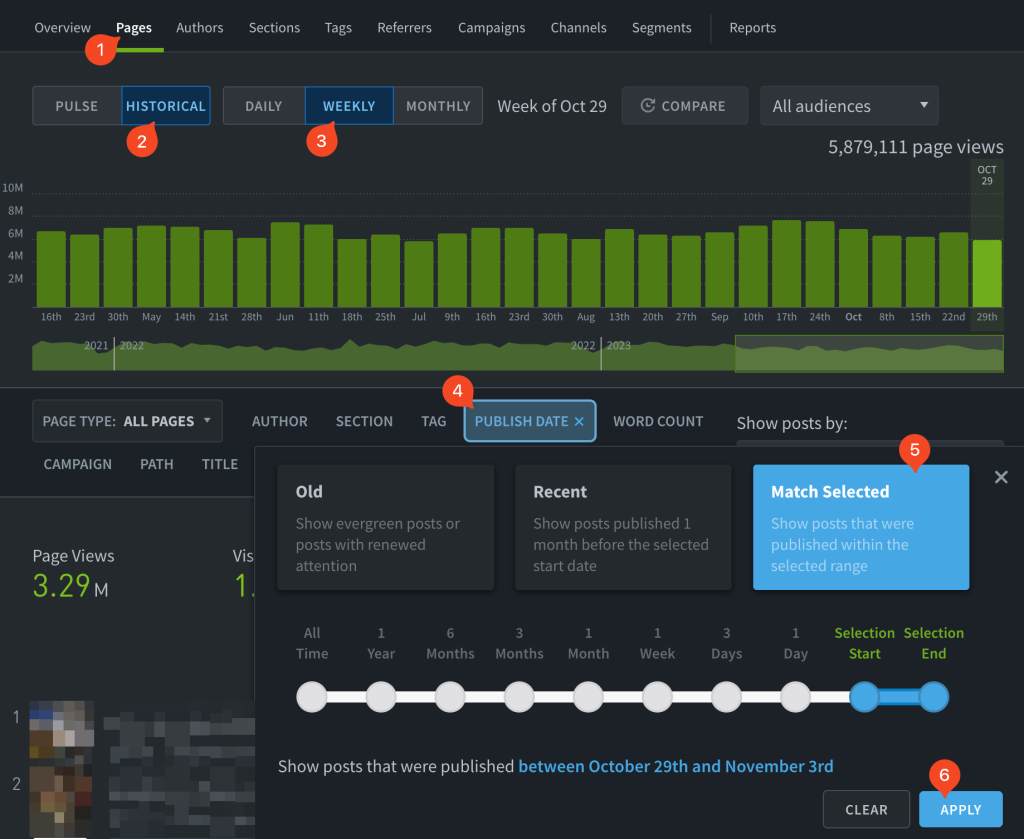
The default view will show you performance of all content on your site. By following these instructions, you can see how recently published content is performing.
- Open your dashboard to the Posts / Pages tab (or any non-Overview tab)
- Underneath the nav bar, select “Historical”
- Select “Weekly”
- Below the graph, select “Publish Date”
- Click “Match Selected”
- Click “Apply”
Bring data to your 1-on-1s and team meetings
- Create a top listings report and review it with the top author(s)
- What was so great about the content?
- What was the strategy?
- Review the bottom listings reports.
- It’s possible to have a low page-count but succeed with other metrics. Check visitor count, engaged time, recirculation rate, conversion rate.
- Why don’t we think it didn’t work?
- Check referrer metrics; did we miss a step in distribution? Can we fix that now?
- What could we change in our process?
Set goals for the whole team, and make them visible for everyone
- Account admins can create goals from the Account menu (👤) in the top bar.
- From there, each user can customize their overview screen (⚙️) to include Goals.

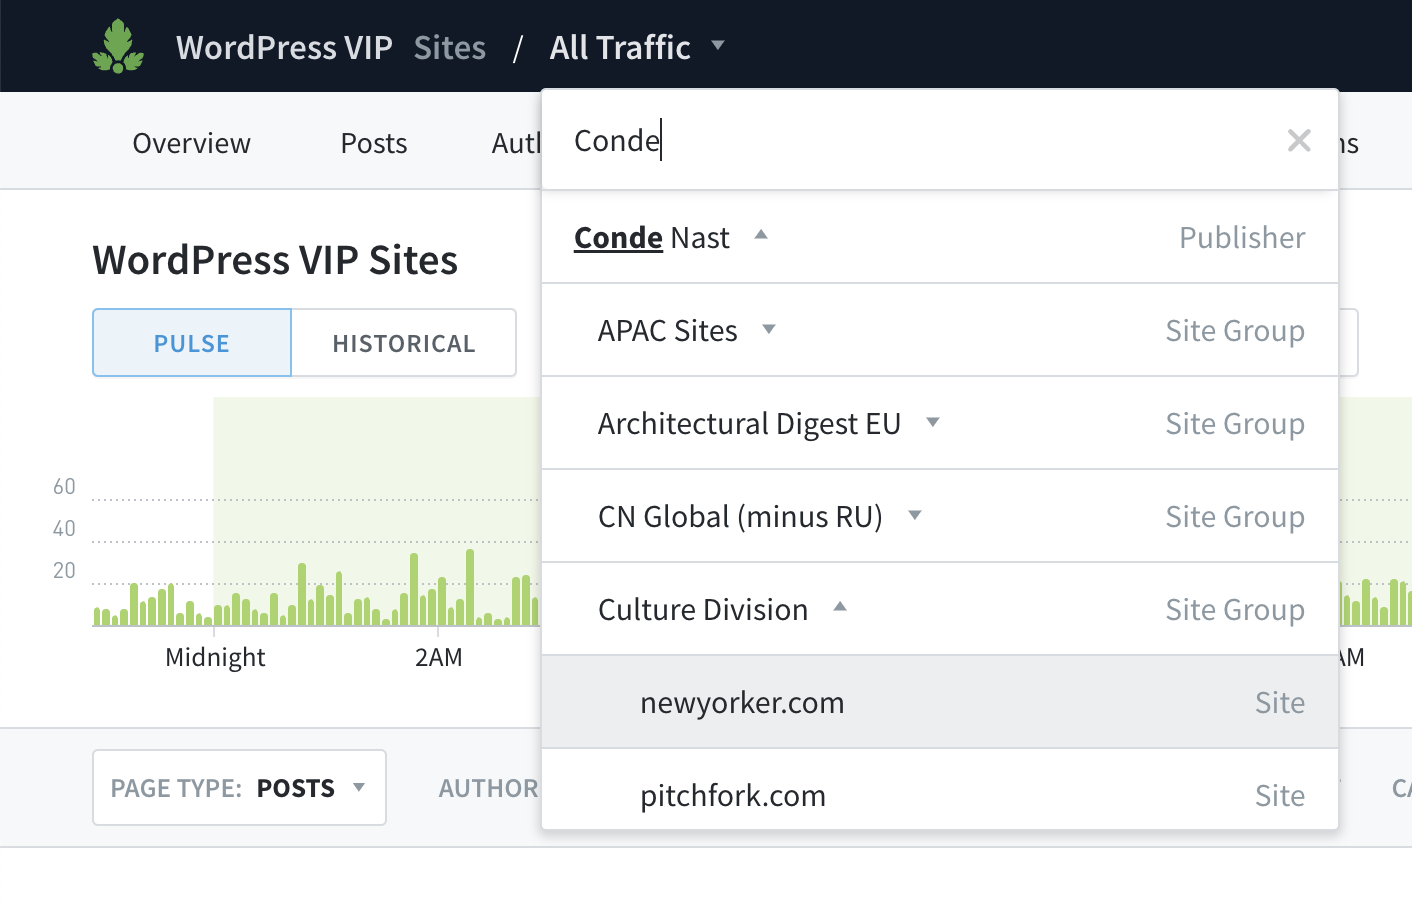
See dips and bumps in traffic across the whole network, instead of just one site
- Click the Site ID selector in the top bar
- Select one of the Site Groups or Network rollups
Content Distribution
Identify content that should be syndicated
Use Benchmarks and Alerts to identify top performing and trending content.
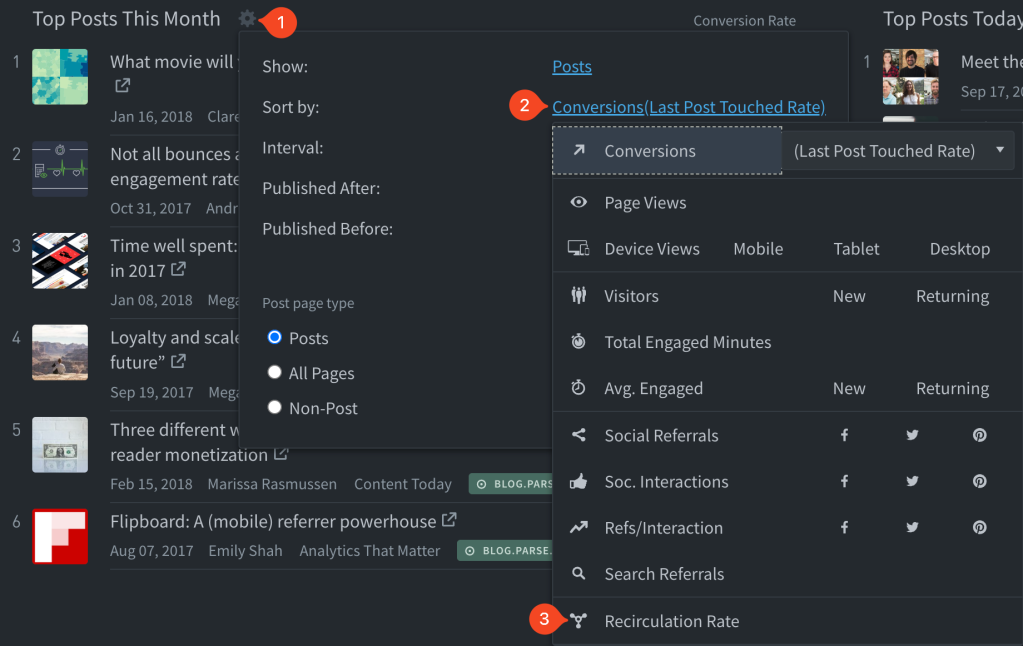
Identify content that converts at a higher rate
- Open your dashboard to the Overview screen
- Click the cog (⚙️) next to one of the listing columns
- Check that you’re displaying Posts
- Click the selected option for “Sort by:”
- Select Conversions
- Select “Rate”
- Click “Apply”


Identify content that keeps readers on our site
- Open your dashboard to the Overview and click the cog (⚙️) next to one of the listing columns
- Click the selected option for “Sort by:”
- Select Recirculation Rate
- WordPressVIP Users: Use Content Helper to identify top related posts for cross-linking.

The Overview
Improve your Overview screen experience?
Check out our Overview doc. There you will see how to apply filters and customize your settings. From there, you can do all sorts of things. Here are just a few ideas to add variety to the default setup.
Filtered views


Views from custom settings


Last updated: November 03, 2023