Post or Page Details
Clicking on a post or non-post will take you to a details page. Here, you can get a more granular look at data and high-level metrics for your content.
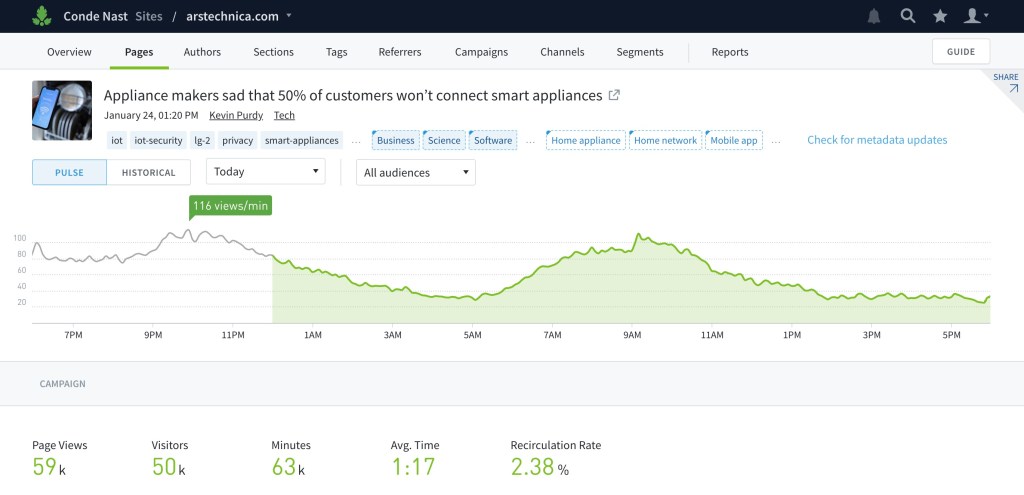
Post metadata
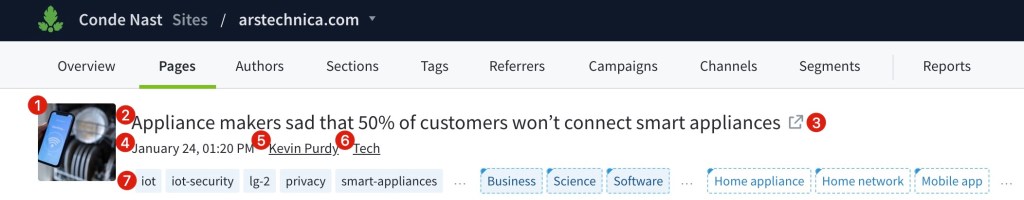
The top of a post details page contains the post’s:
- Image
- Title
- URL link
- Publish date
- Author
- Section
- Tags
Click on the author, the section, or a tag to see its details page.
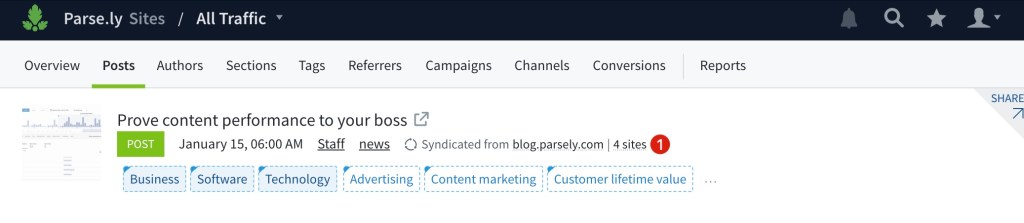
Posts within Dashboards utilizing network syndication also feature:
- Content syndication icon
Dashboards with video tracking enabled contain an additional tag in the metadata that designates the content type as a post or a video.


Real-time and historical data
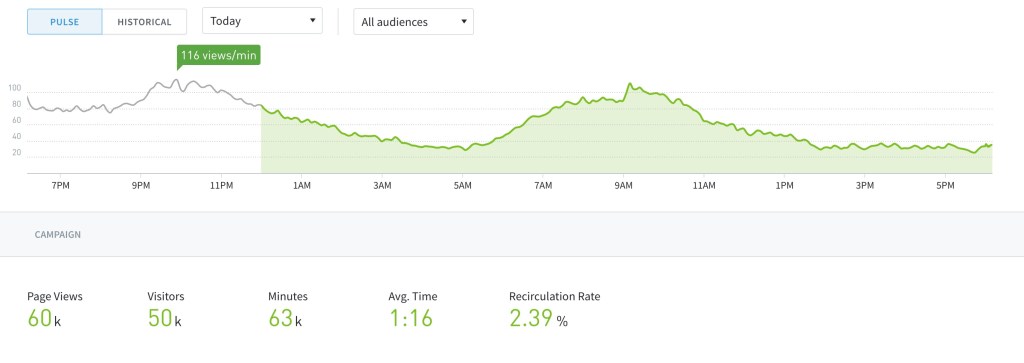
You can toggle the graph to show real-time (called “Pulse”) or historical data. Below the graph, you can view the number of page views, visitors, engaged minutes, the average engaged time for the selected time frame, and the recirculation rate.
Specify a time frame for real-time data
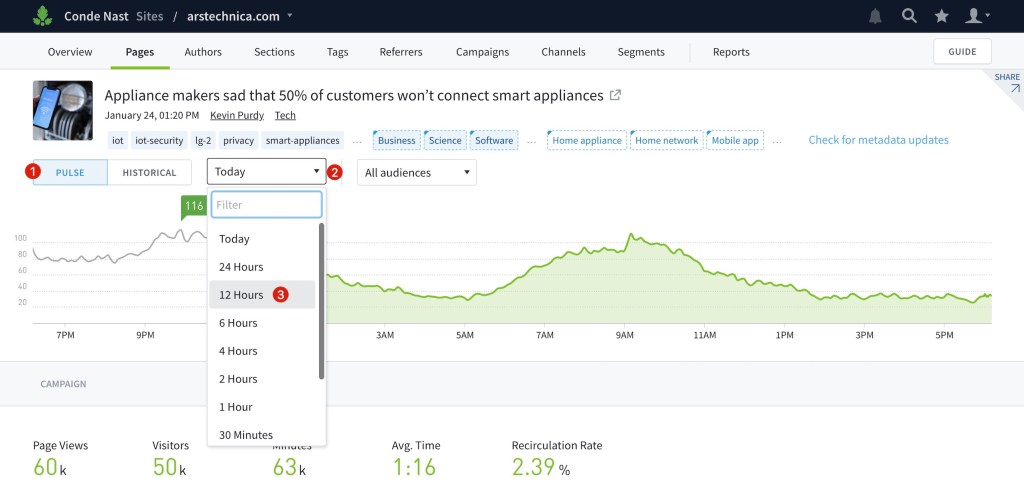
- Click Pulse.
- Click the dropdown.
- Select the timeframe.
Real-time data helps you identify popular content the moment it takes off. The Pulse line graph shows page views per minute.
Specify a time frame for historical data
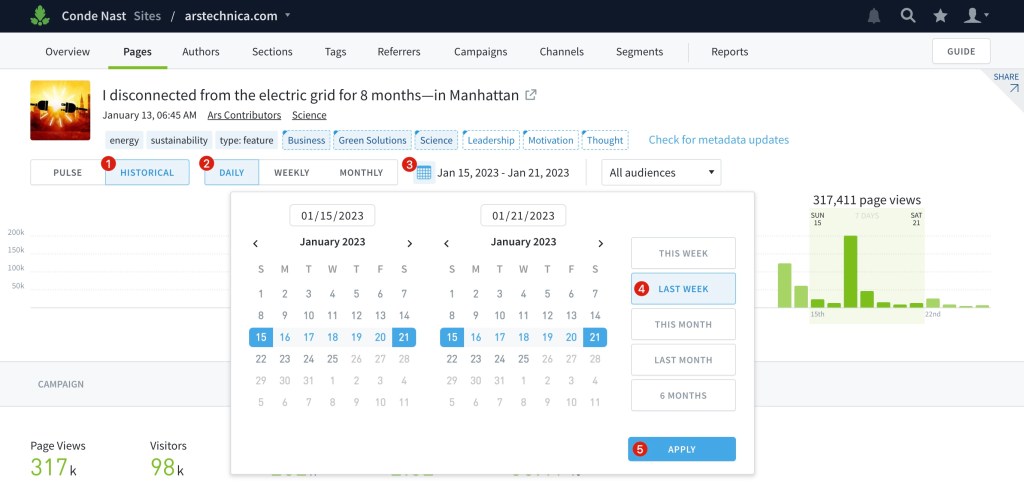
- Click Historical.
- Click Daily, Weekly, or Monthly.
- If you have chosen Daily, click on the calendar icon.
- Use the calendar or click one of the preset ranges to specify a date.
- Click Apply.
Note that data collection begins when the initial page view is fired after publication, and historical data is only visible up to your contractual retention limit.
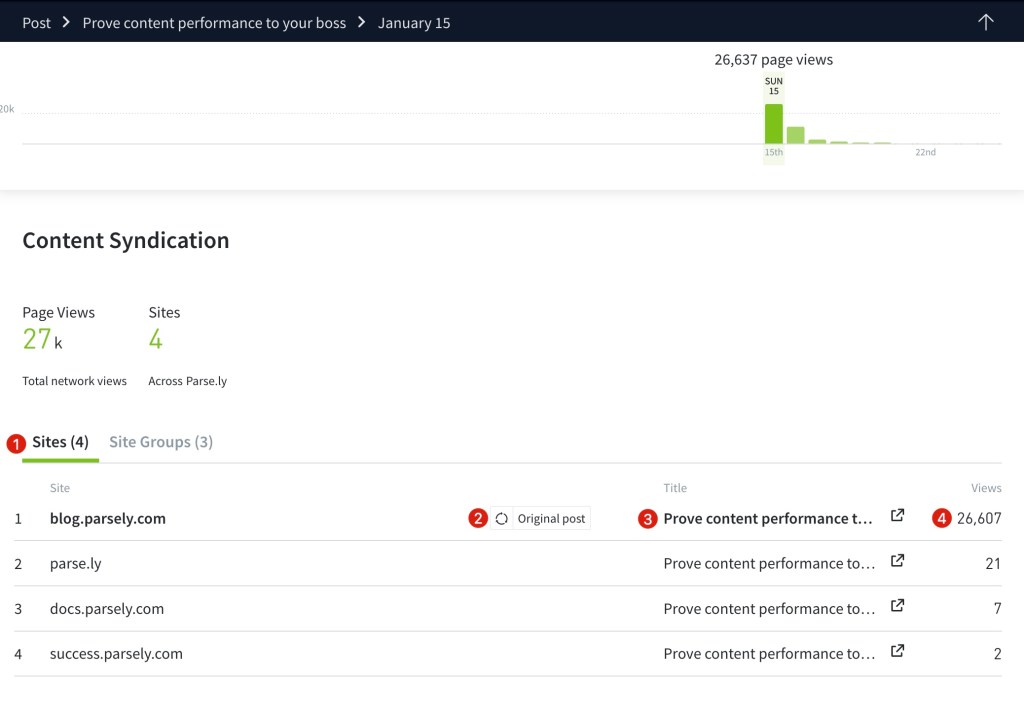
Content Syndication
This section applies to posts that utilize network syndication. It shows:
- List of sites or site groups (when applicable) where the syndicated content appears
- Original post
- Title
- Page views
Channels
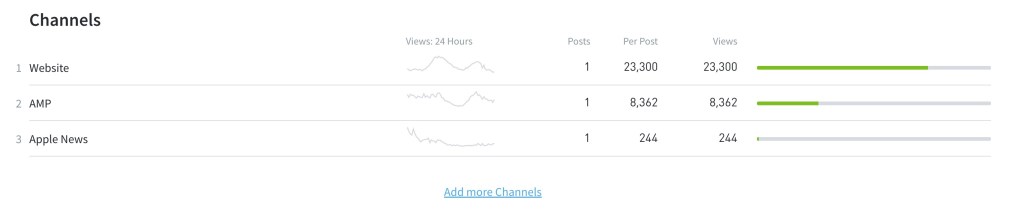
This section shows traffic breakdown by channel: Website, AMP, Facebook Instant Articles, Apple News, Native iOS, and Native Android.
Videos played on this page
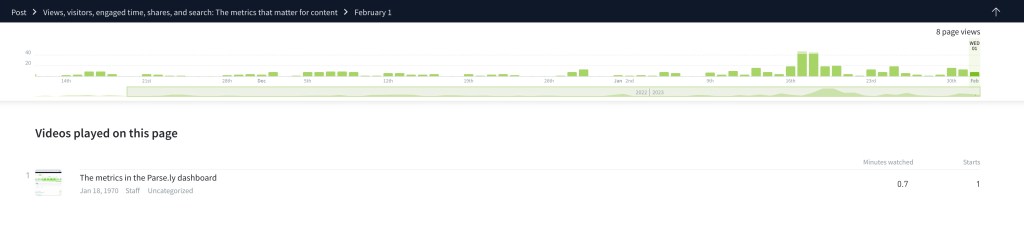
Any videos associated with the post will appear in this section, along with the total minutes watched and total starts. Click on the video’s title, author, section, or a tag to see its details page. Read more about Parse.ly Video Tracking.
Referrers
The Referrers section is a great resource to measure the effectiveness of social media or search engine optimization efforts or to find audiences that are discussing your content.
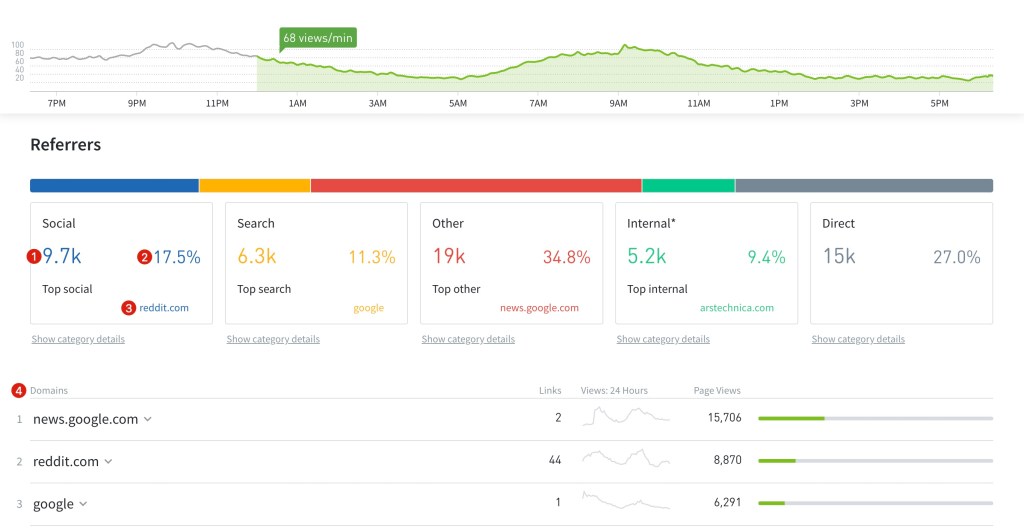
Clicking on a referrer type shows
- Page views
- The percent of total page views
- The top domain from that referrer
- A list of domains from that referrer
Campaigns
The Campaigns section surfaces information that’s been added to the URL of the post with campaign parameters (or tracking codes) like UTM parameters.
See details about a specific campaign
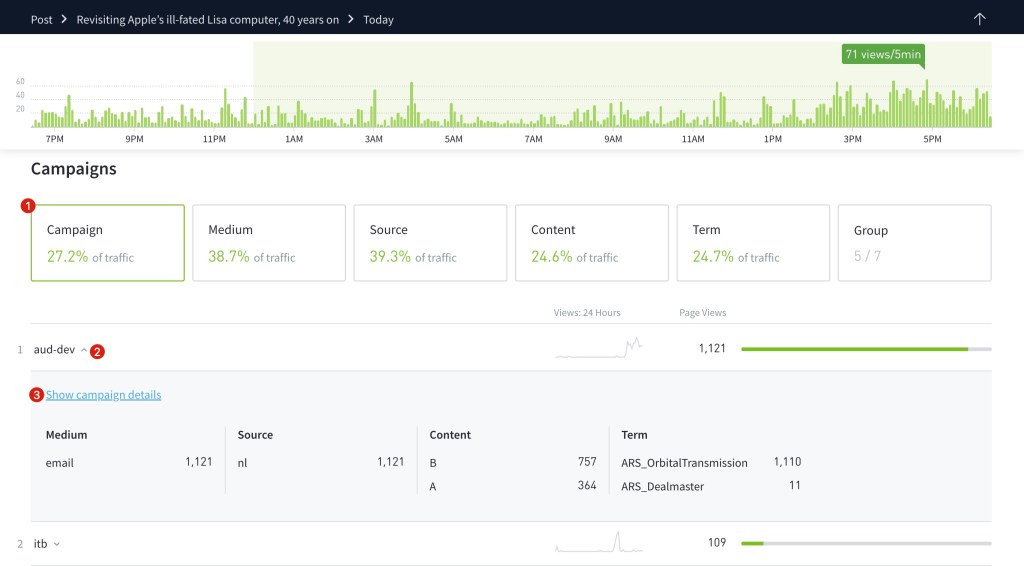
- Click a campaign aspect (Campaign, Medium, Source, Content, or Term).
- Click the carrot to see a preview of the campaign’s details.
- Click the link to go to that campaign’s details page.
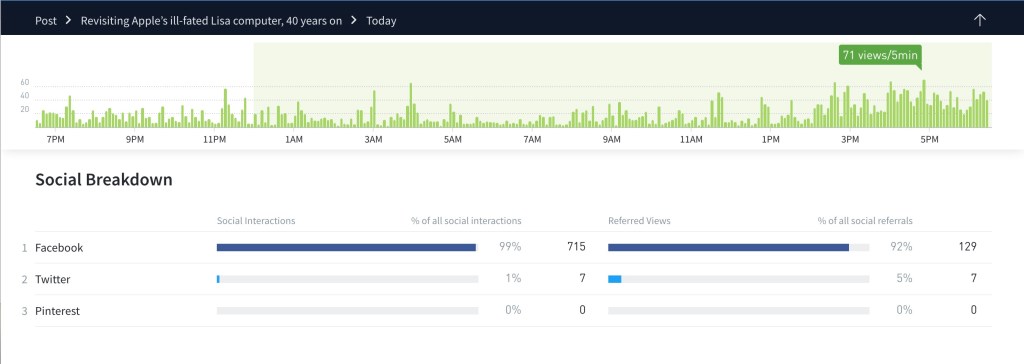
Breakdowns
This section splits out traffic across social media, new and returning visitors, and devices.
Social Breakdown shows the interactions and page views attributed to Facebook, Twitter, and Pinterest.
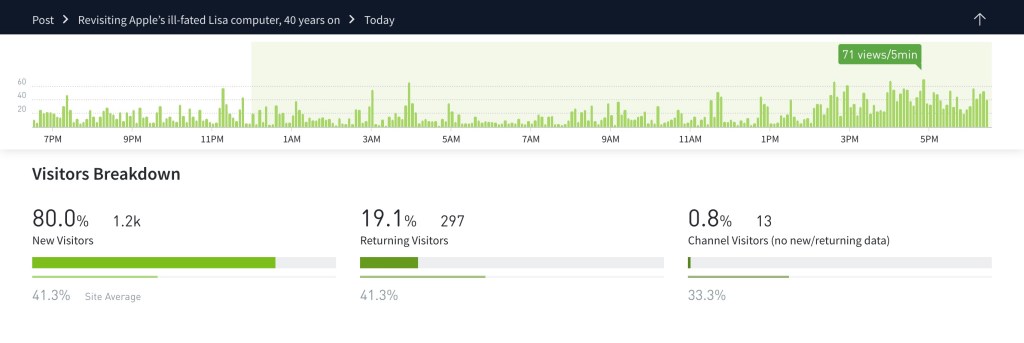
Visitor Breakdown shows how many new and returning visitors viewed a post.
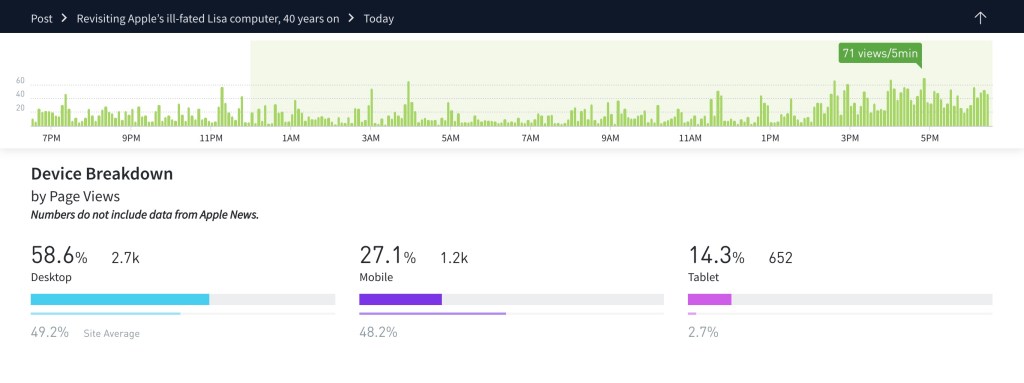
Device Breakdown shows what device type people use to consume your content. The page views and traffic percentage are separated into desktop, mobile, and tablet. The site average is shown below each device for comparison.
Pages
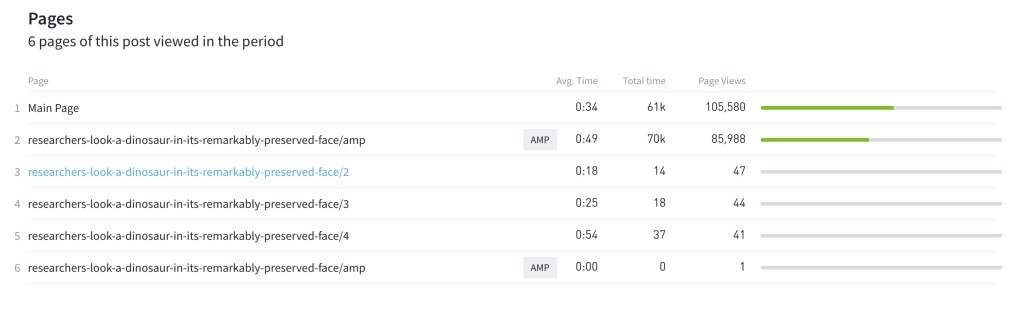
This section shows the breakdown of traffic for content with the same Parse.ly canonical URL. Examples of content where data will appear in this section include multi-page articles or slide galleries where dynamic tracking was implemented to track individual image views.
Activity after viewing this post
This section shows what posts or pages your visitors viewed next.
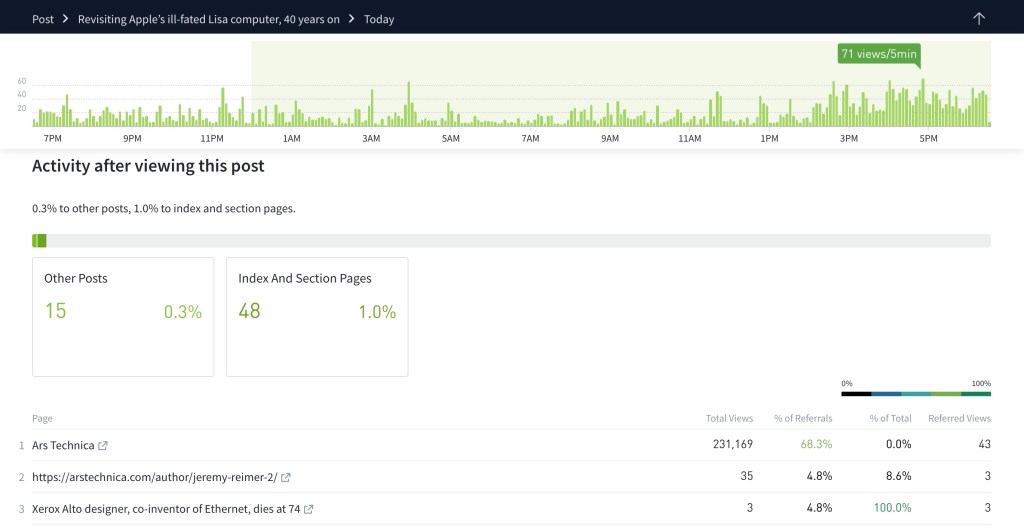
This section lists Pages in order of the number of views that the current page has referred to them. This is represented as “Referred Views” in the above graph. The full description of each metric is as follows:
- Total Views: The referred page’s total page view count
- % of Referrals: Percent share of the current page’s referred views
- % of Total: Percent share of the referred page’s views attributed to the current page
- Referred Views: Count of page views referred by the current page
If you have a linking strategy in place, you can use this data as a scorecard to see if viewers are actually clicking on what you want them to. You can also use Parse.ly’s API to test which posts drive the highest percentage of traffic to other posts.
Last updated: June 03, 2024