Update to converting visitor and converting visitor rate
Conversions are viewable in a number of ways, and we’ve introduced several new ones with this update.
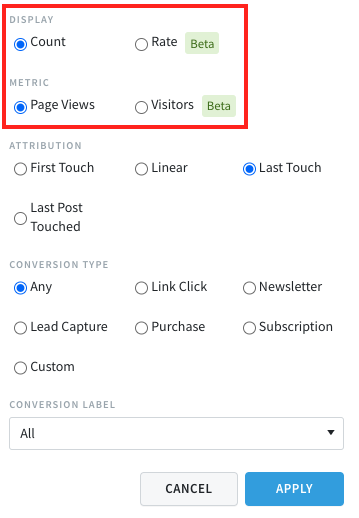
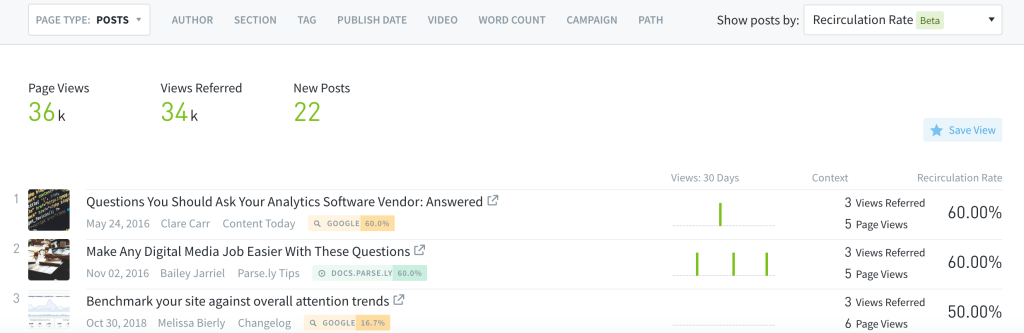
The Conversions Count is the sheer volume number of how many conversions happened for the content you are viewing. The Conversions Rate is what % of those page views converted.
What’s new in this update is that we are introducing Visitors as a metric for Conversions Count and Conversions Rate. Previously, it was calculated via Page Views. Now you can select between either Page Views or Visitors.
Converting Visitors is available everywhere you can see Conversions, and Converting Visitor Rate is available everywhere you can see conversion rates.
It’s important to know how effective your content is at converting visitors. Of course, posts with a high number of page views are likely to get the highest number of conversions. But what about those lower traffic posts which are converting at a higher rate? Conversion rates can help you identify those high-value pages. Learn more about this new feature here.
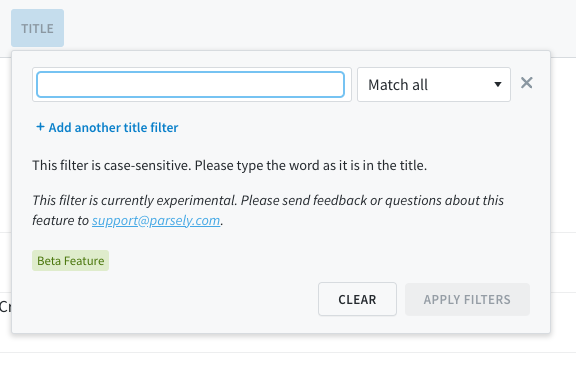
Filter posts by words in the title
You can now filter your posts by a single word or multiple words in a title. Use this to exclude posts with certain title words, or to focus on posts with certain words in the title. Level up your filtering by then creating a Saved View you can refer to in the future.
We are discontinuing Twitter social interaction counts
Starting on April 30, 2023, social interaction counts for Twitter and tweet cards will no longer be available in Parse.ly Analytics. This will notaffect referrer analytics for Twitter.
Parse.ly dashboard users can now print and save to PDF any view in their dashboard, making it faster and easier to create and share reports with teams and leadership. Read our blog post and knowledge base article to learn more.
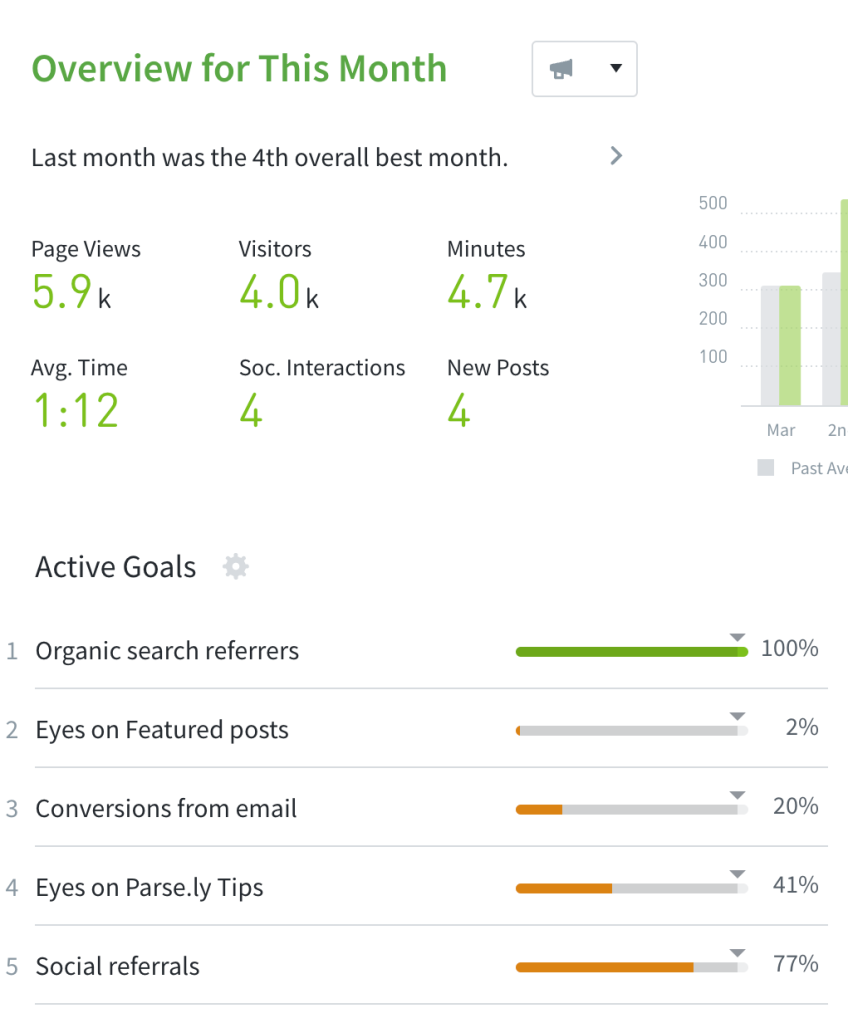
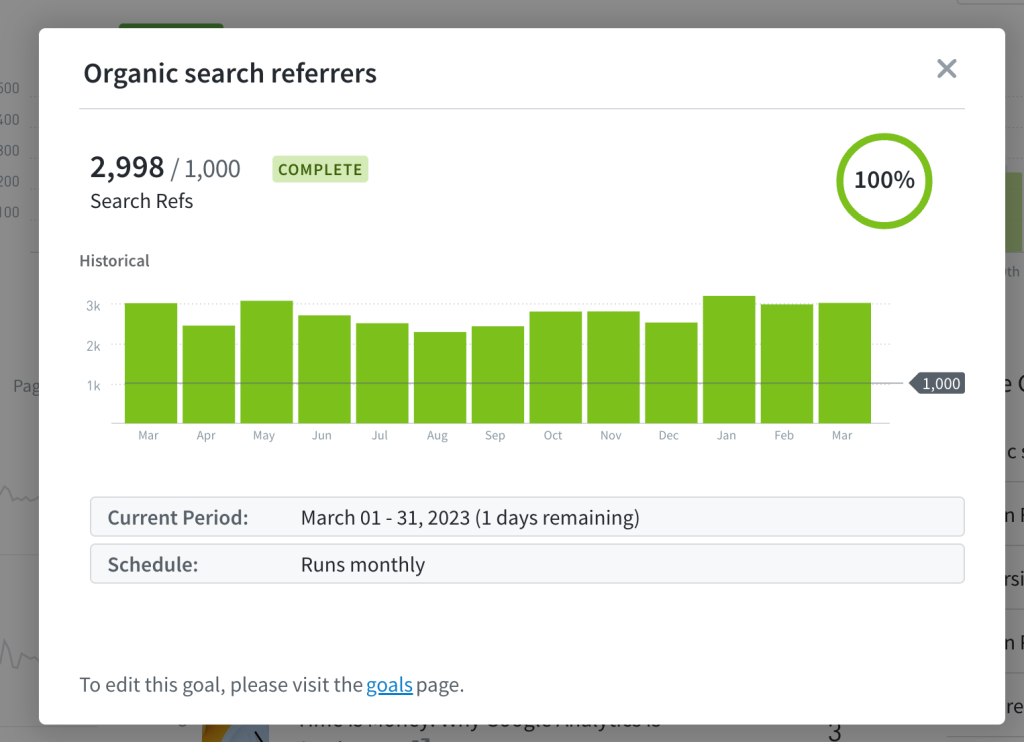
Add goals to your Overview
See how your Goals are performing directly on the dashboard! Goals is now an option you can add to the Overview screen.
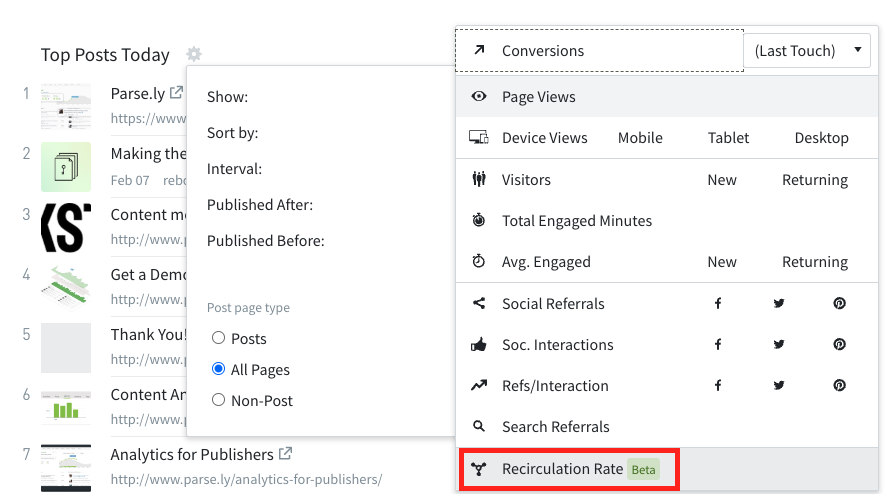
We added recirculation metric as an option on the Overview page, currently available for posts only (which includes both posts and pages). We also updated the tooltip to provide a better explanation of the rate displayed.
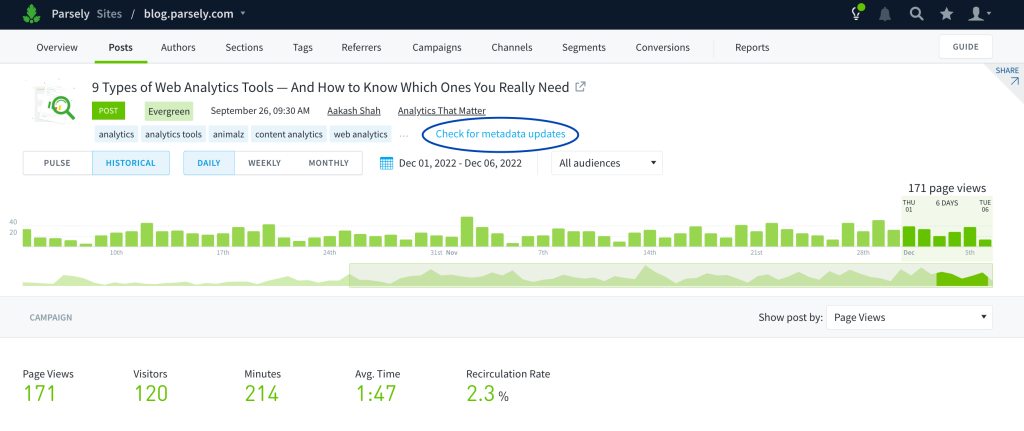
Use this feature to check for metadata updates on individual pages that look outdated to you in your Parse.ly dashboard. Learn more in our help documentation. This is now available to everyone with a Parse.ly dashboard.
Thanks to a ton of cutting-edge work in our machine learning, now our content recommendations are more accurate, allowing you to deliver even more engaging and accurate experiences to your readers. This release is a new API endpoint, so it’s not visible in the Parse.ly dash, but accessible via calls to our API. Learn more here.
Update: Export button for Campaigns
You can now export data on the Campaigns listing page.
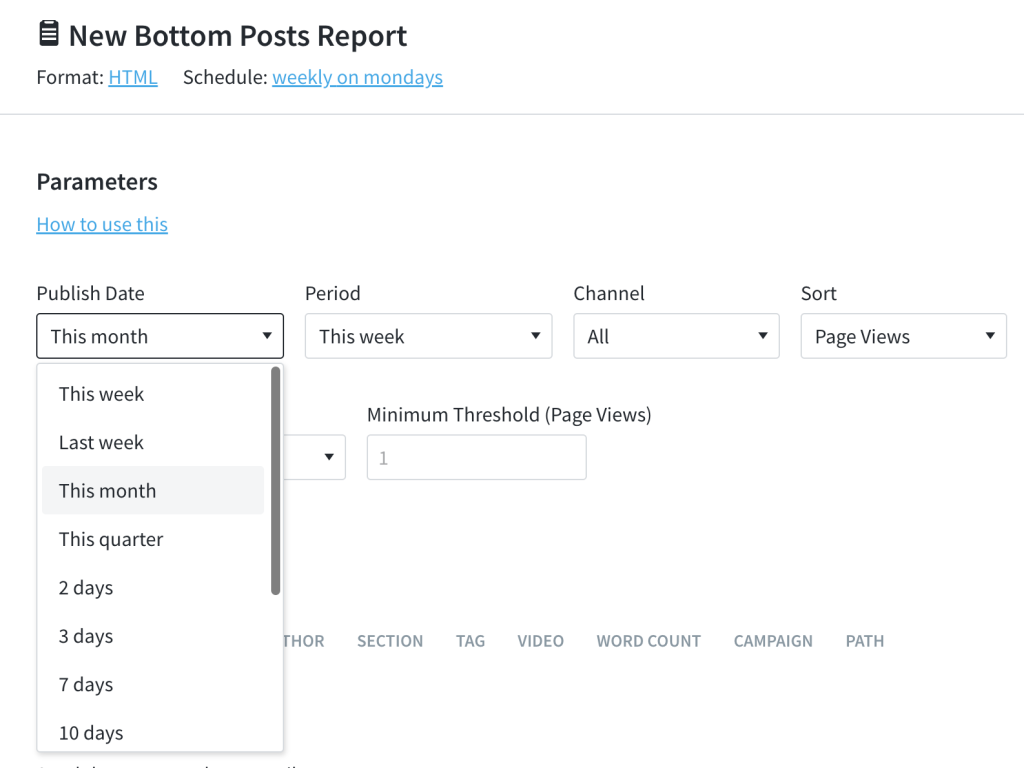
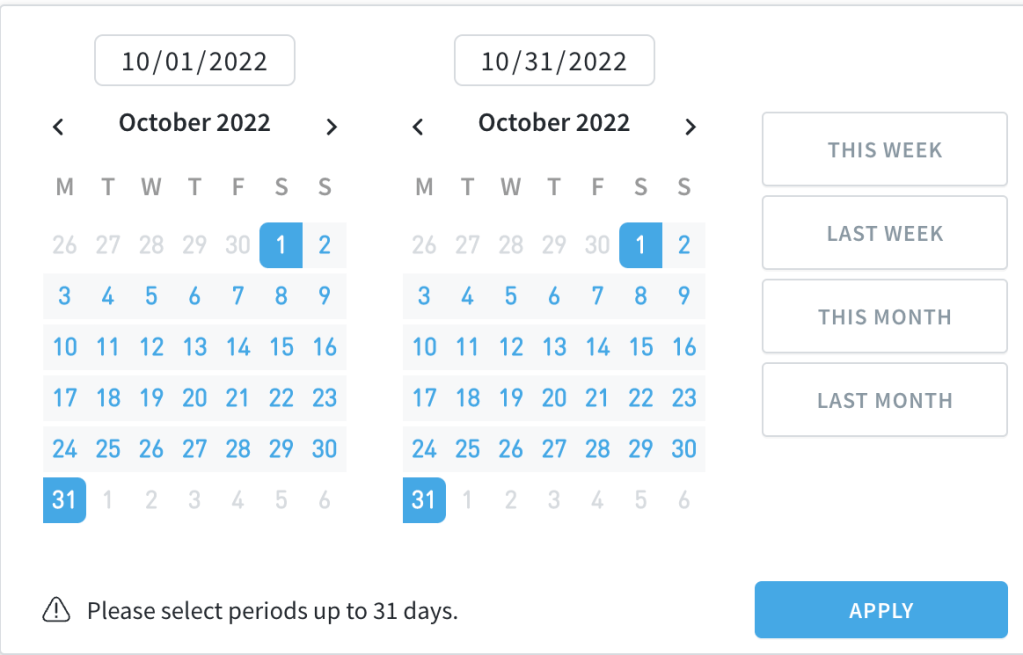
Update: Bottom Listings Report – increased flexibility for selecting dates
When choosing the publish date, you are now able to select any period of time, up to 31 days.
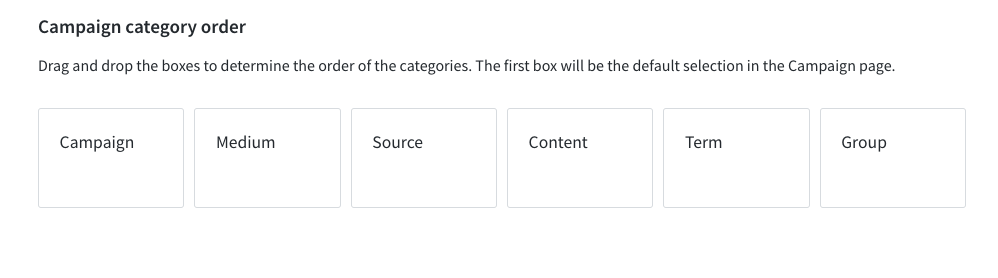
We now have a preference that allows you to set the order of the campaign elements displayed on your dashboard’s Campaigns page. From the Preferences page, simply drag and drop the boxes representing each campaign category to determine the order. Setting this preference will apply for all users.