Bug Fixes:
- Conversion type filter not filtering by type on conversions listing.
- Dash error on videos when selecting average watched.
- Date conversion on compare over time report causing some reports to fail.
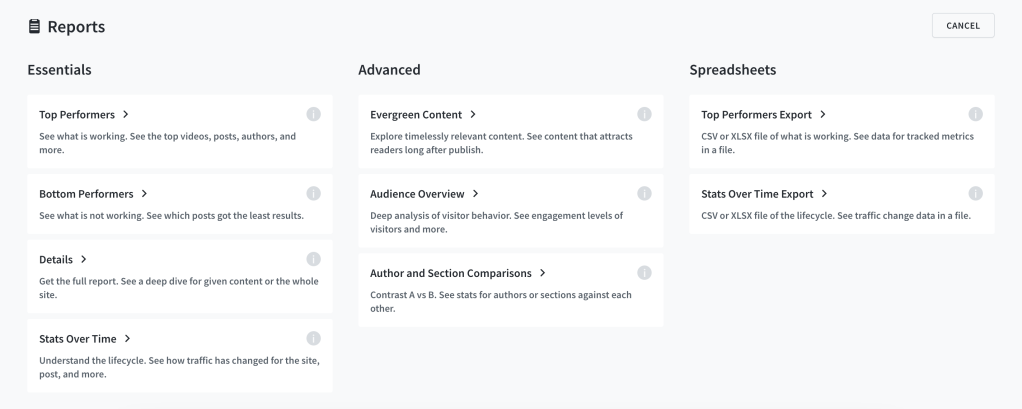
We’ve updated the layout and report descriptions for the ‘create report’ view to enhance clarity before clicking. The category label ‘Basic’ has been changed to ‘Essentials’, and sample reports linked to specific reports have also been updated.
Effective today, we will no longer display Twitter shares and Twitter average referrals in Parse.ly analytics. This change also applies to any scheduled reports containing Tweets/Twitter Interactions. Twitter referral data will remain available in all other areas. This is related to work we began last spring. Read our blog post to learn more.
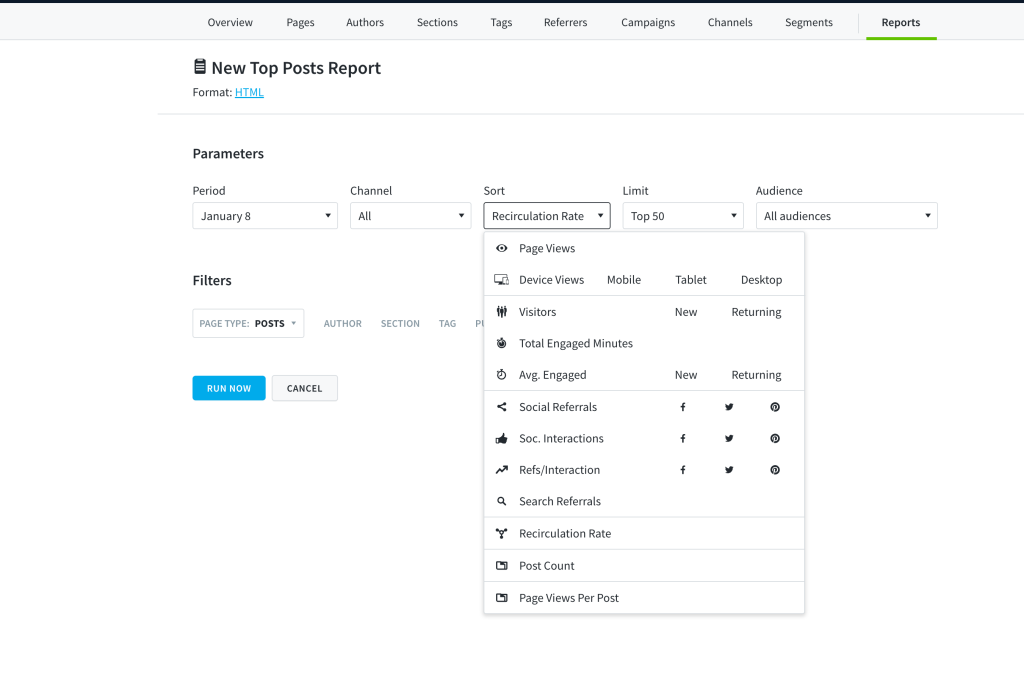
Recirculation rate is now available as a sorting metric in the Top Listings Report. You will see it in the dropdown menu for metrics when you create or update a Top Listings report that tracks posts.
With the ability to apply filters to your Overview page, you can now get at-a-glance performance updates for specific authors, sections, tags, word counts, or campaigns. The filter includes the options to “match any”, “match all”, or “exclude”.
To access this, click on the cog icon, and then you’ll see the option to add filters.
Watch the video below to see this new feature in action!
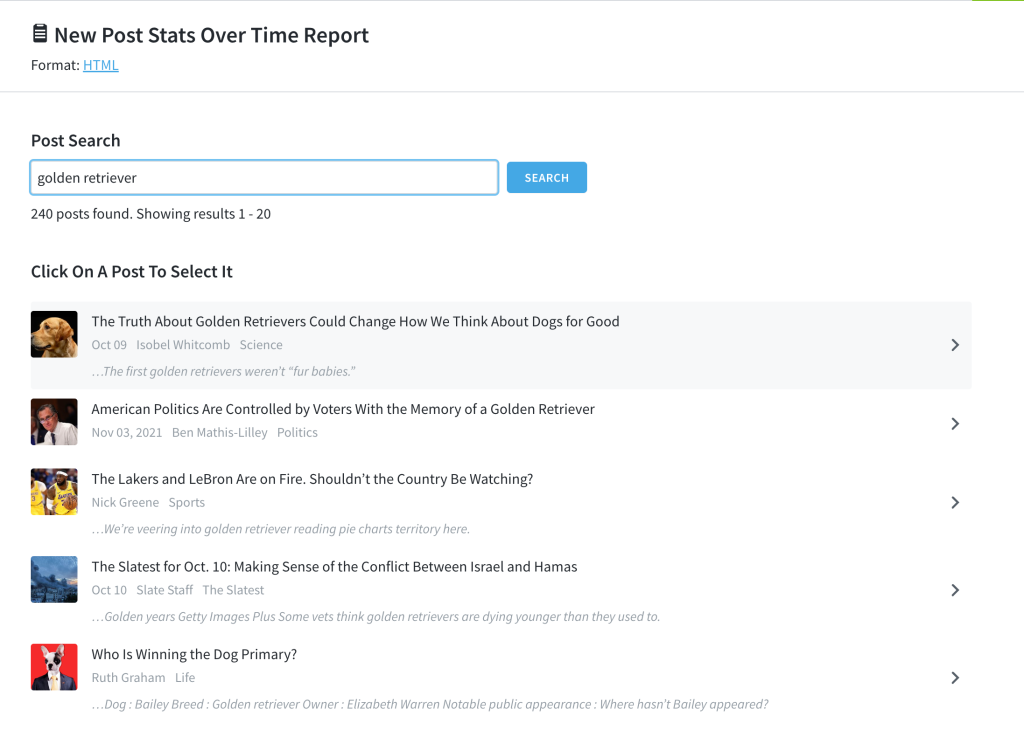
We added a Posts option to the Stats Over Time report so that you can run one-off or recurring reports for individual articles that you care about.
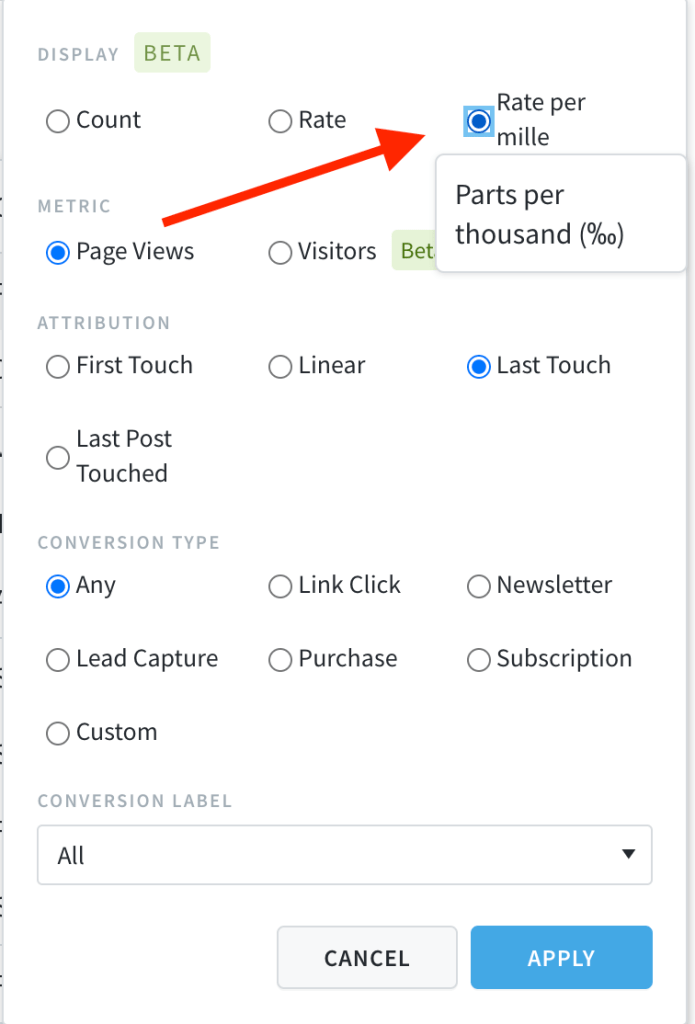
We added a per mille option to the conversion metric dropdown. This calculates the rate per-mille (per 1000 parts) instead of the default percent (per 100 parts). This can be used anywhere the conversion rate is also applied.
With Parse.ly, you can see not only which page someone visited on your site before completing a conversion event (newsletter signup, clicking an affiliate link, etc.) but also which piece of content (“post”) they read before completing that conversion event. Learn more about Parse.ly conversions here.
With this release, you can now also see which post was last touched across your entire network of sites, instead of just individual sites. If you operate a multi-site business, and use our conversions feature, start using this view today!
Read more about how to leverage last-post touched attribution here.
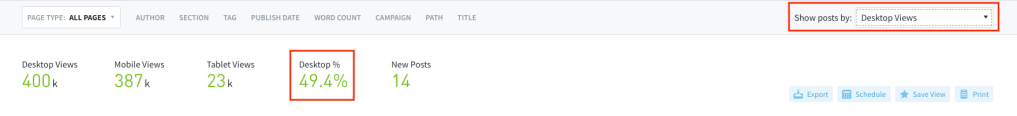
When looking at realtime analytics (“pulse” view), in addition to percentages for mobile and tablet views, we added desktop percentage views.
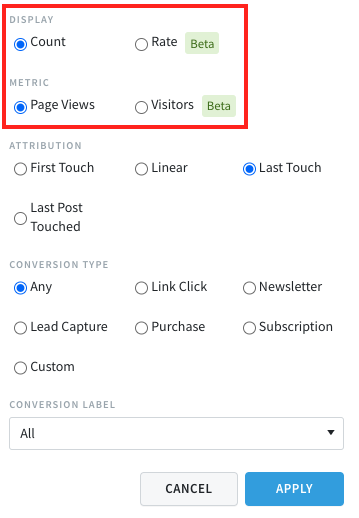
Conversions are viewable in a number of ways, and we’ve introduced several new ones with this update.
The Conversions Count is the sheer volume number of how many conversions happened for the content you are viewing. The Conversions Rate is what % of those page views converted.
What’s new in this update is that we are introducing Visitors as a metric for Conversions Count and Conversions Rate. Previously, it was calculated via Page Views. Now you can select between either Page Views or Visitors.
Converting Visitors is available everywhere you can see Conversions, and Converting Visitor Rate is available everywhere you can see conversion rates.
Last updated: November 12, 2025