Common Parse.ly Dashboard workflows
After integrating Parse.ly with your site, adjusting Parse.ly Dashboard preferences as needed, and granting user access to team members, several common workflows can help put Parse.ly’s data to work.
Track this week’s publications
The Dashboard’s default view of the Overview tab displays the performance of all content across your site. By following these steps, focus on how the content published this week is performing.
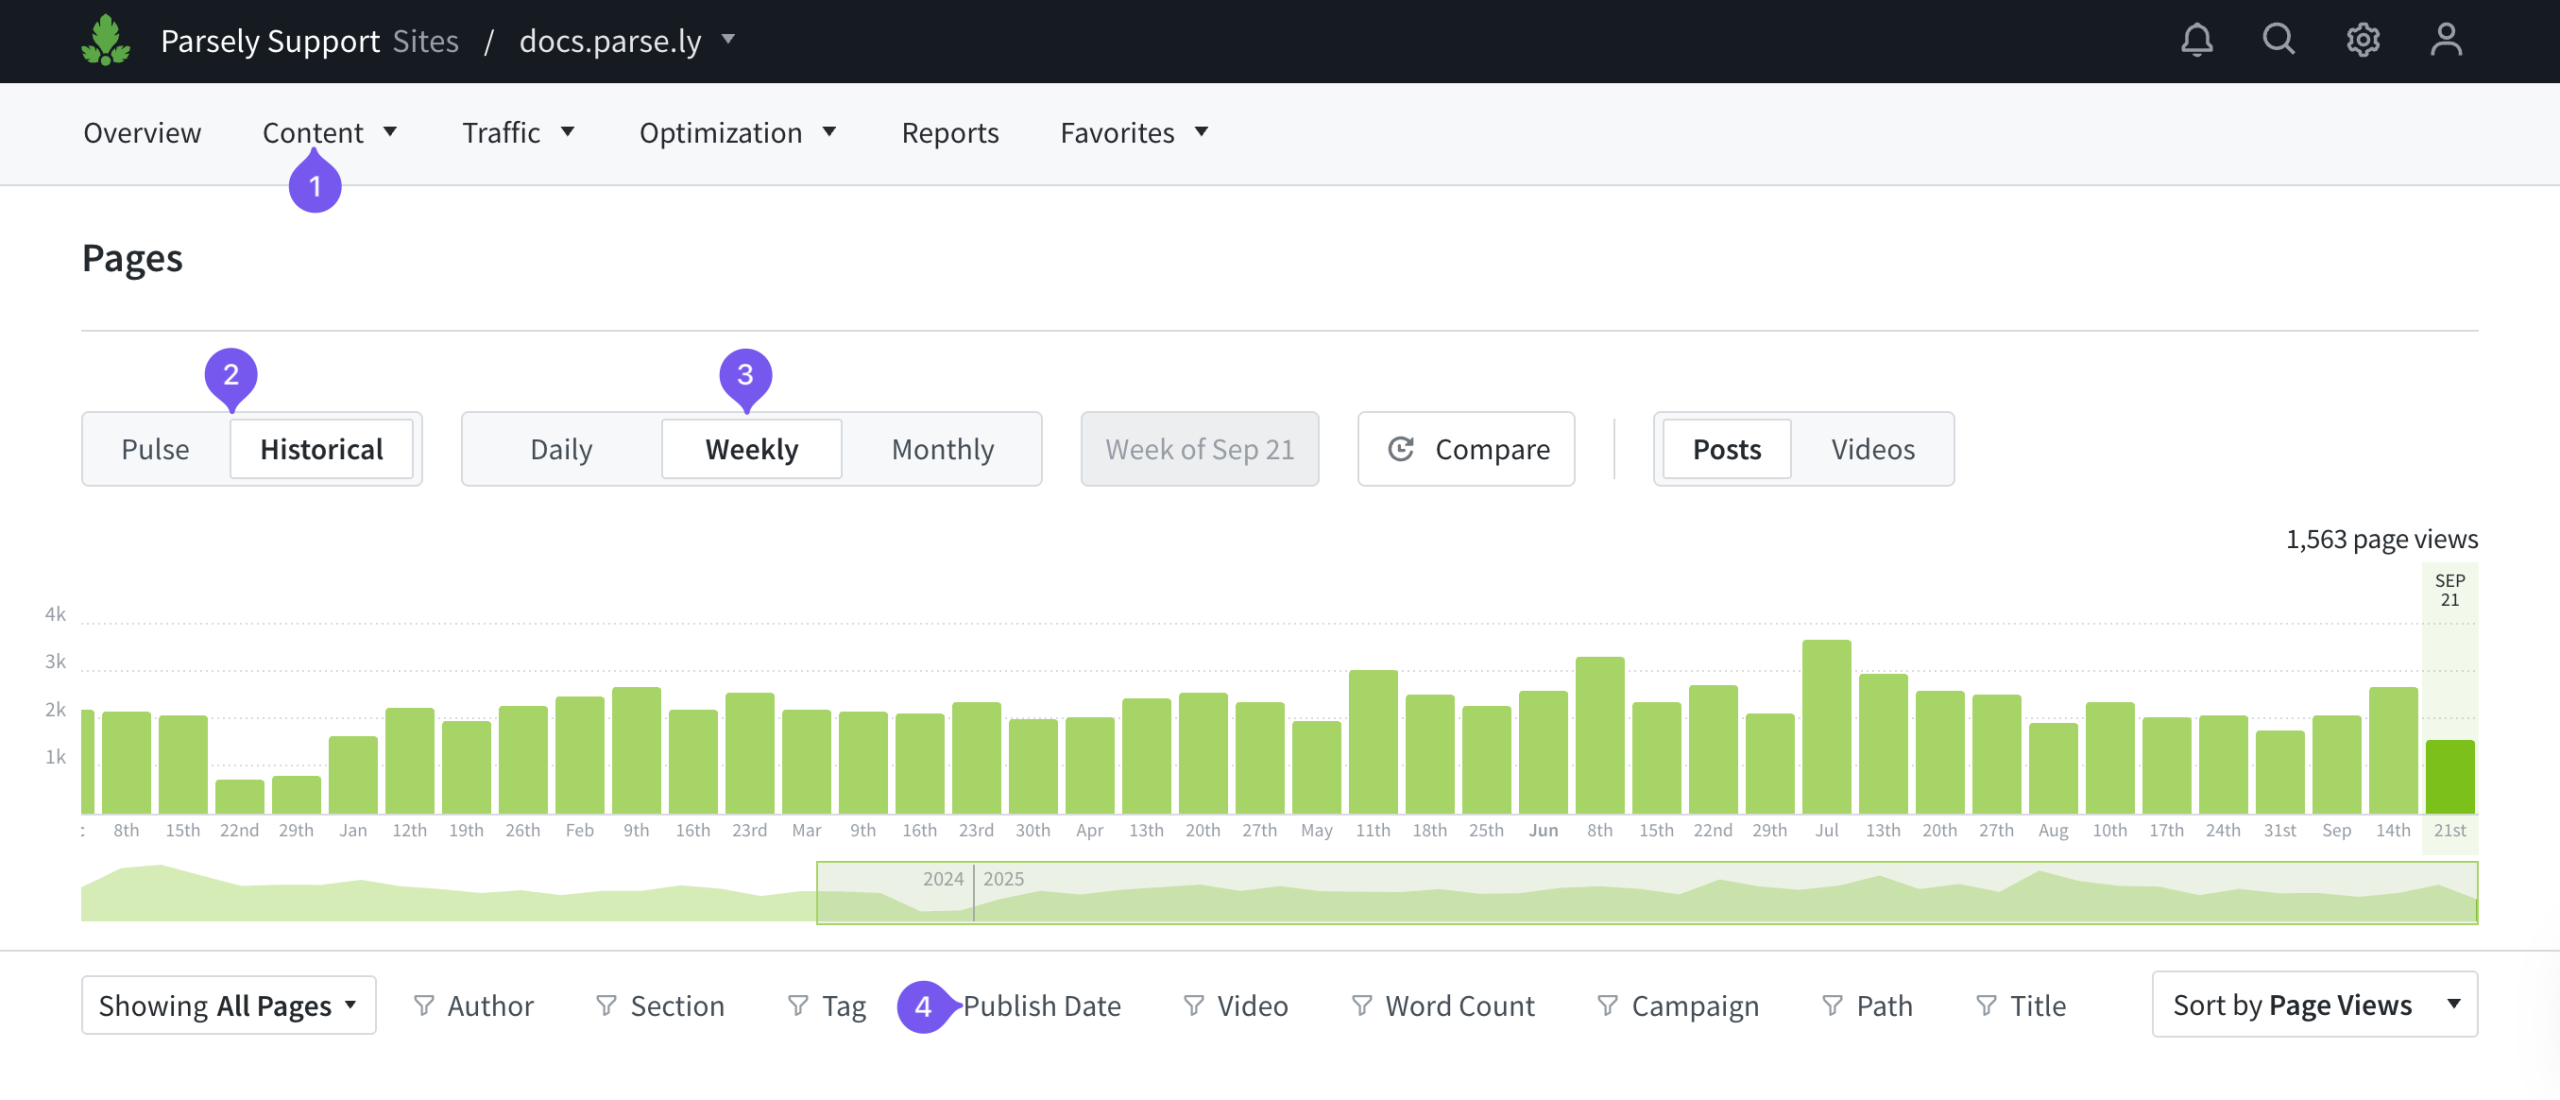
- Open a listings page, e.g., Posts/Pages, Authors, Sections, etc..
- Select the Historical view beneath the navigation bar.
- Select the “Weekly” time range preset.
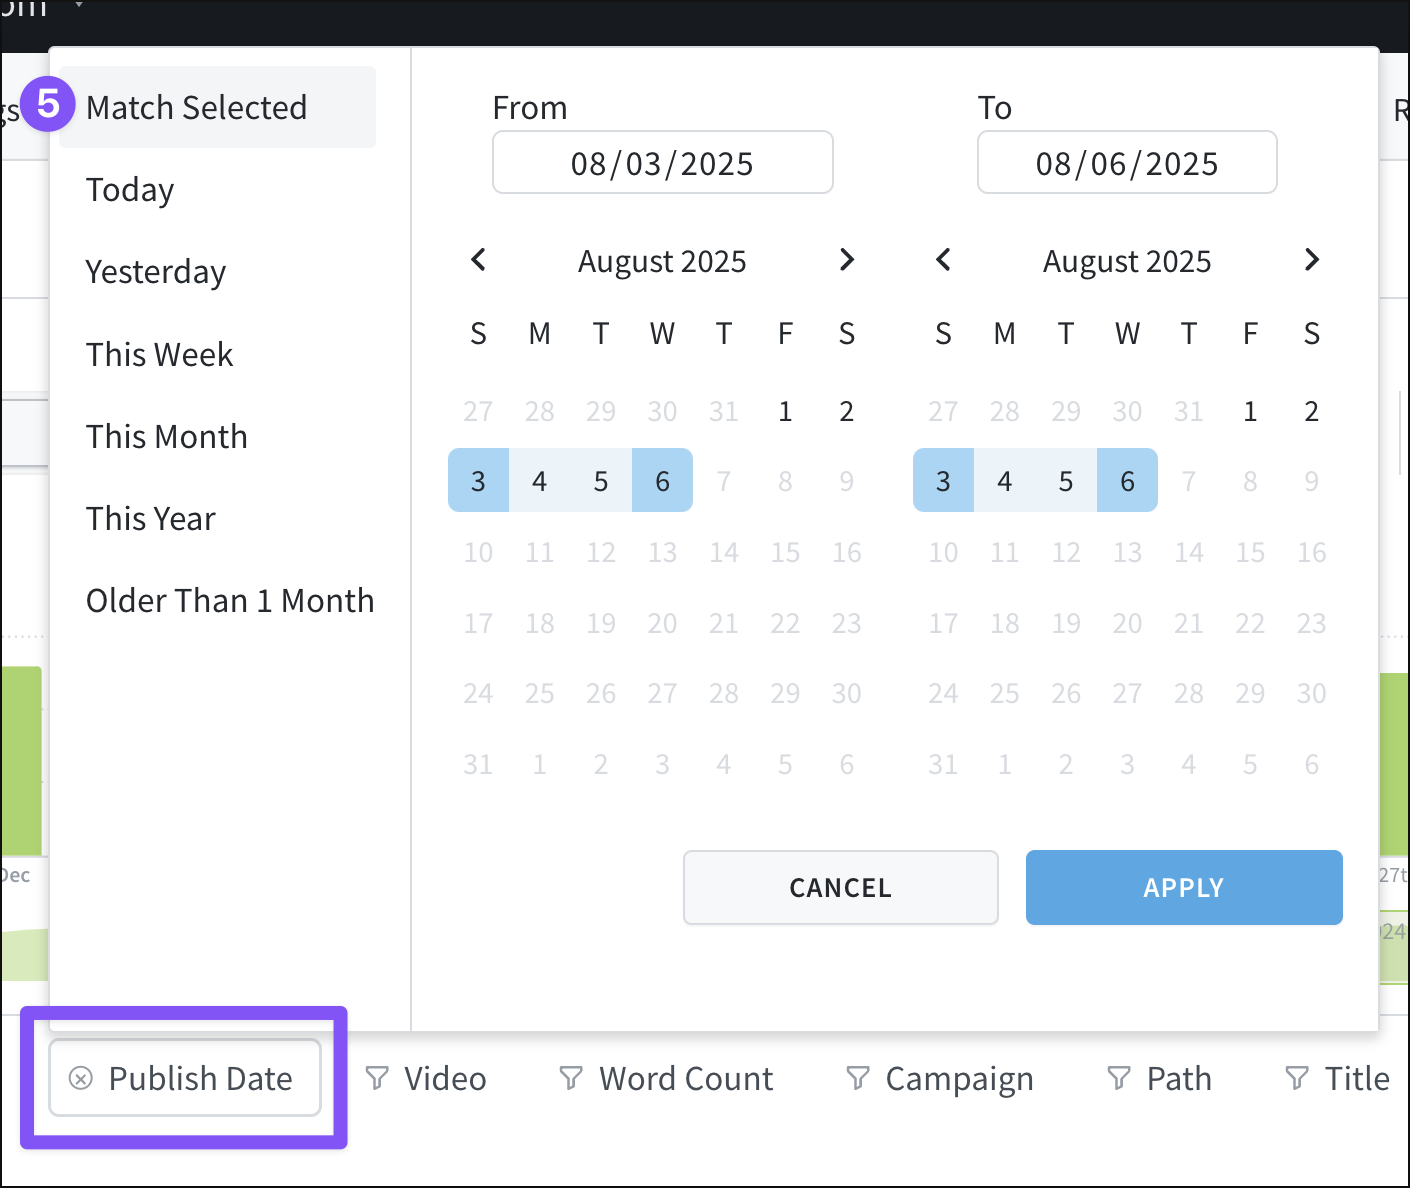
- Below the bar graph, select the Publish Date filter.
- Choose the “Match Selected” option to set the Publish Date filter to the current week.
Bring data to team meetings
Enrich discussions in meetings with team members with Parse.ly data. Create reports, such as the Top Performers or Bottom Performers reports, and review them with authors, content promoters, and others. Consider various metrics — low page views can be bolstered by other measurements of success, such as visitors, engaged minutes, recirculation rate, or conversion rate. There are various methods to share Parse.ly data, even with team members, freelancers, consultants, and others without Dashboard user access.
Set visible goals for the team
Account admins can create goals to get teams on the same page about desired results. From there, users can see details on active goals on the Goals page of the optimization menu, and each user can customize Overview to include up to 3 active goals.
View trends across the whole network
Use the Network Rollup view or site groups to analyze performance across multiple sites at once.
Identify content for syndication
Use Parse.ly’s alerts and benchmarks to identify top performing and trending content that would be an excellent fit for wider syndication.
Use Overview to quickly see high performers
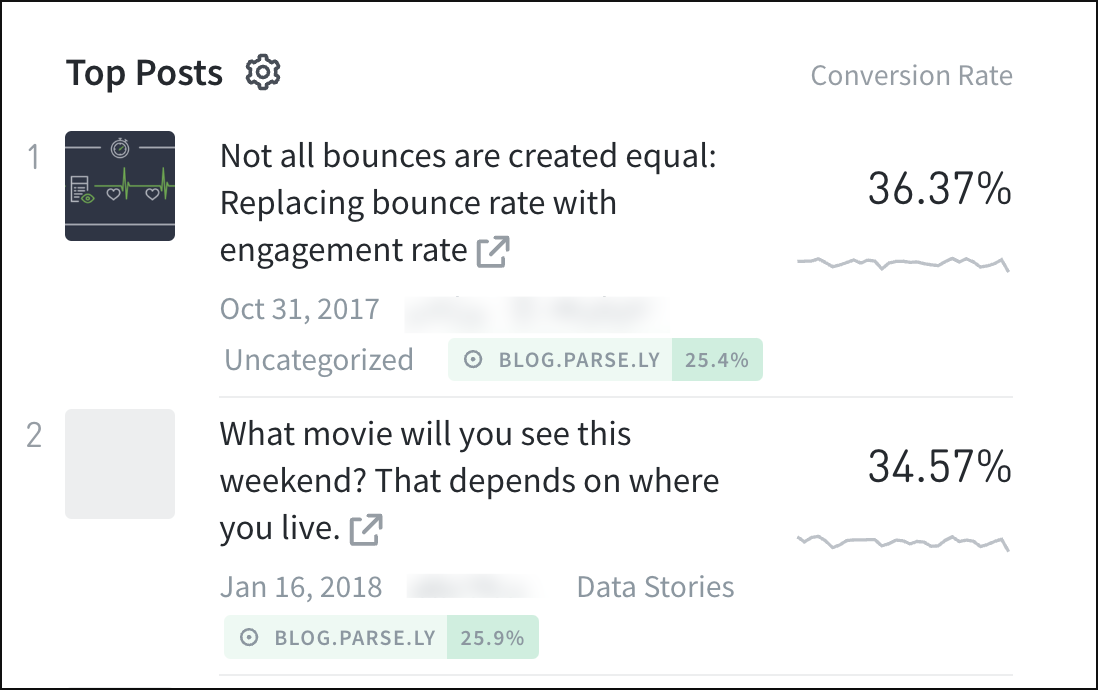
Adjust the setup of Overview to quickly see which posts are converting at the highest rate — or which posts keep visitors on your site — during a selected time period. To start on Overview, click the gear icon next to one of the listing columns to adjust its settings.
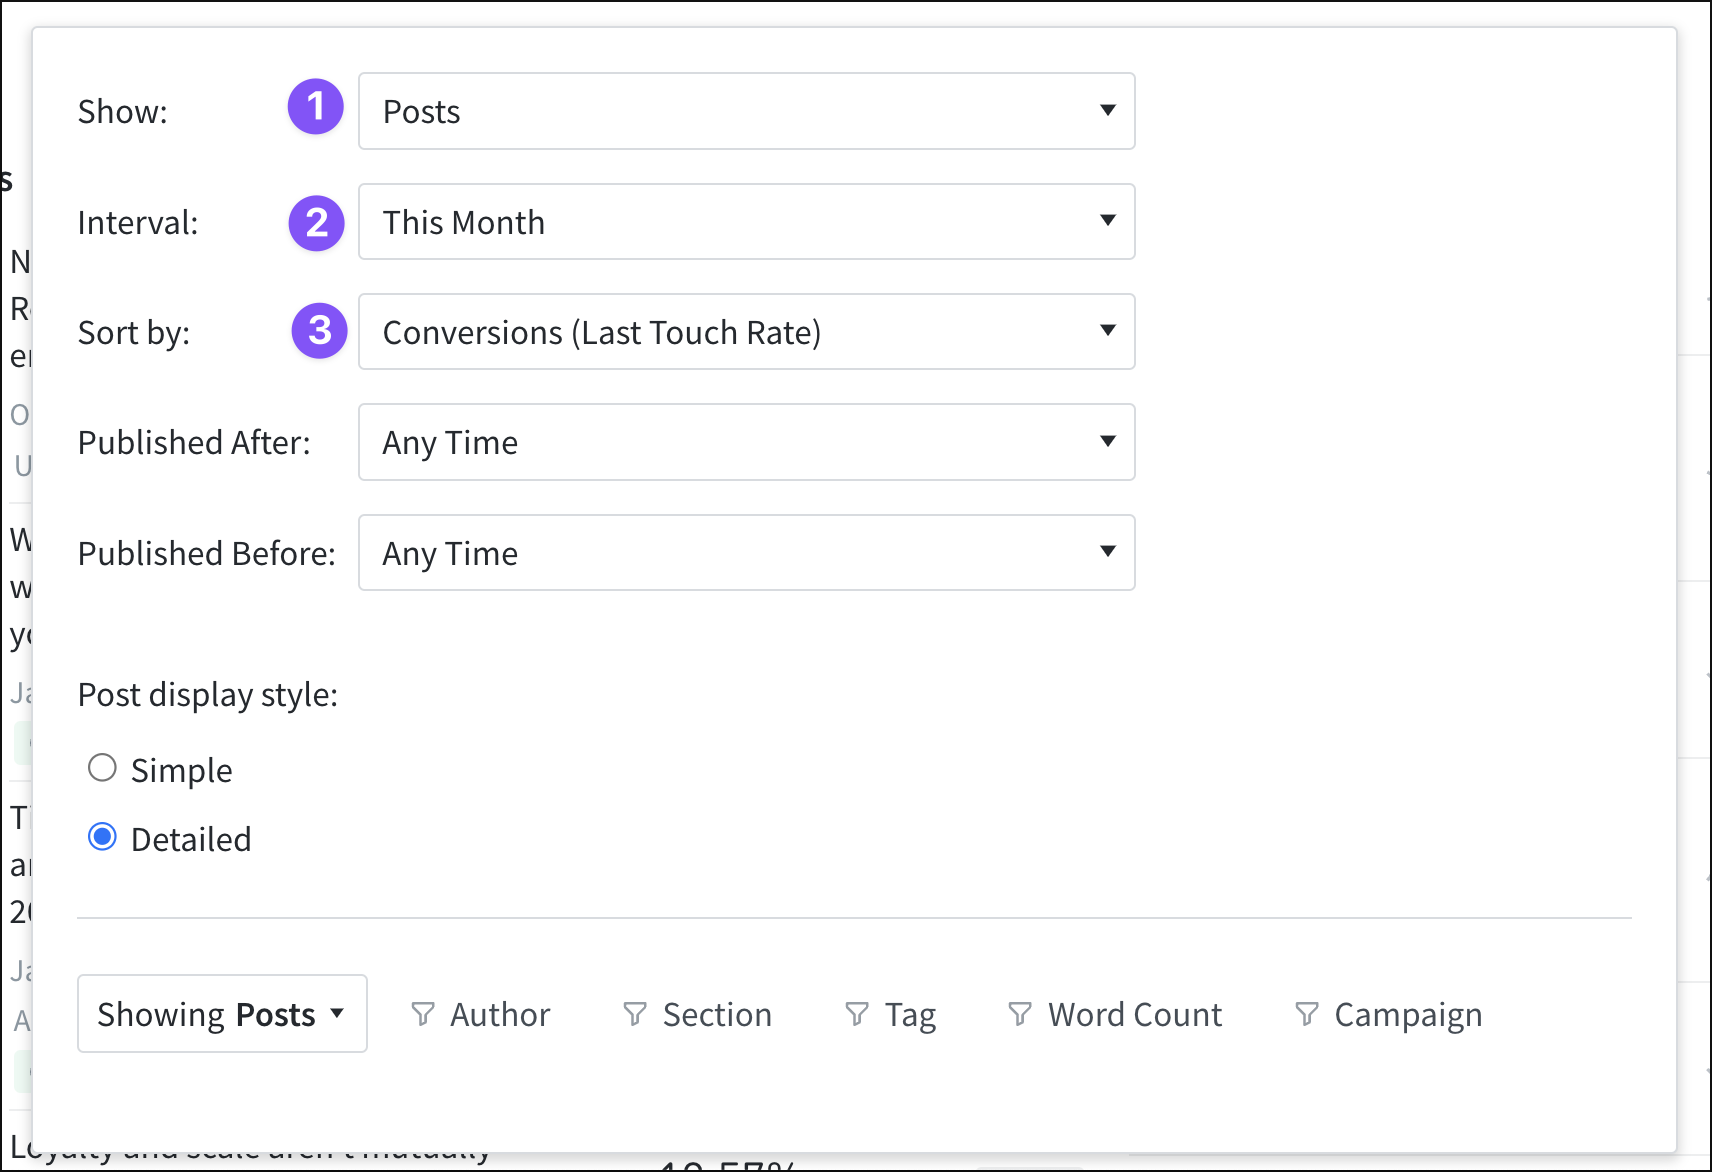
- In the pop-up window that opens, show Posts.
- Choose a desired time interval.
- Sort by Conversions or Recirculation Rate.
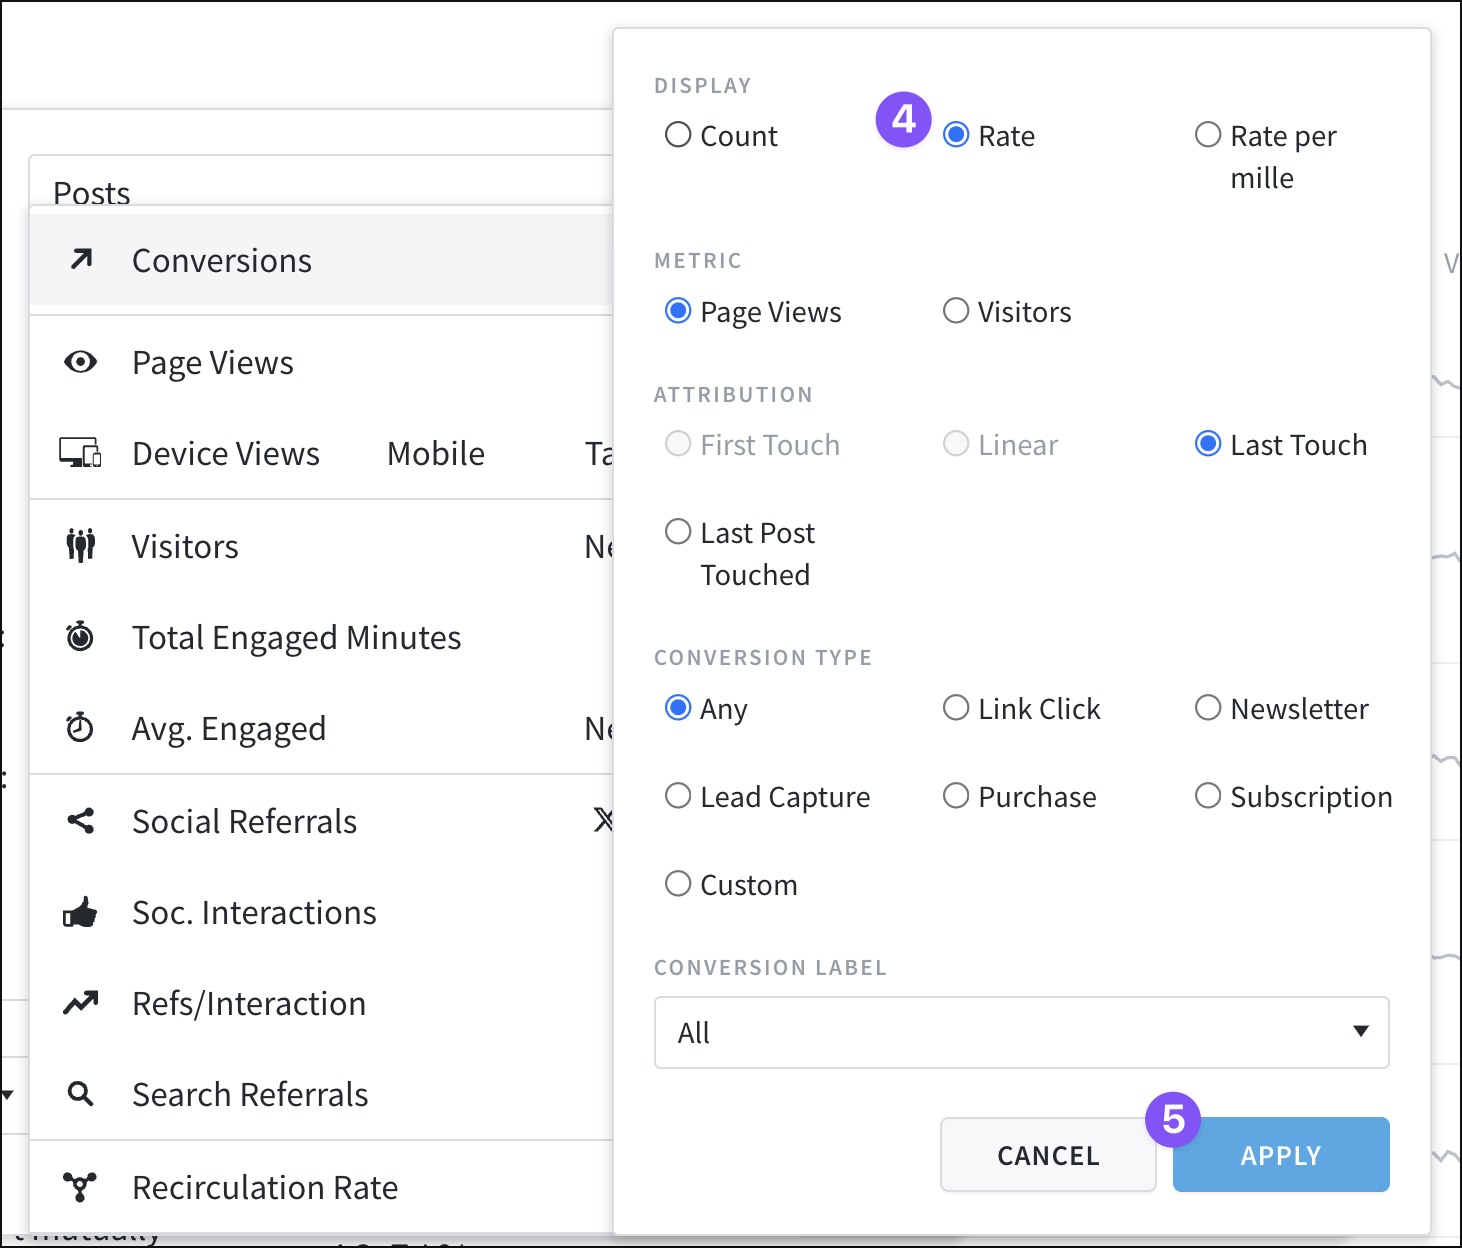
- Choose the “Rate” option if sorting by Conversions.
- Click “Apply.”
Overview can be further customized and filtered to focus on whatever aspects (posts, authors, tags, etc.) and metrics best fit your data needs.
Last updated: September 25, 2025