Create your own custom tag and/or referrer groups to keep track of the tags or referrers that matter most to you in one place. Watch the video below for a brief demonstration, or go to our Knowledge Base to read more about Tag Groups and Referrer Groups.
Ever wonder how content performance compares from one time period to another? With comparison mode, you can see the “before and after” results of your work directly in Parse.ly. Learn more in our Knowledge Base, or watch the video below for more details on where to find comparison mode, and how to use it!
In order to get better at anything, you need to understand what works. You also need to understand what doesn’t work. Being able to systematically surface the projects that did not produce the results that were expected of them will help you refine your content strategies and achieve more.
The Bottom Listings report shows a list of potentially underperforming posts. It can be repeated (weekly, daily, monthly) or generated once, in either HTML format or PDF format, which is the same as any other report in the Parse.ly dashboard.
Check out this video to see an example of creating a Bottom Listings report:
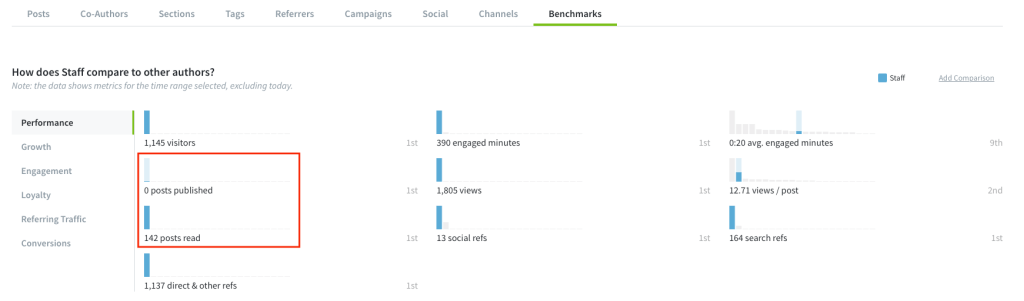
Update: Added “Posts Published” to the Benchmarks tab
We added “posts published” to the list of metrics in the Benchmarks tab.
Ever wonder which posts or articles send the most people to another page on your site? Welcome to recirculation rate. Recirculation rate is the percent of page views from one post that went to another internal post on your site.
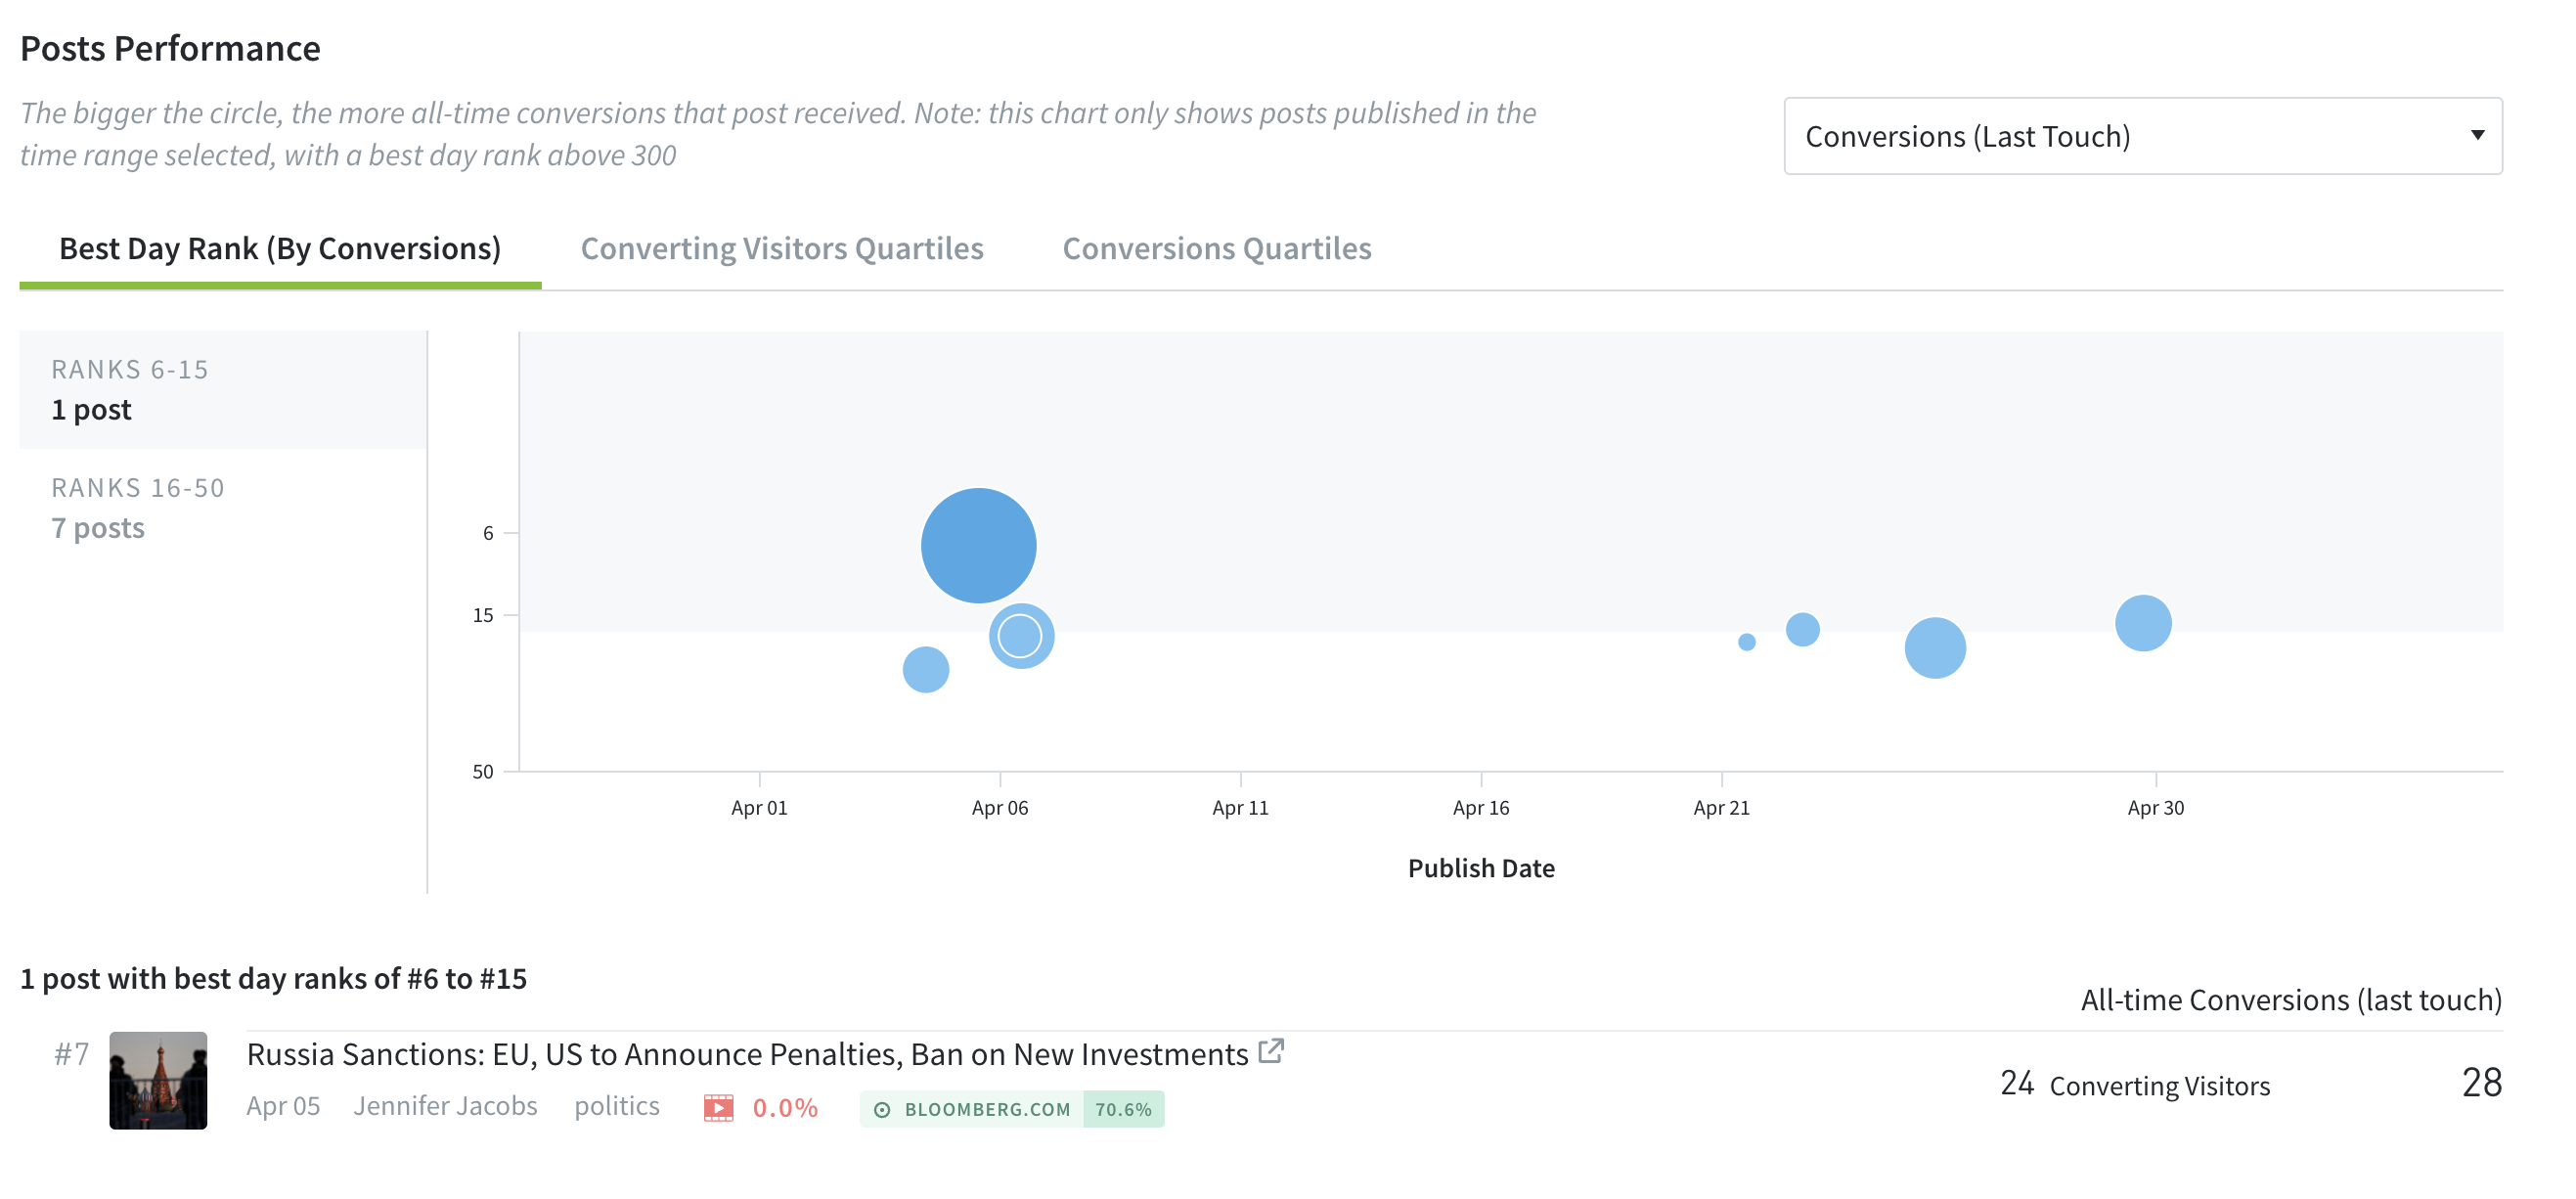
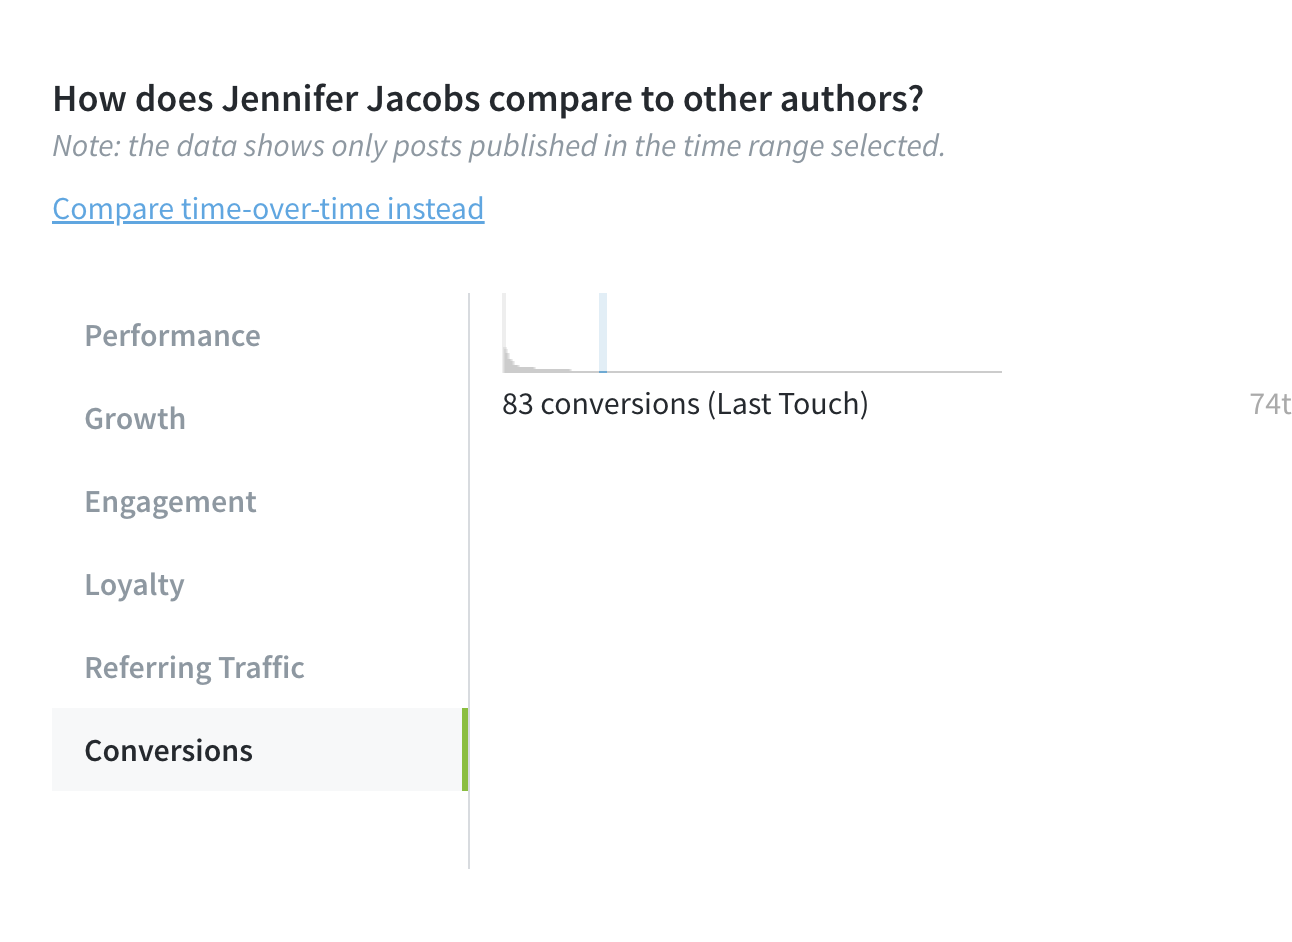
Benchmarks Comparisons are now available as a tab in the Authors and Sections pages.
When viewing Authors or Sections in historical mode, Benchmarks comparisons are now available as a tab on those pages.
The full range of Benchmarks comparisons are still available by selecting a specific author, tag, or section, and clicking “see benchmarks” at the top of the page.
Copy to clipboard icon appears when hovering over a factoid
Hovering over factoids now gives an option to copy and paste the full number. When you mouse over the number, a copy icon will appear. Click to copy to your clipboard.
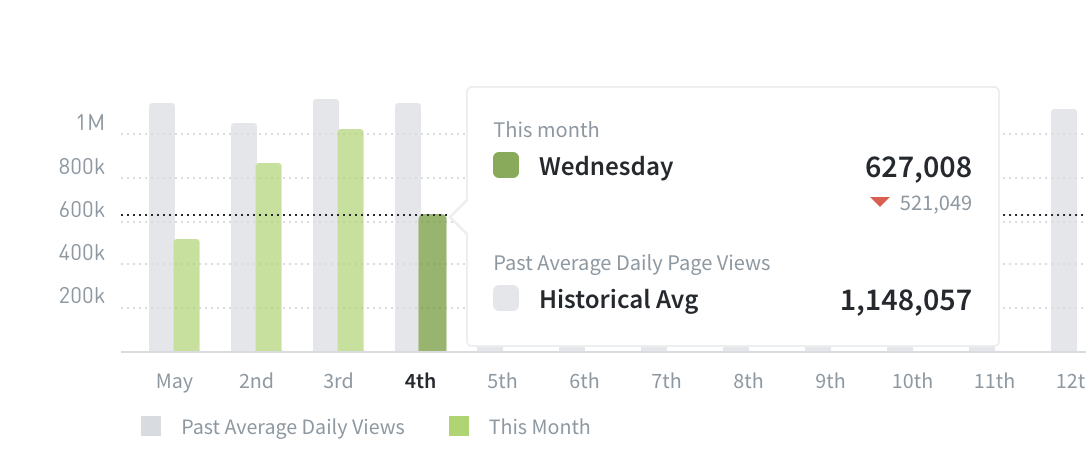
See how your Overview metric compares to the 8-week average
When you set your Overview timeline graph to This Week or This Month, you can now see how the current time period compares to the eight-week historical average. Learn how to unlock this new feature from your Overview settings.
We refreshed the color system in the Parse.ly dashboard to improve accessibility and readability, and improve the consistency in our light and dark modes.