Comparing and analyzing with benchmarks
The histograms at the top of an author’s (or section or tag’s) benchmarks page allow comparisons between that author and other authors (or section and other sections, tags and other tags).
Tabs on the left of this section allow focus on various priorities: Performance, Growth, Engagement, Loyalty, Referring Traffic, and Conversions.

Click “Add Comparison” to more clearly compare a section, for instance, to up 6 other sections. Each selected section is highlighted on the histograms in a different color to compare to the original section’s blue bar.

Compare an author, section, or tag’s performance over time
Click “Compare time-over-time instead” to adjust the histograms on an author, section, or tag’s benchmarks page to represent performance month-over-month or quarter-over-quarter.

Now each bar in the histograms represents a month or quarter.
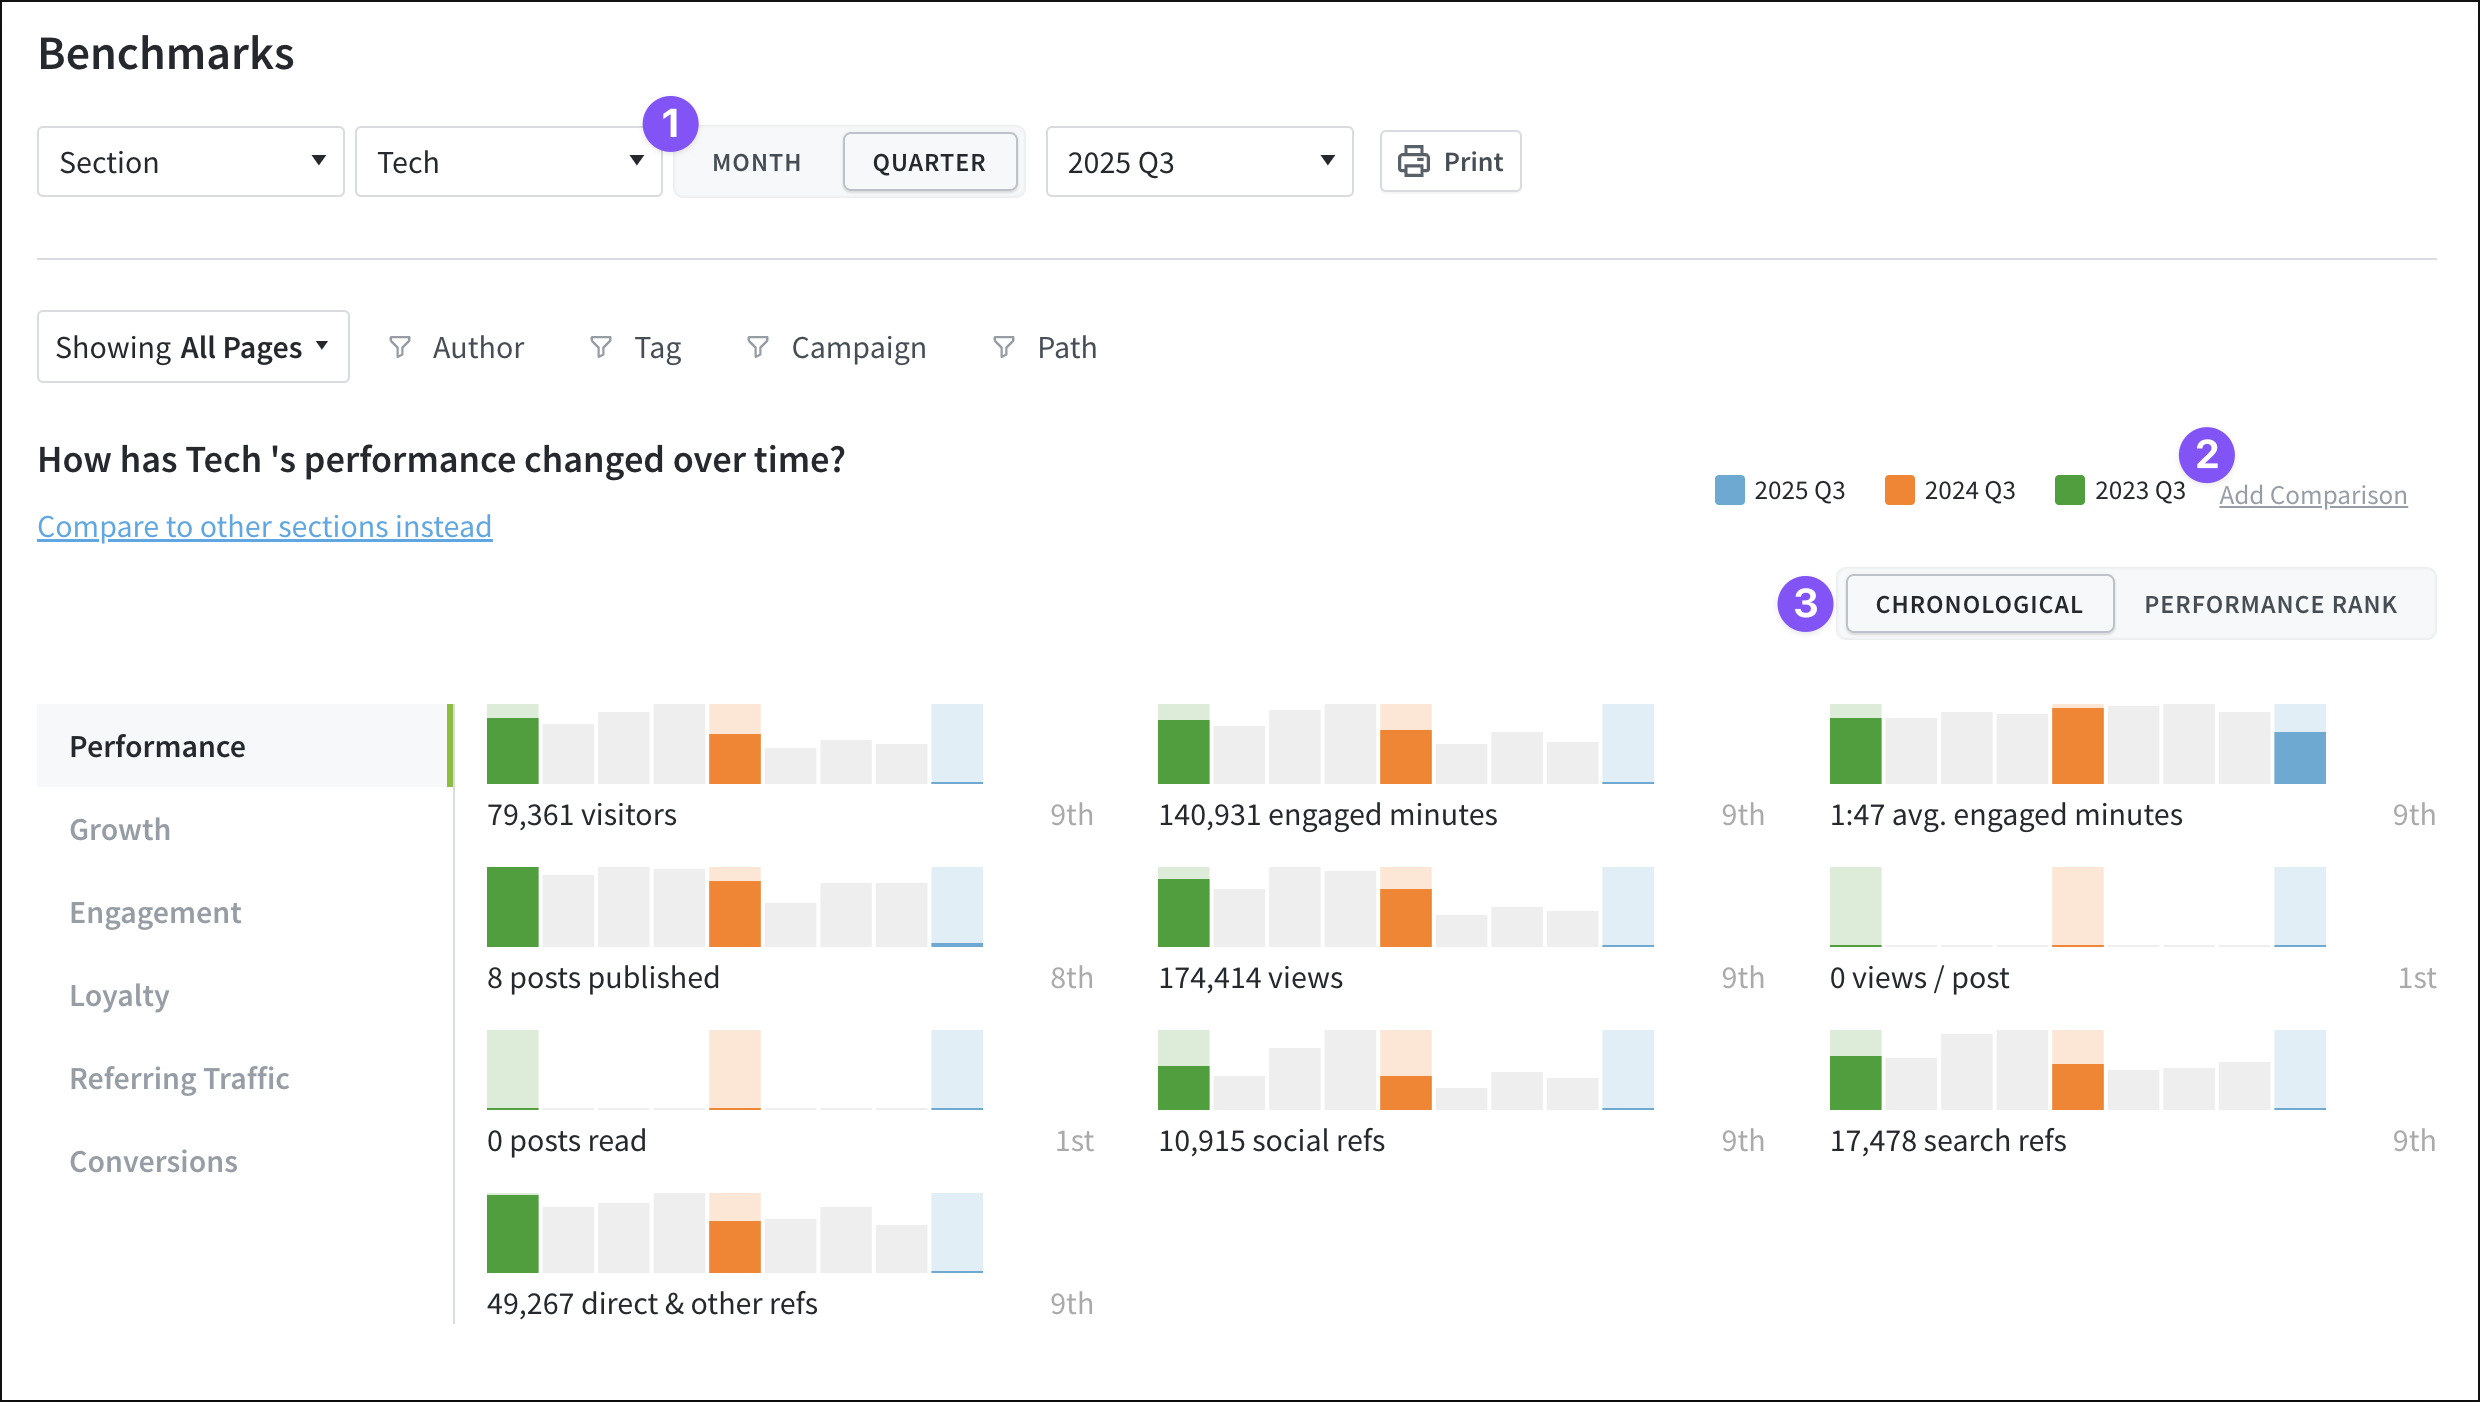
- Adjust the time periods in the histograms — choose “Month” or “Quarter.”
- Click “Add comparison” to more clearly compare multiple months/quarters, which are highlighted in the histograms in different colors to compare to the original month/quarter’s blue.
- Sort the histograms by chronologically or by performance.
Analyze post performance
The Posts Performance section of the benchmarks page buckets content performance for an author, section, or tag by different metrics. This allows you to analyze how posts or pages are performing for an author, section, or tag: which are leaders and which have struggled.
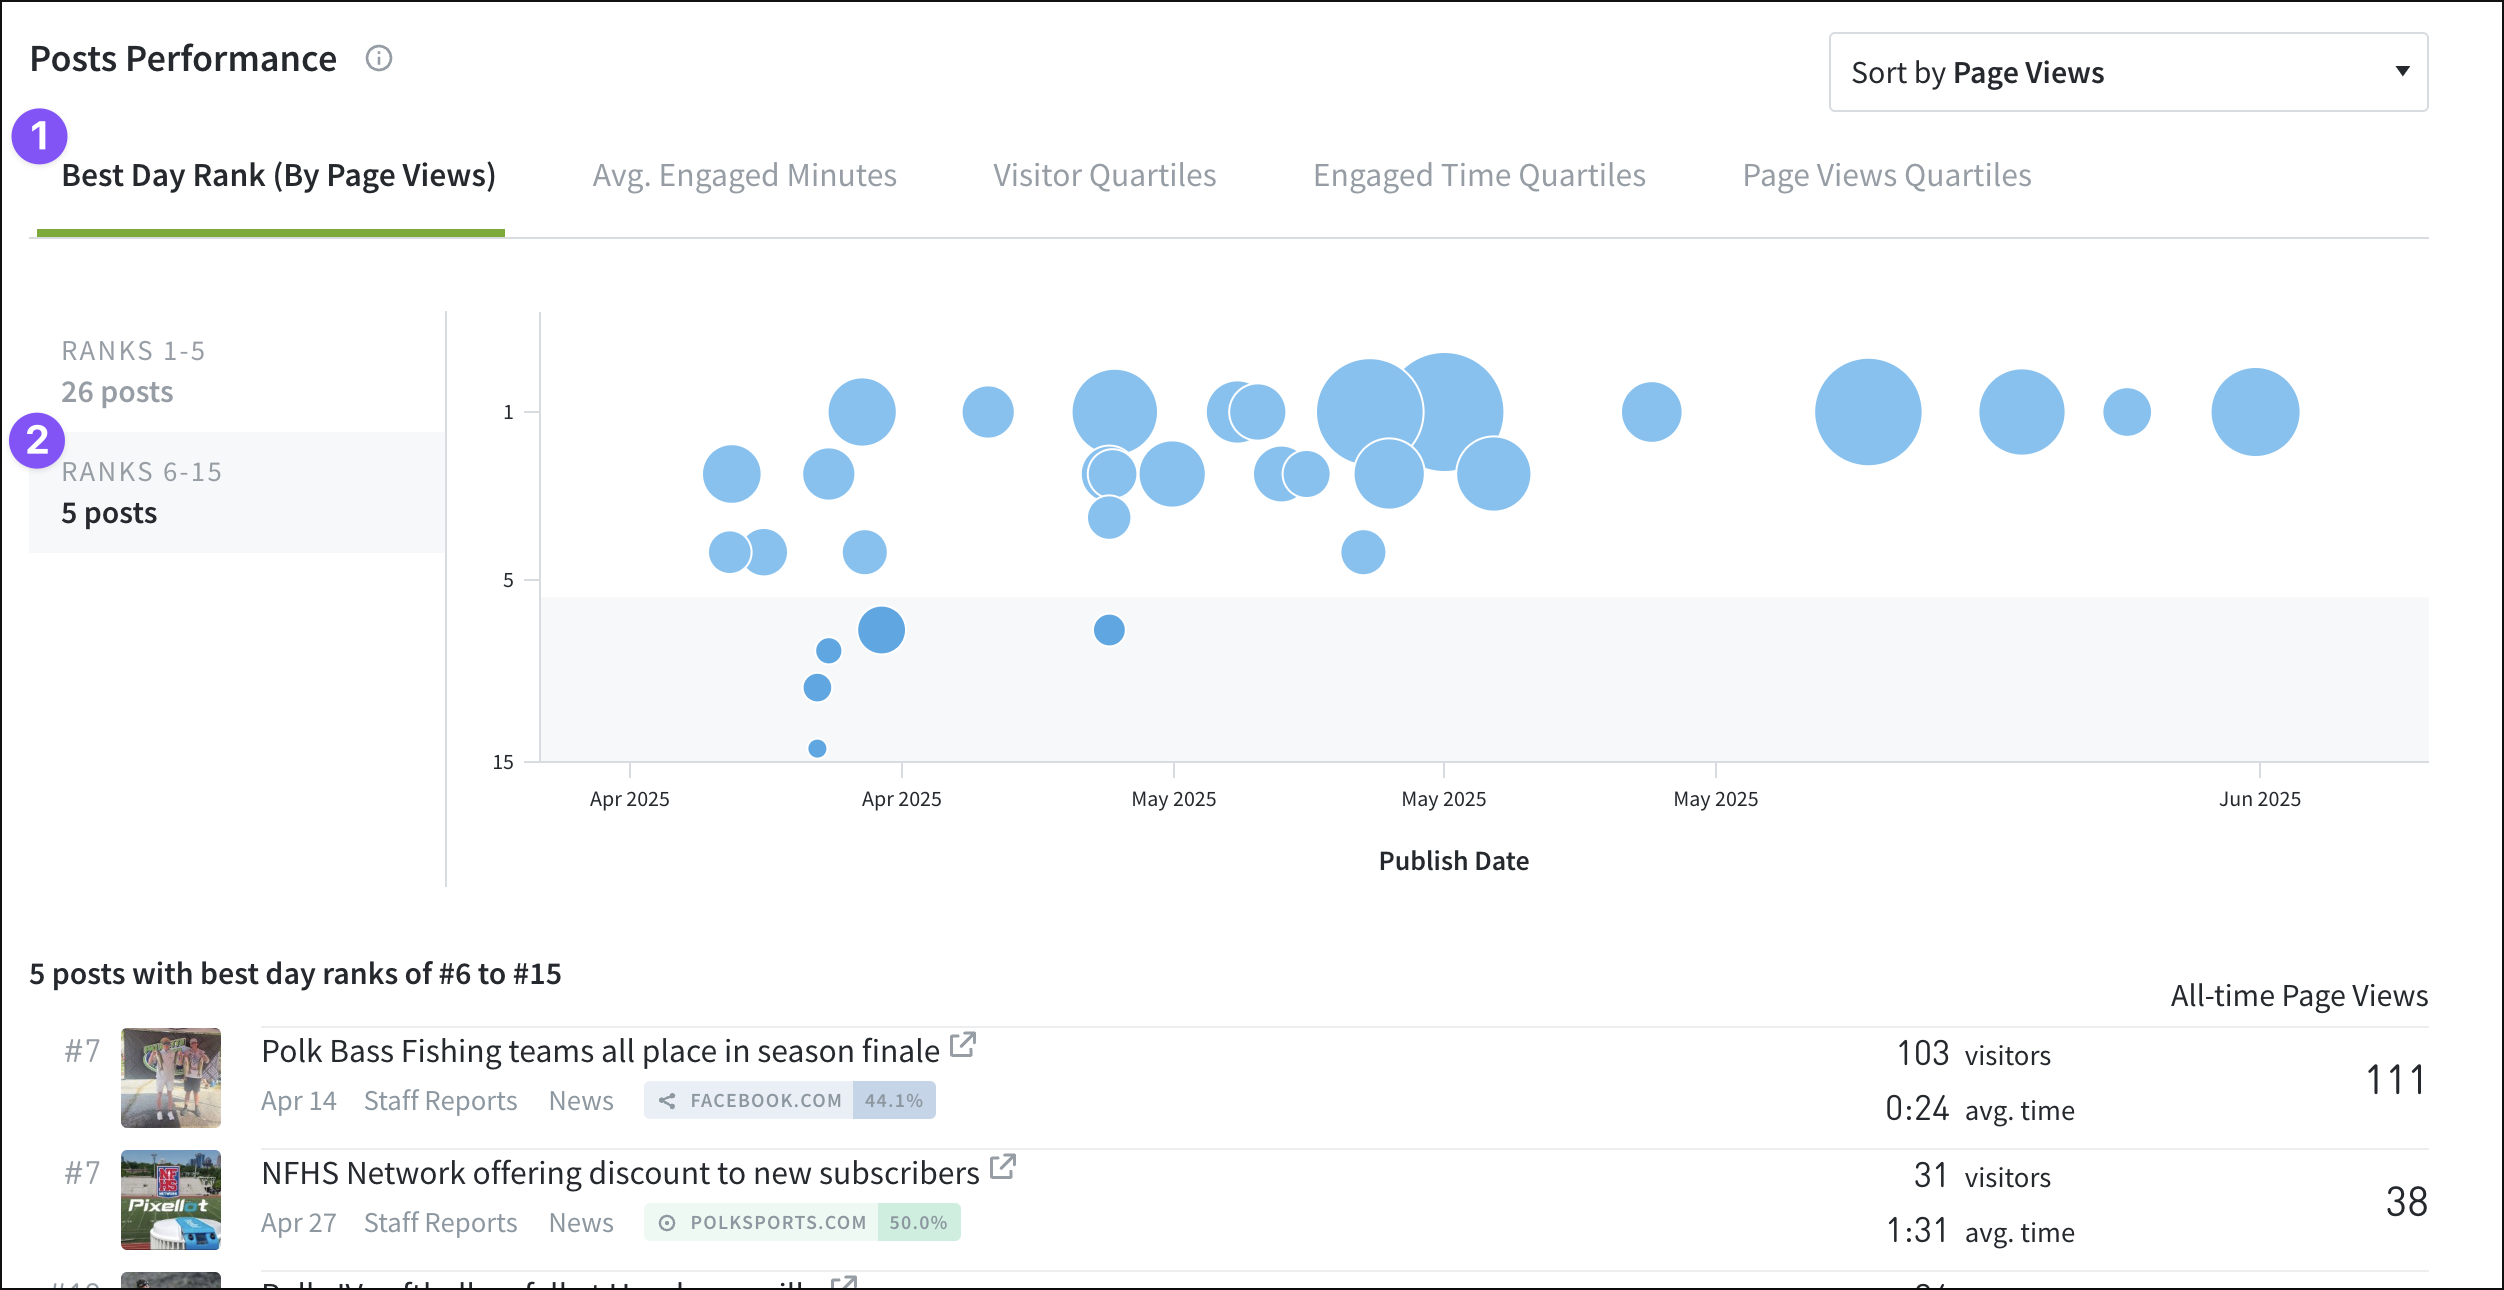
- Tabs above the bubble graph adjust the focus: Best Day Rank (By Page Views), Average Engaged Minutes, Visitor Quartiles, Engaged Time Quartiles, Page Views Quartiles.
- Selecting the lowest range displays a list of the least successful content. (Selecting the highest displays a list of the most successful.)
Last updated: September 19, 2025