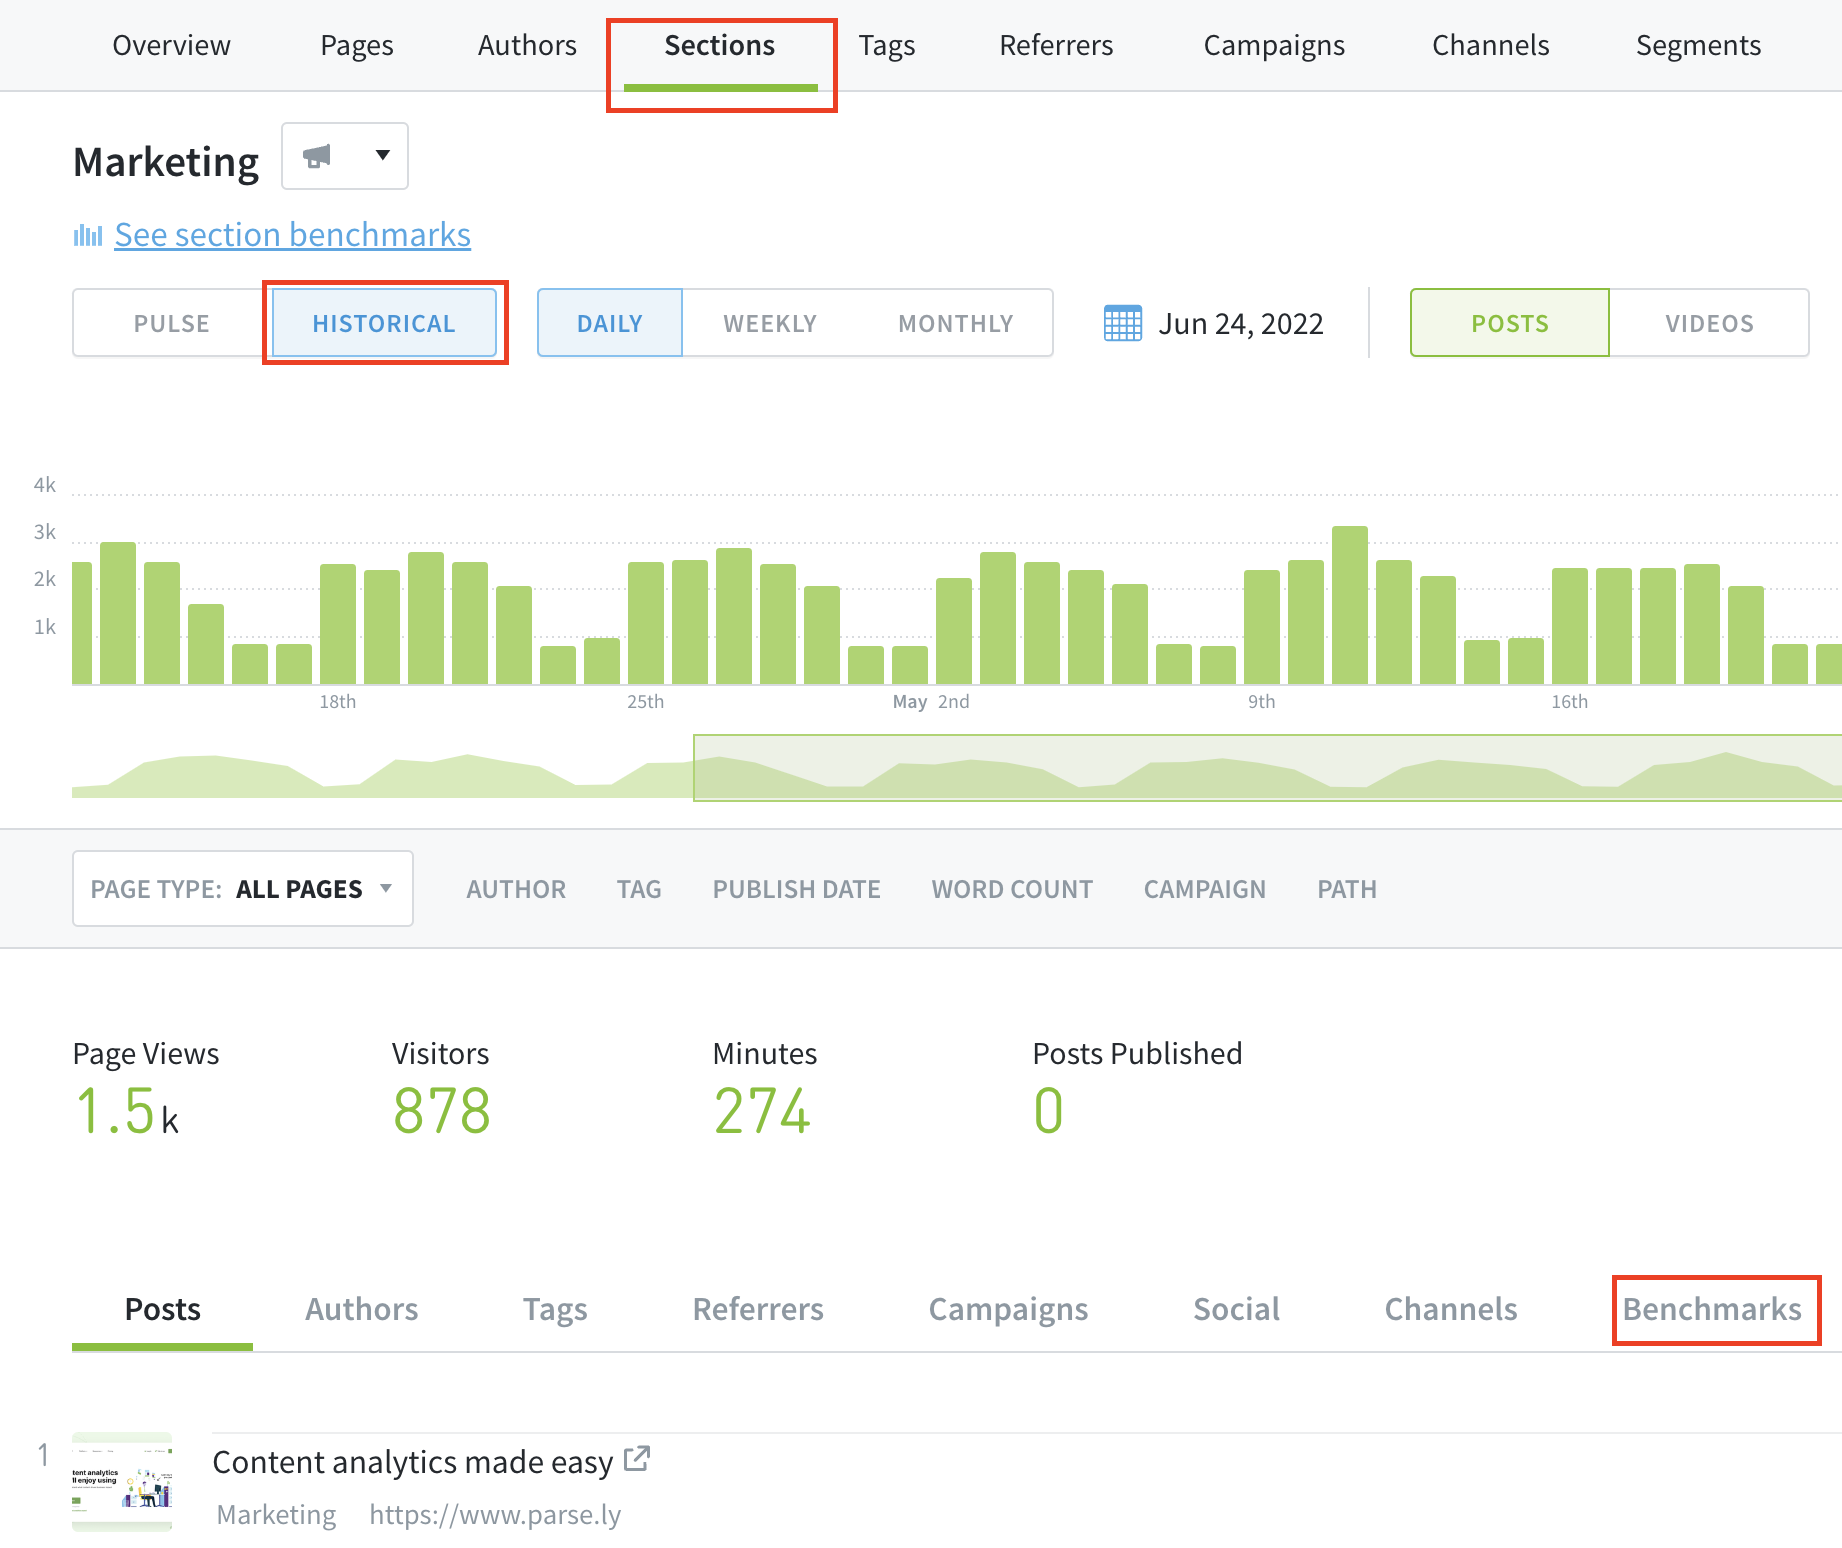
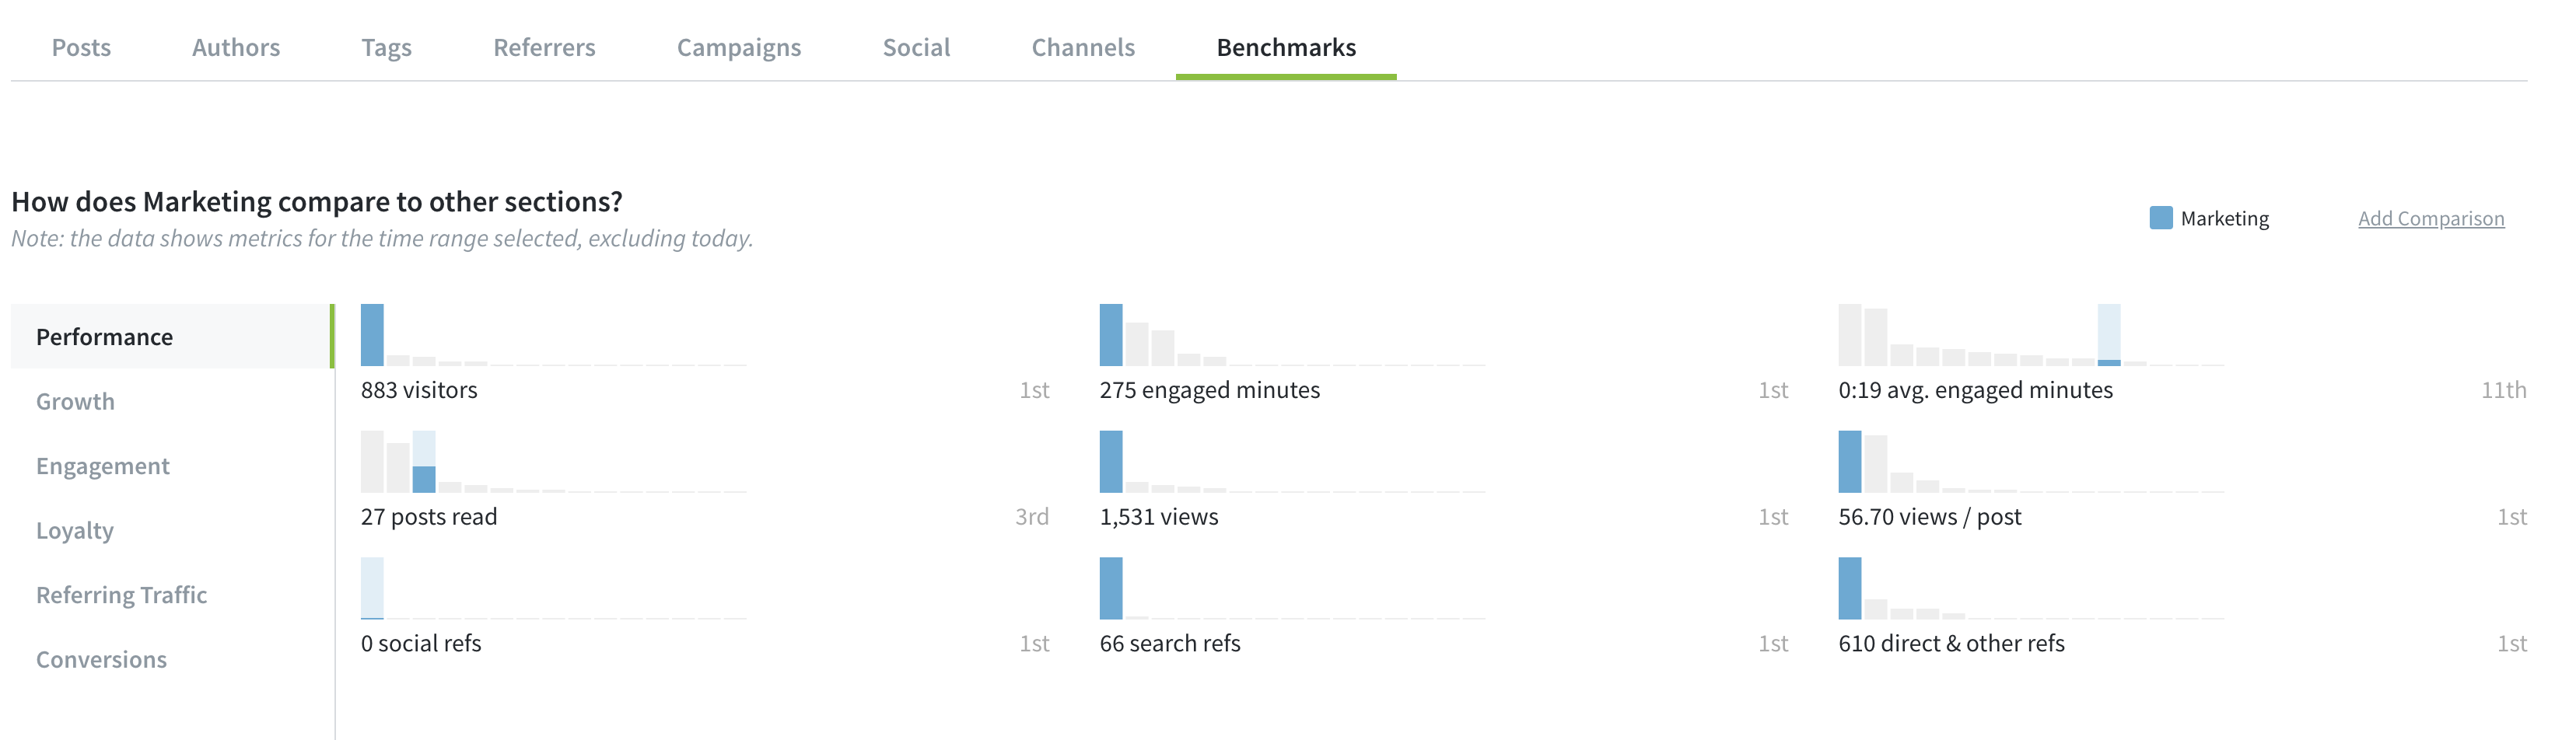
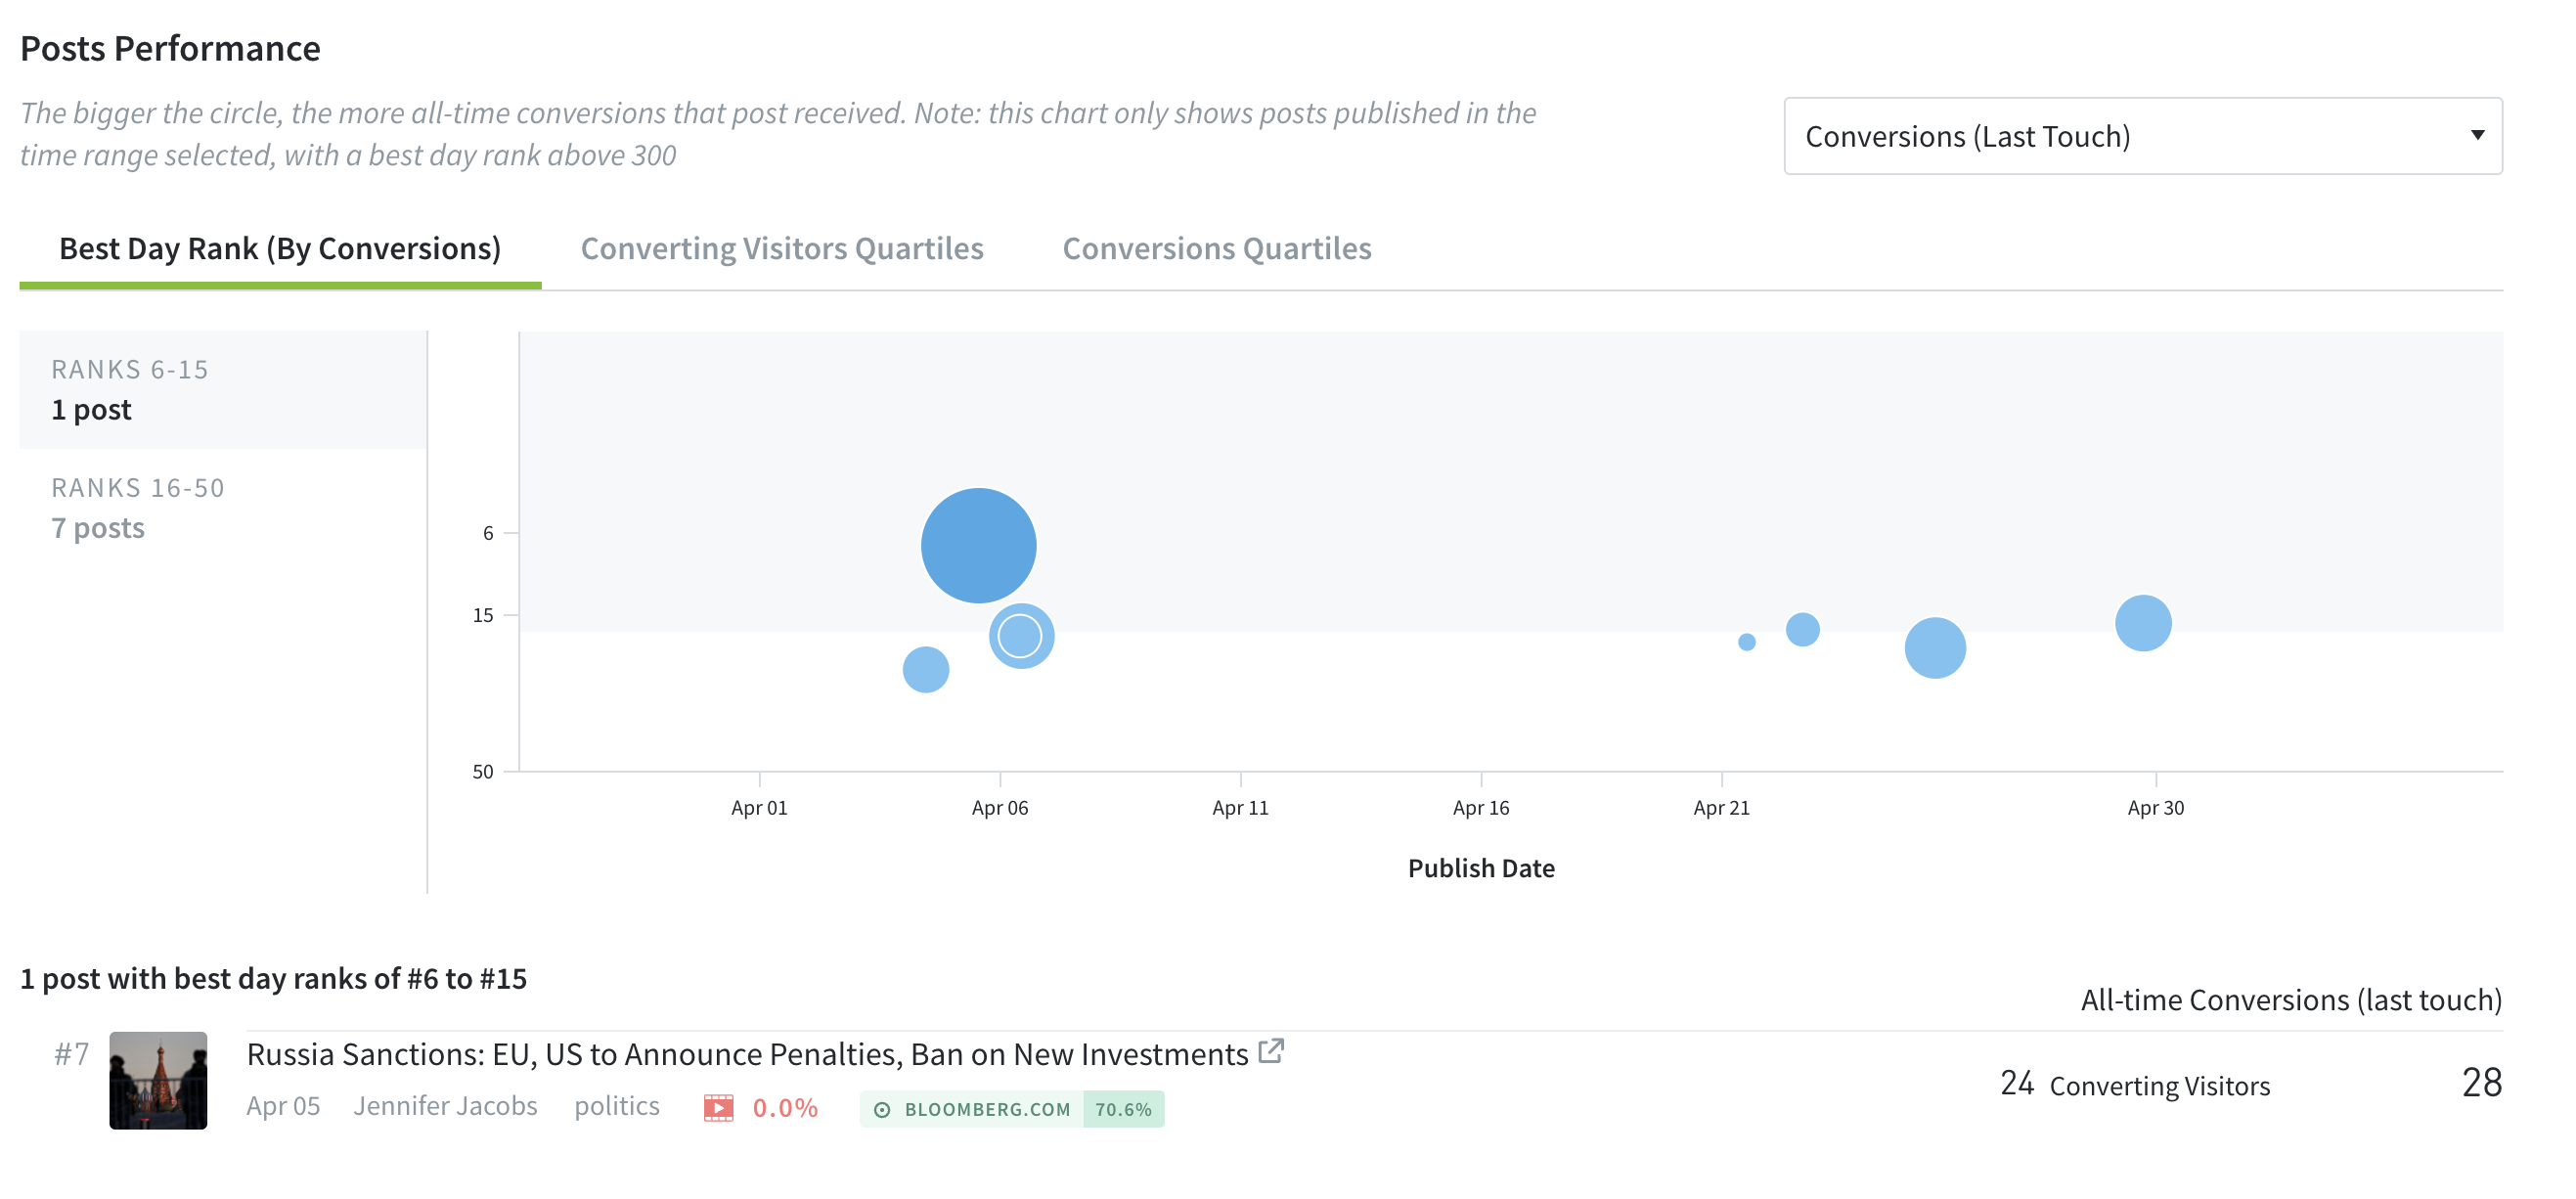
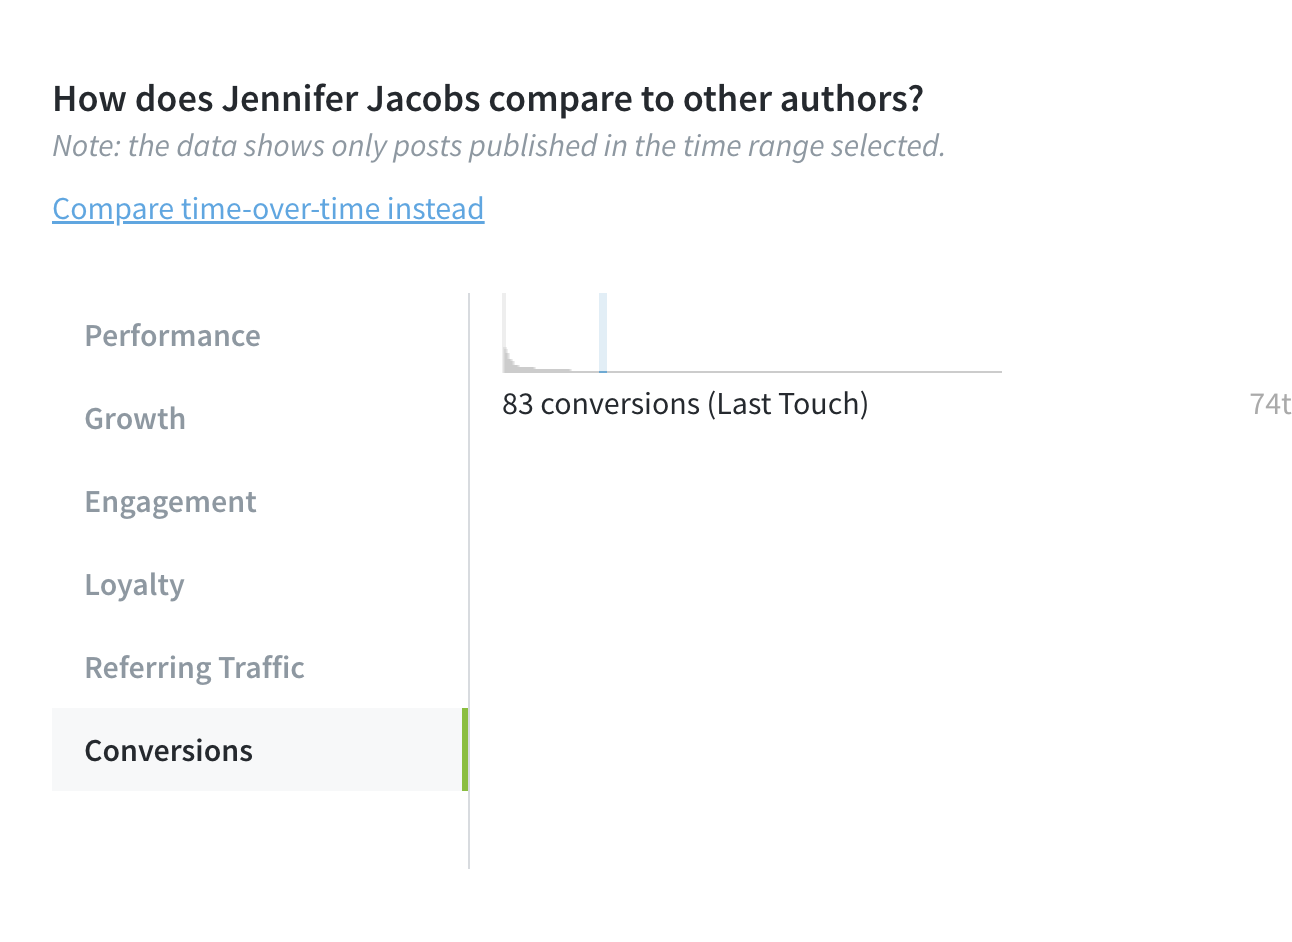
Benchmarks Comparisons are now available as a tab in the Authors and Sections pages.
When viewing Authors or Sections in historical mode, Benchmarks comparisons are now available as a tab on those pages.
The full range of Benchmarks comparisons are still available by selecting a specific author, tag, or section, and clicking “see benchmarks” at the top of the page.
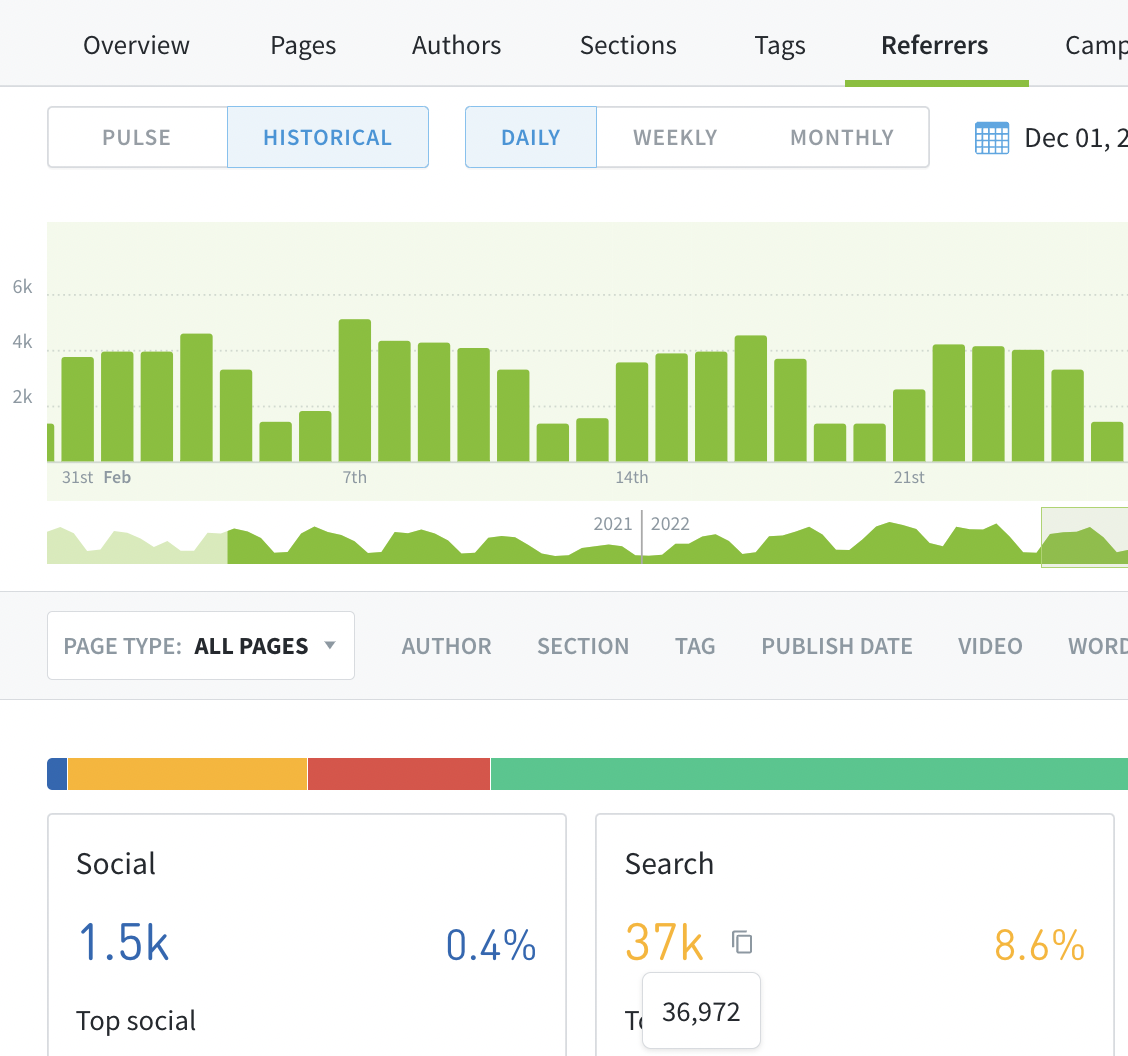
Copy to clipboard icon appears when hovering over a factoid
Hovering over factoids now gives an option to copy and paste the full number. When you mouse over the number, a copy icon will appear. Click to copy to your clipboard.
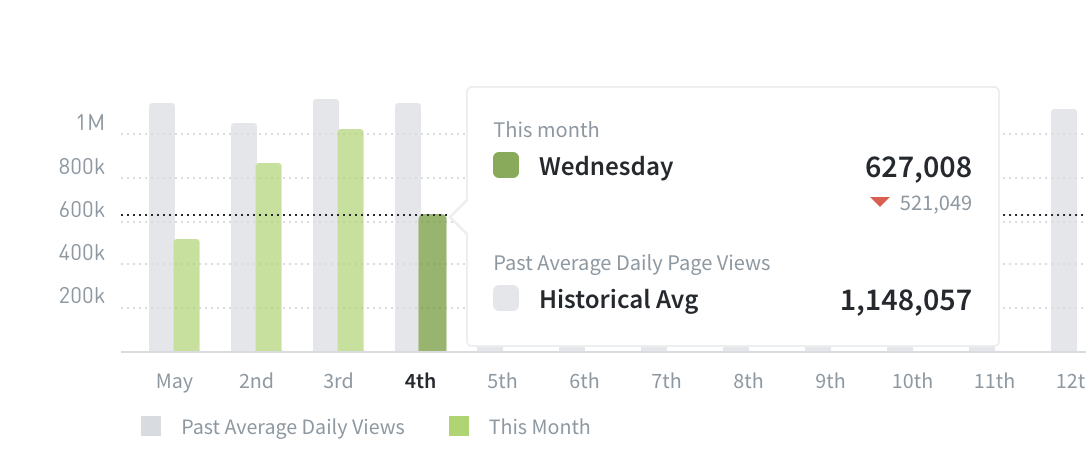
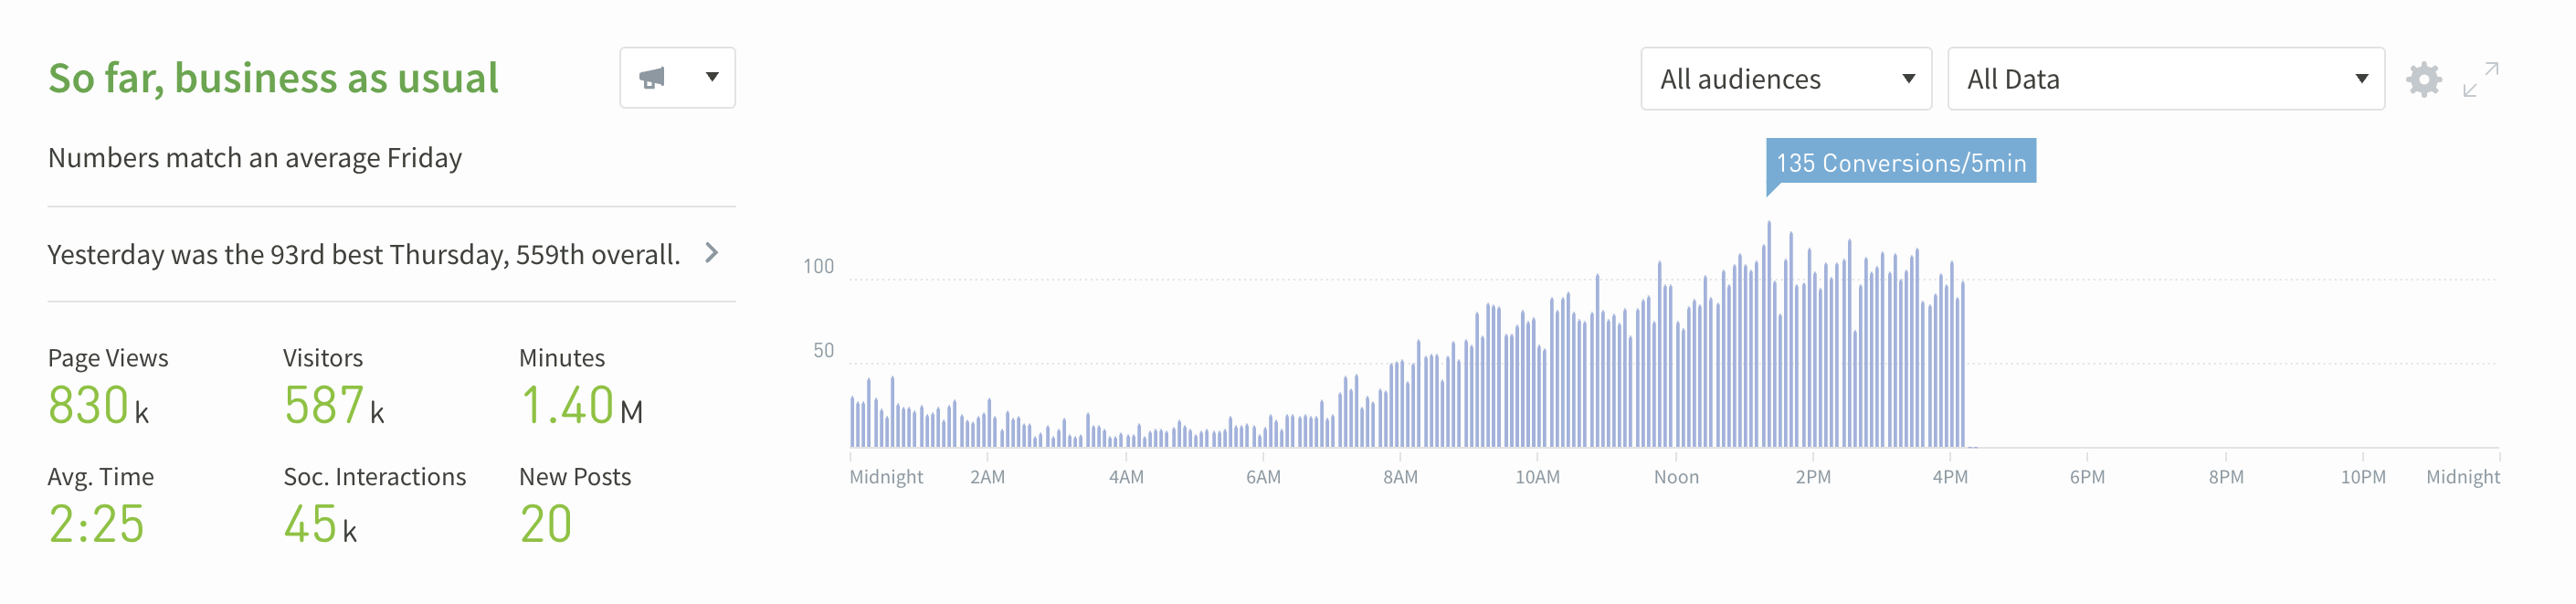
See how your Overview metric compares to the 8-week average
When you set your Overview timeline graph to This Week or This Month, you can now see how the current time period compares to the eight-week historical average. Learn how to unlock this new feature from your Overview settings.
We refreshed the color system in the Parse.ly dashboard to improve accessibility and readability, and improve the consistency in our light and dark modes.
Got a long list of conversions you’re tracking in Parse.ly? Now you can filter them down by type on the Conversions listing page. Just click one of the types to apply the filter. To remove the filter, click the type again.
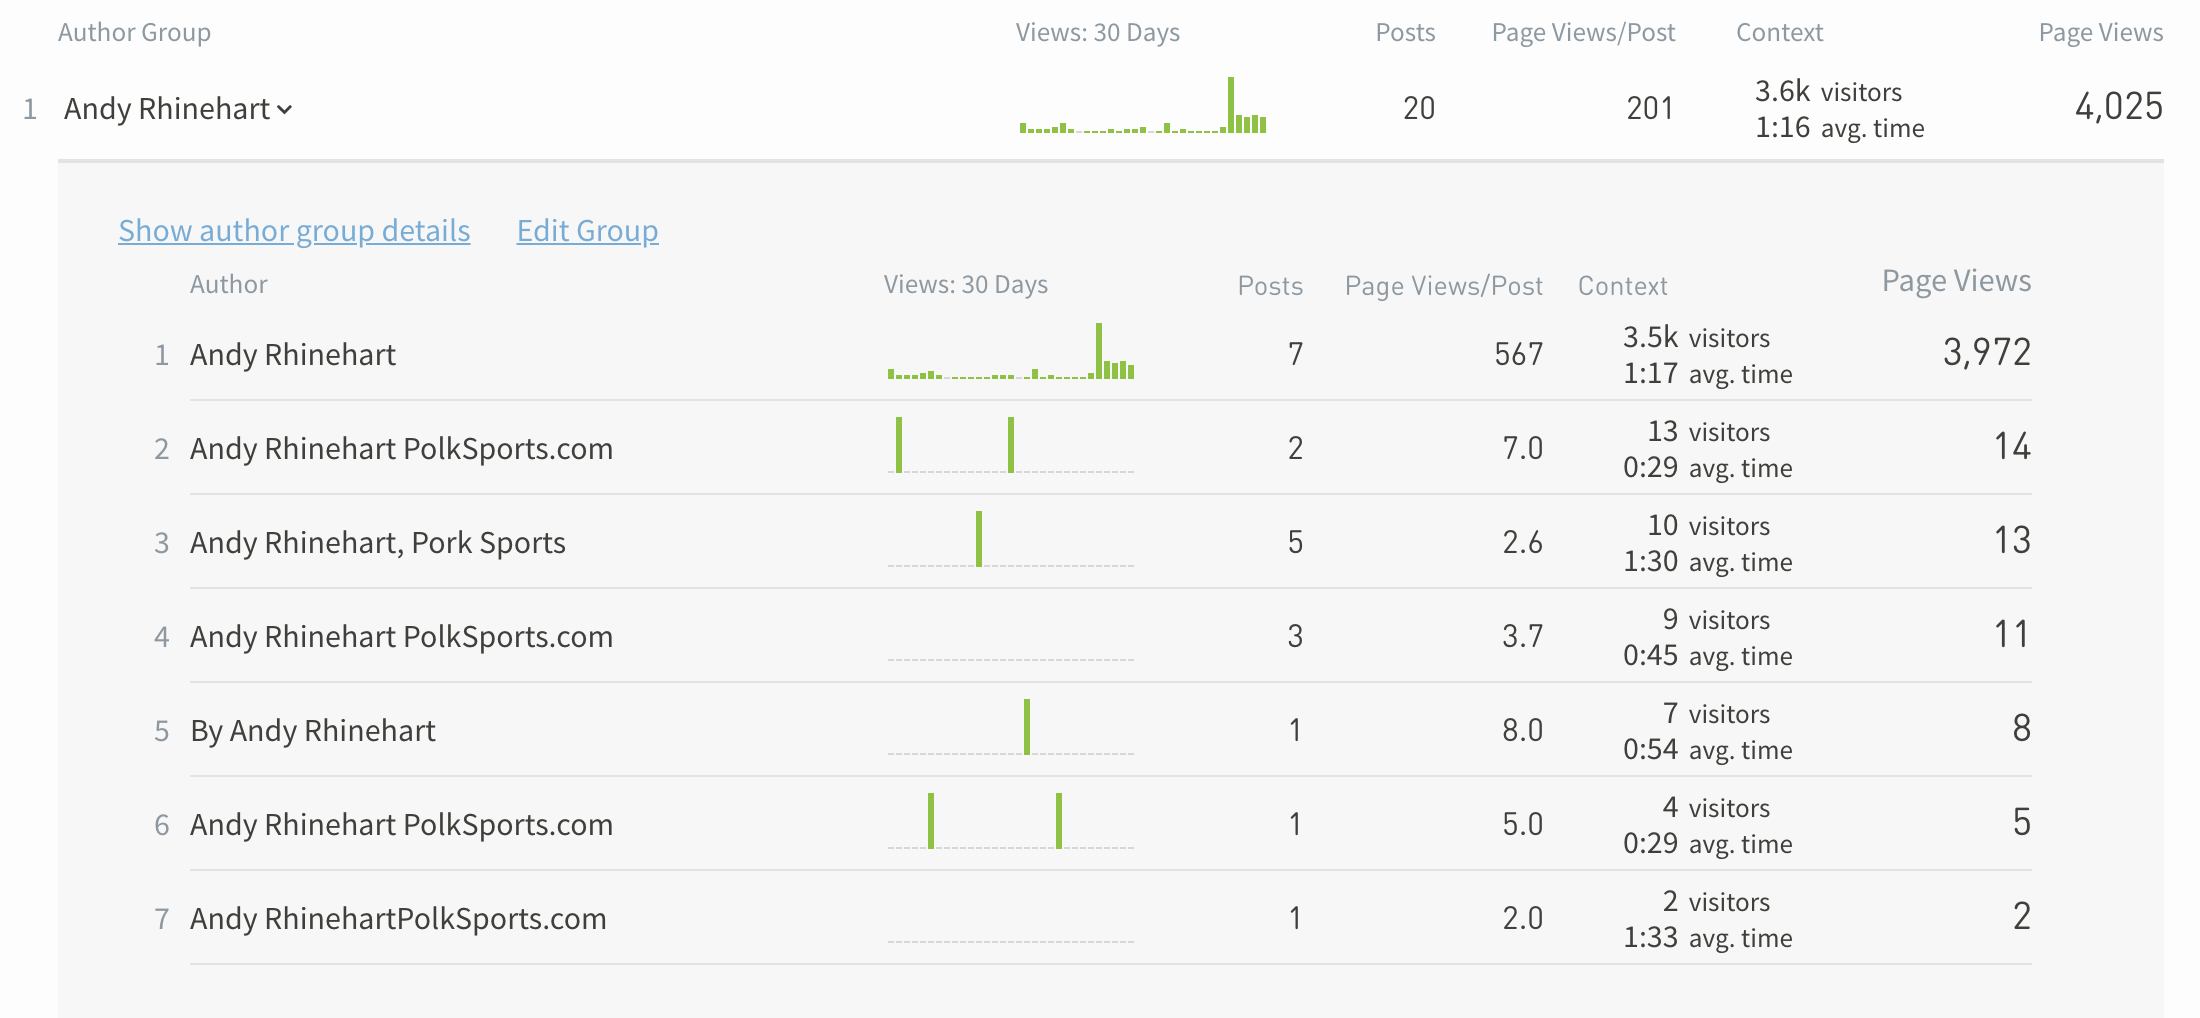
With Author Groups, you can save collections of authors and view their performance all at once. Create a group to track your team’s performance, to distinguish freelancers from full-time writers, or to group together multiple variations of the same author’s name.
Go to the new Author Groups tab to set up your first Author Group. Author Groups are visible to all users of your Parse.ly dashboard.
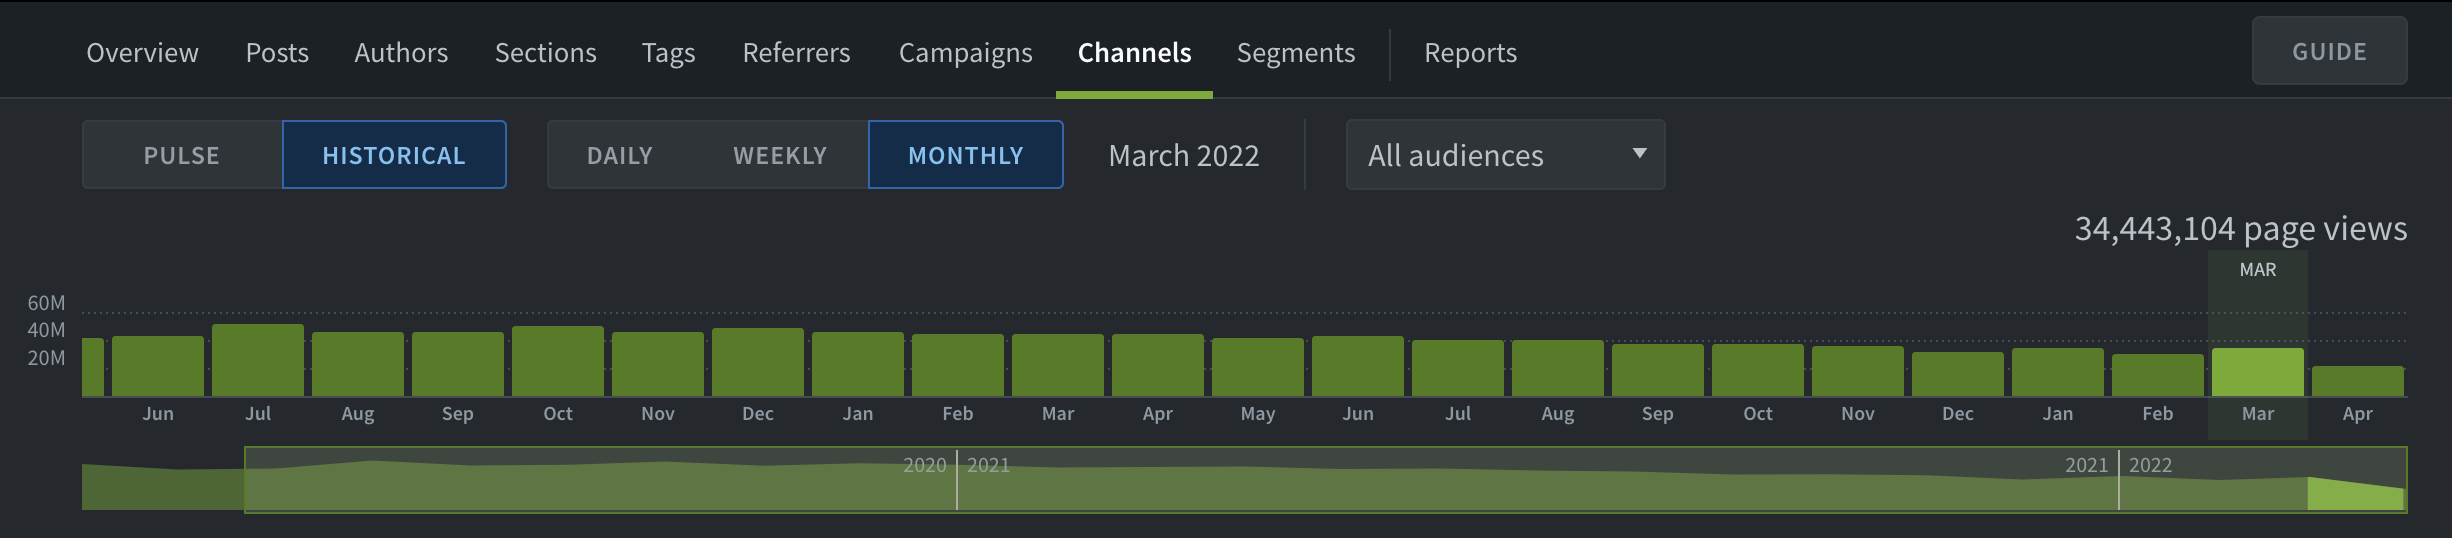
You can now select historical data, visualized as a timeline in the dashboard, and copy the summary metric text (“2,400”) to the clipboard with one click. Paste it anywhere you like – a document, an email, an instant message.
Filtering tags by Smart Tags
Use a “starts with” matcher like Squ* when filtering for tags and the resulting list will include both your site tags and any matching Smart Tags. Note: You must have ‘smart tags’ (site and high-level tags, or all tags) enabled in your preferences to make use of this feature.