Parse.ly now offers the option to automate conversions reporting. Ensure your boss and colleagues know the impact your content is making, every week in an email. When someone asks, “What is this content doing for the business?”—you’ll have answer. And you’ll get back the hours you might spend combining conversions data from separate spreadsheets!
The conversions report shows
• content that converts the most readers • content that assists the most conversions • the types of conversions your content drives best
This feature is available at an additional cost. If you’re eager to get started, please reach out to your account rep or email hello@parsely.com to discuss possibilities and pricing. Or check out the announcement to learn more on your own first!
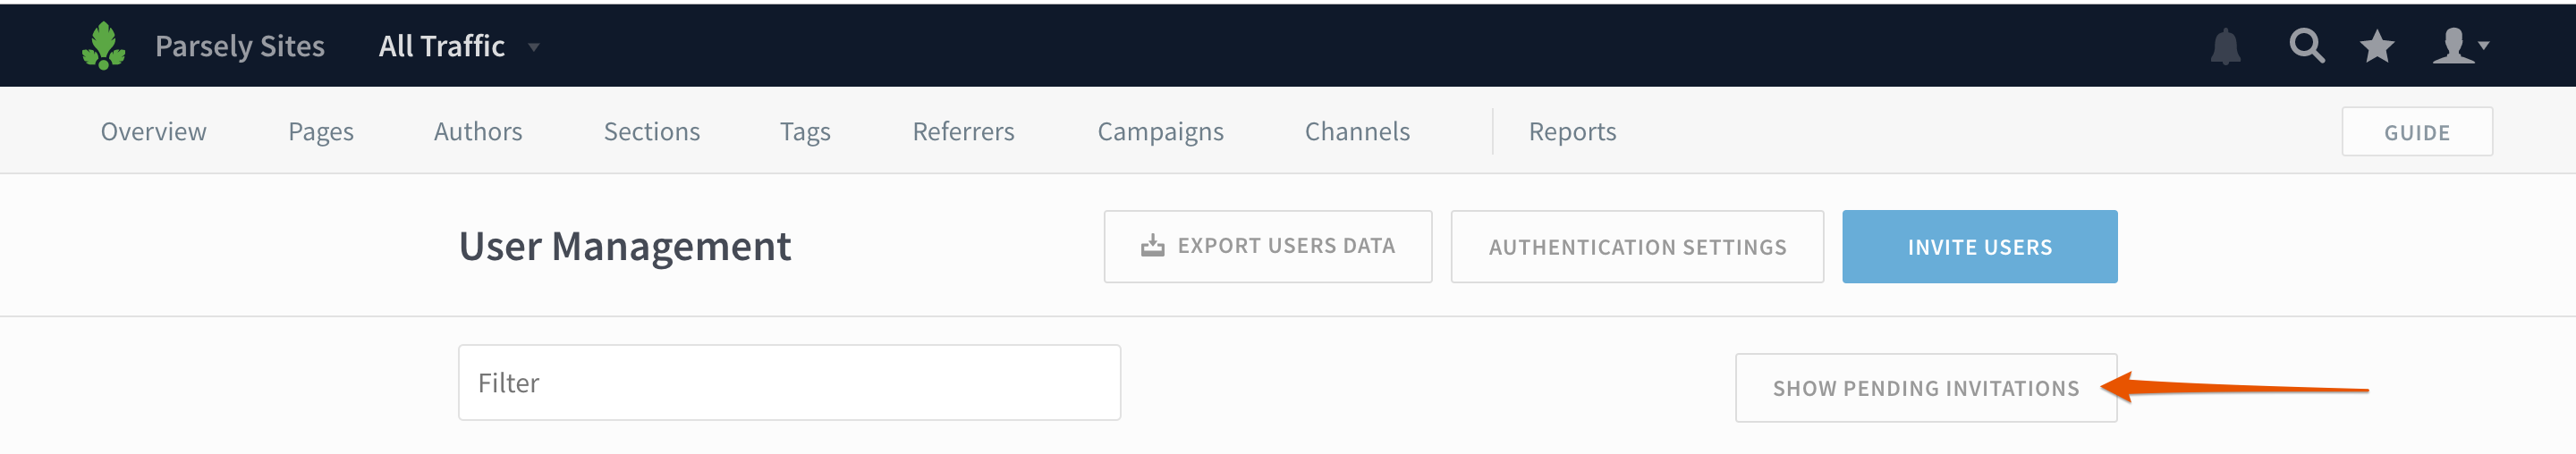
Now admins can easily see which users haven’t accepted their invitation to create a Parse.ly account and give them a friendly reminder.
On the Users page, click Showing Pending Invitations. (If there are no pending invitations, this button won’t appear!)
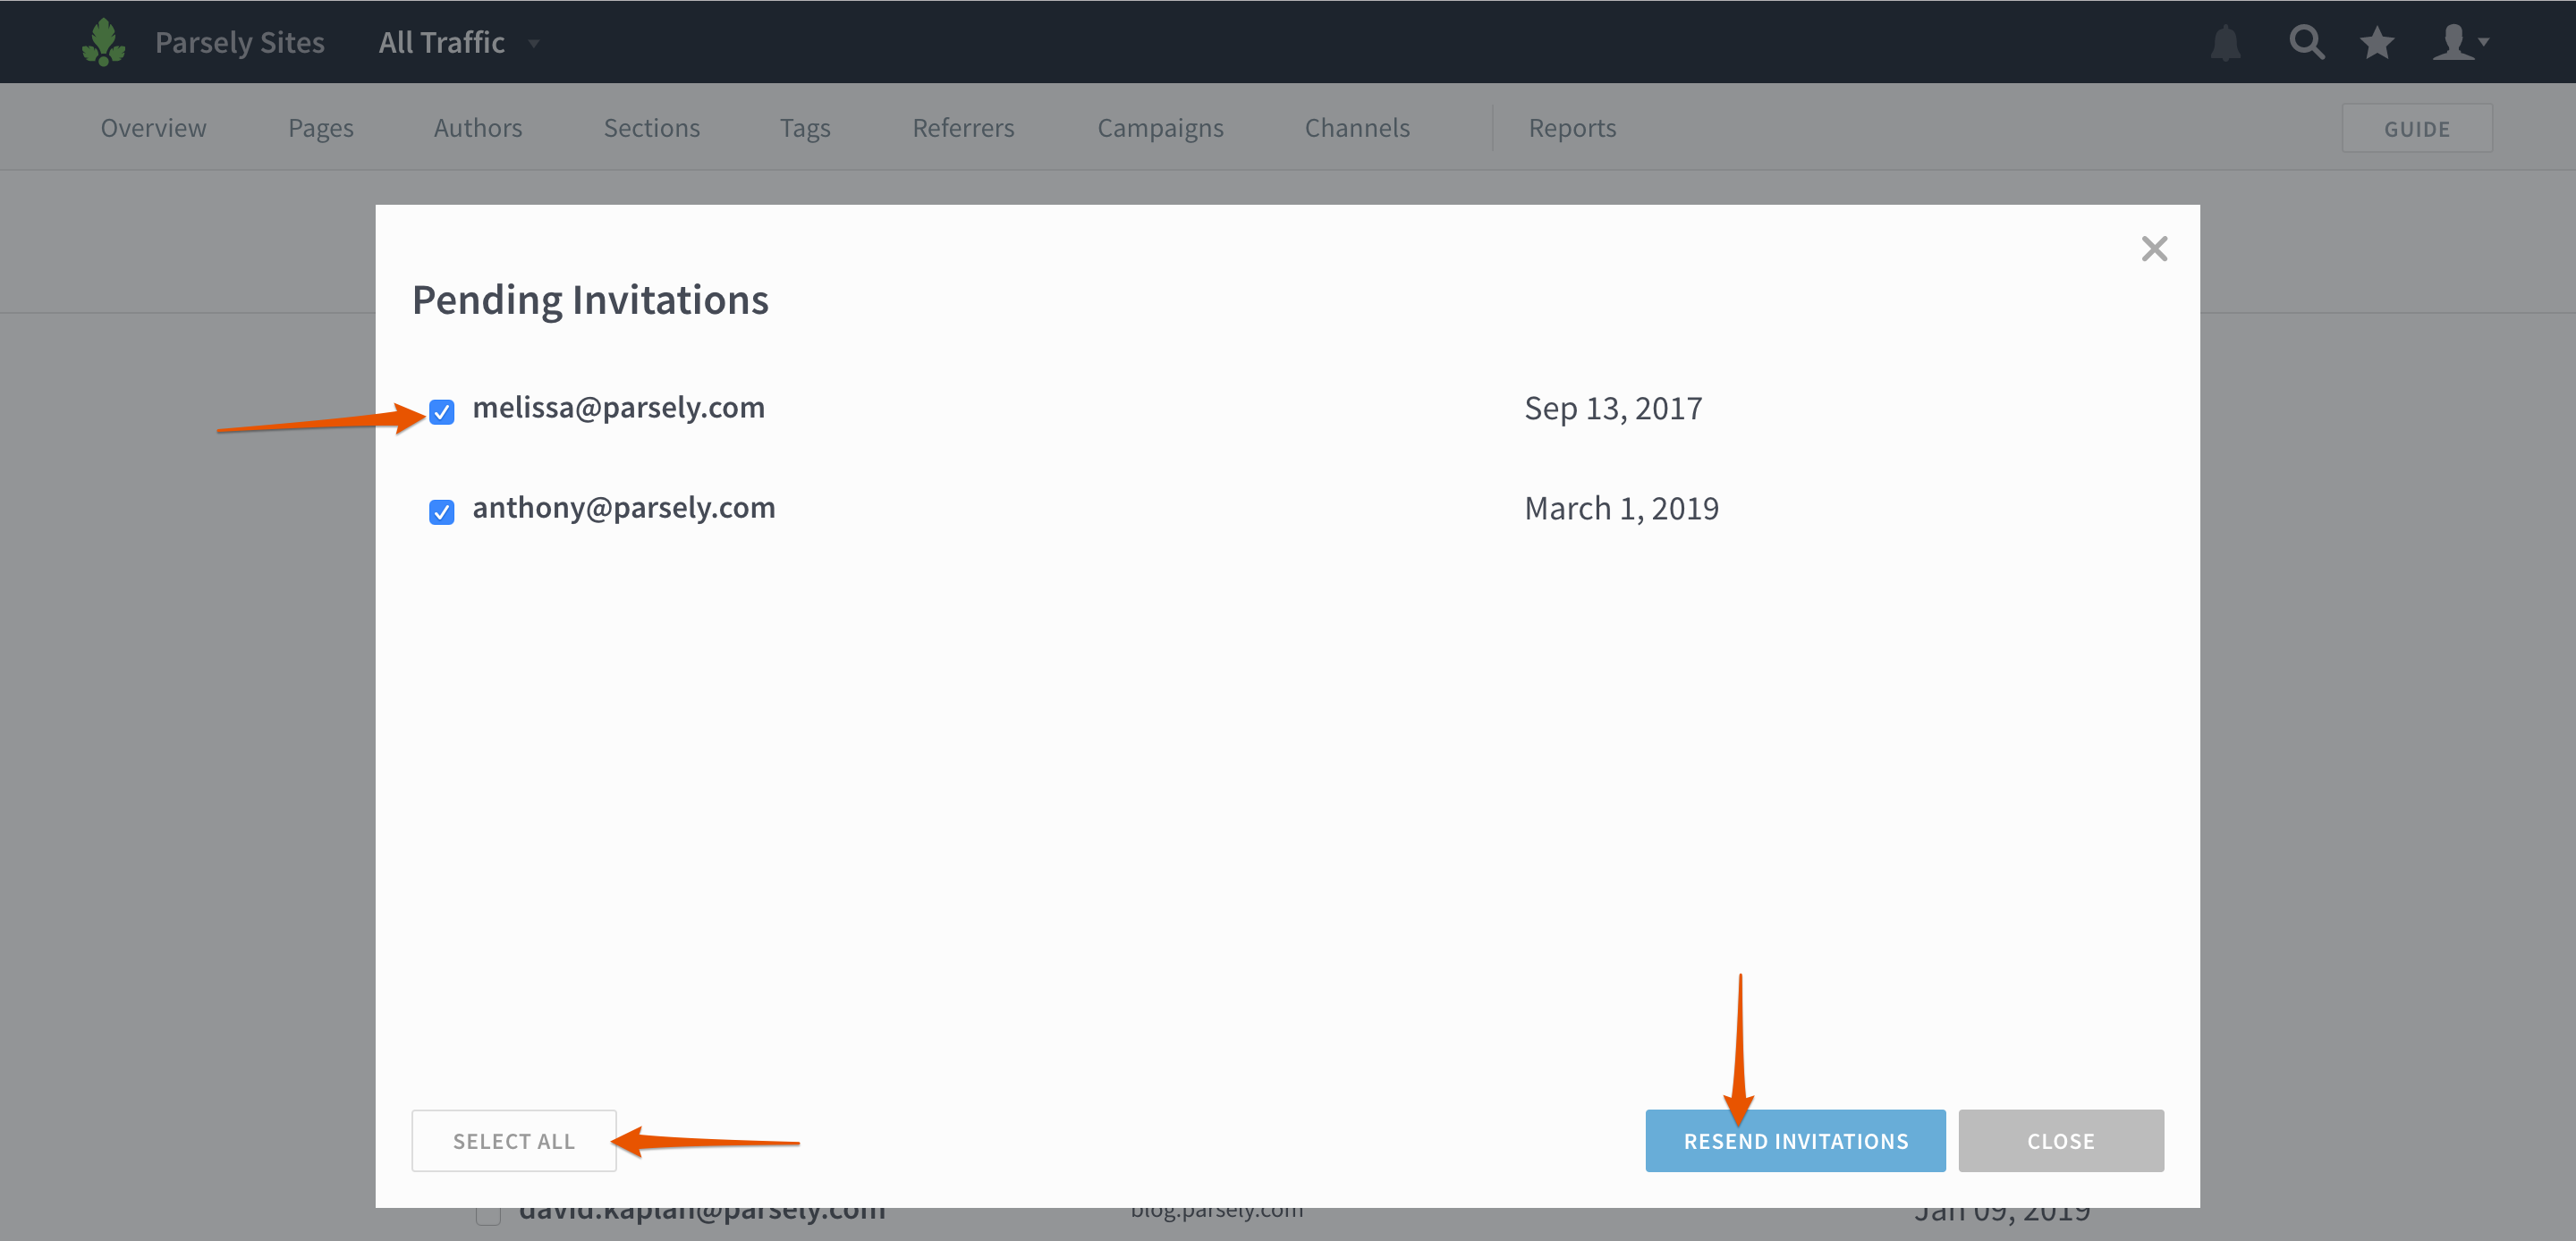
You’ll then see a list of pending invitations. Check the boxes next to individual users or click Select All to bulk invite. Click Resend Invitations, and you’re done!
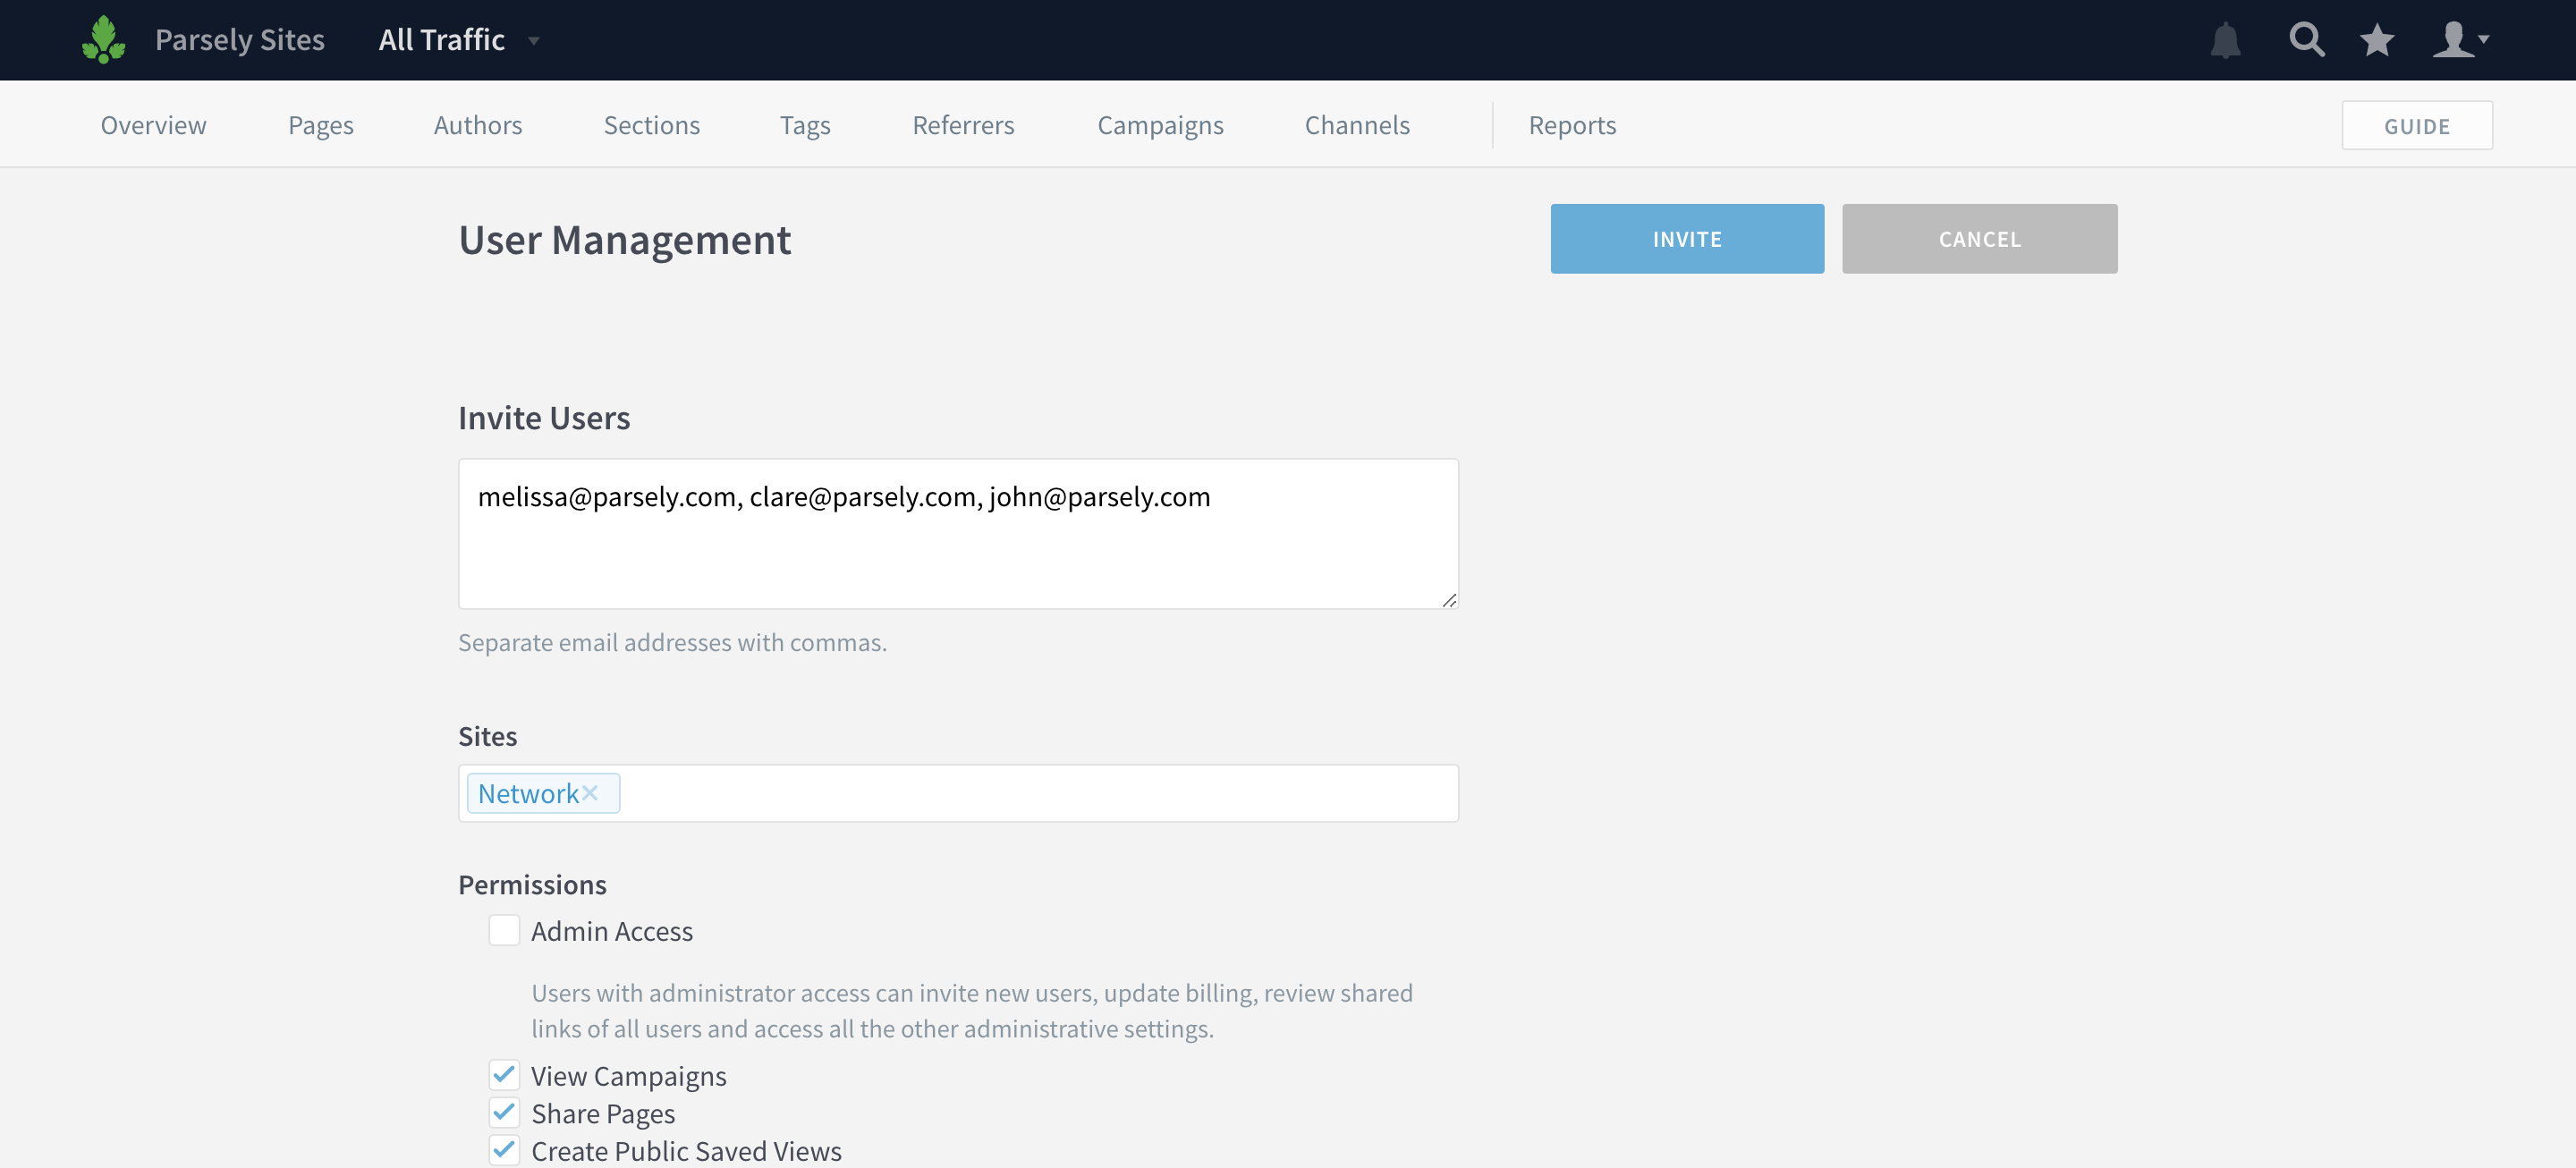
Network users
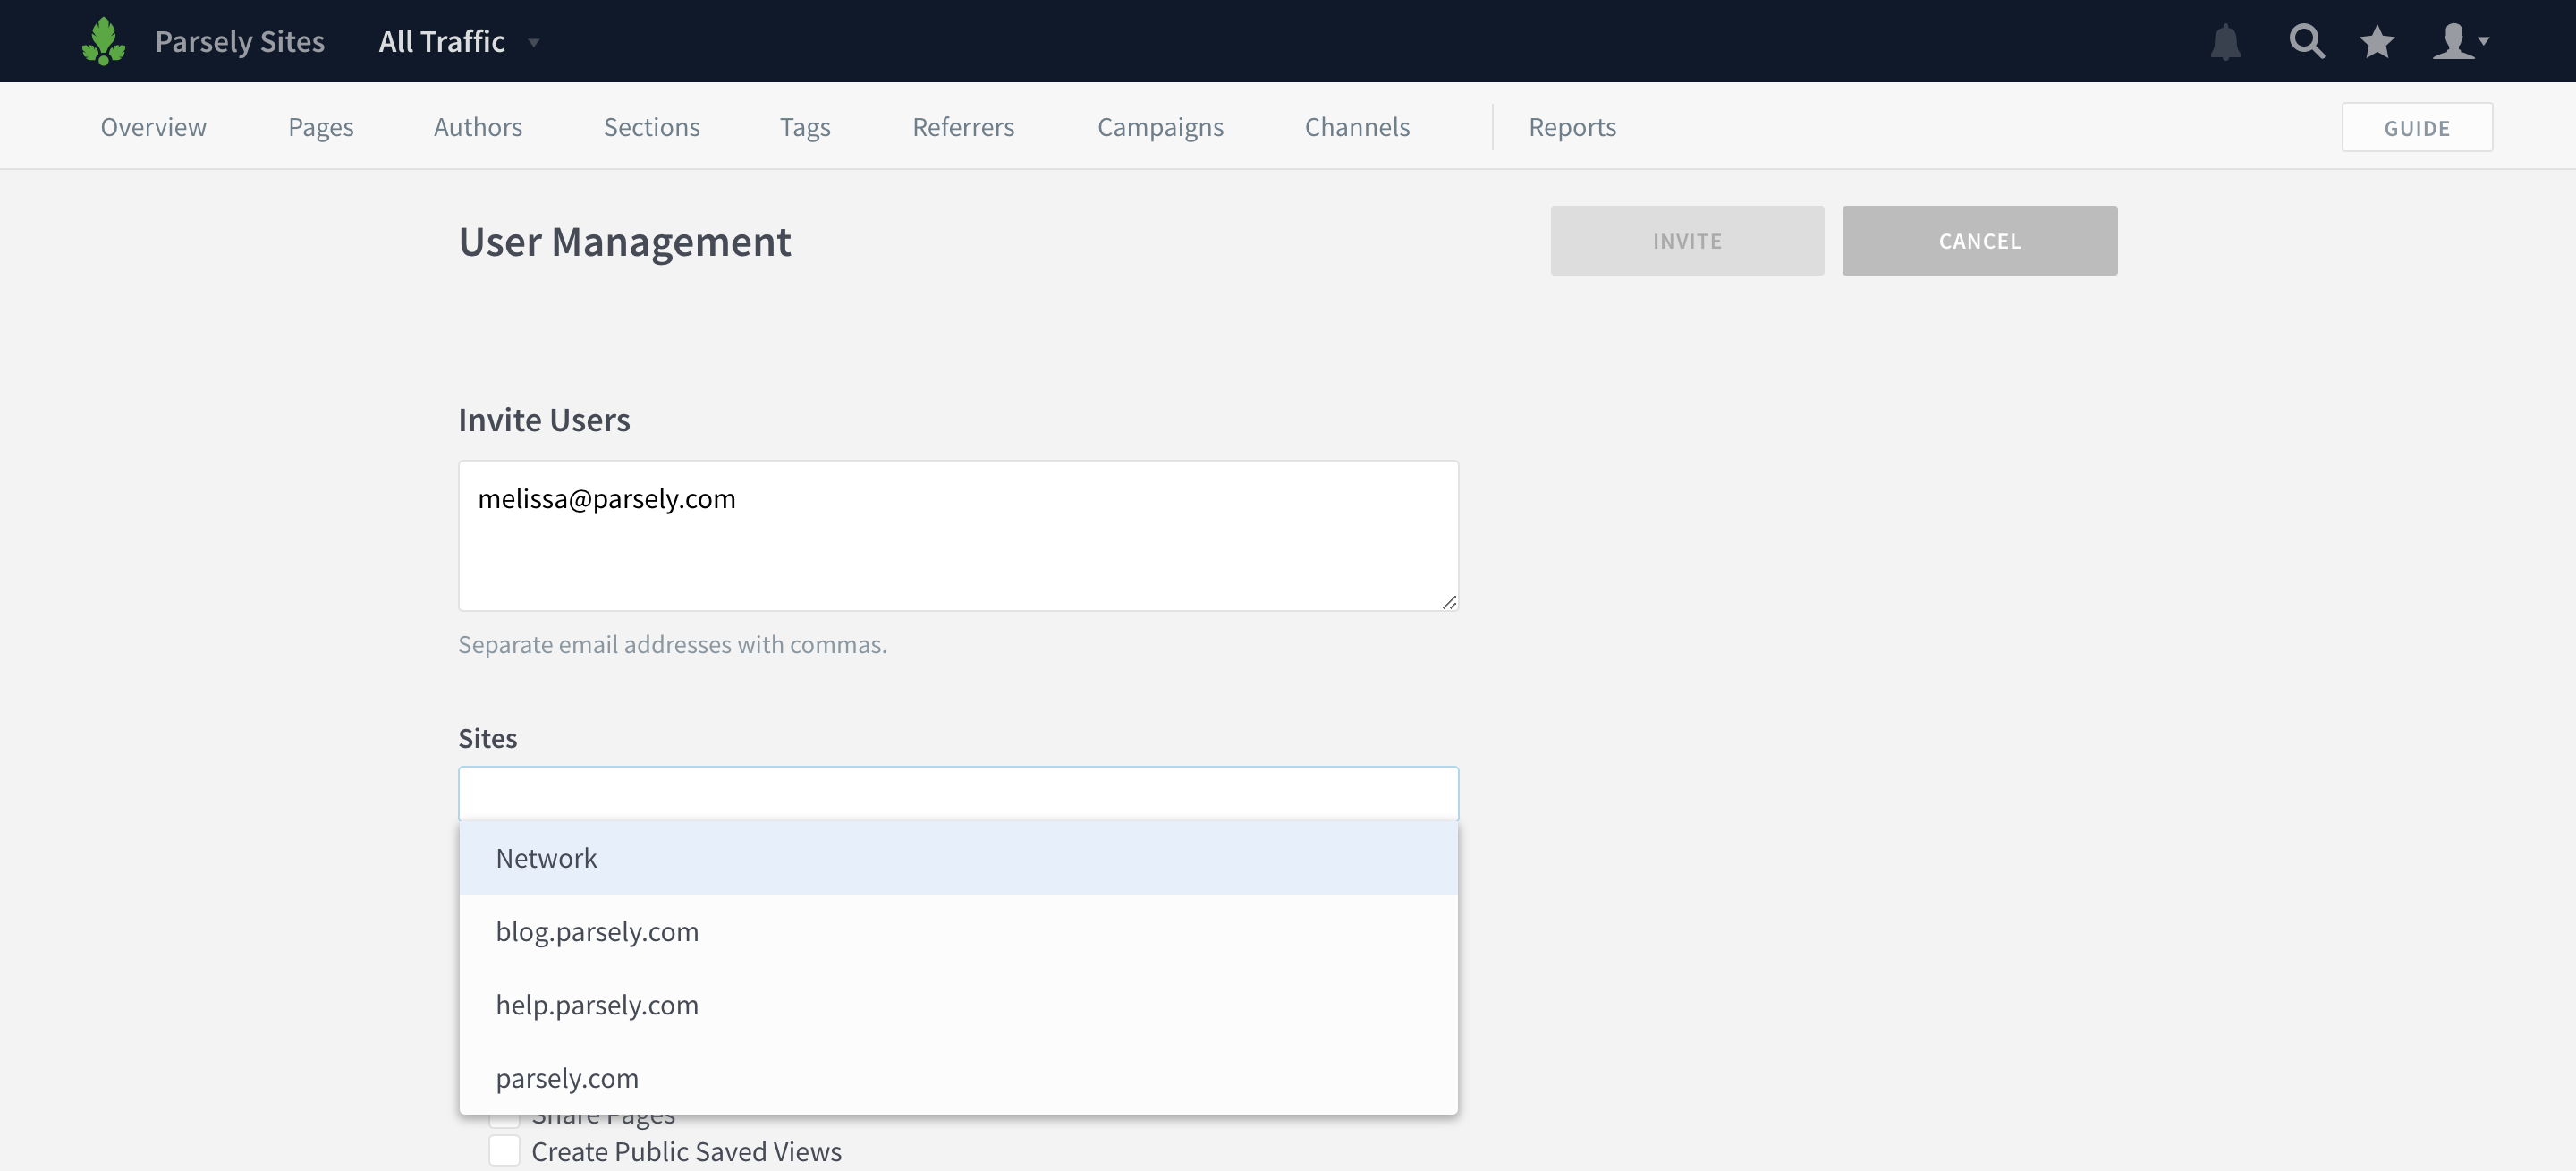
Network admins can now create “network users.” This is useful if you operate a large network of sites and want to grant users access to all current and future sites.
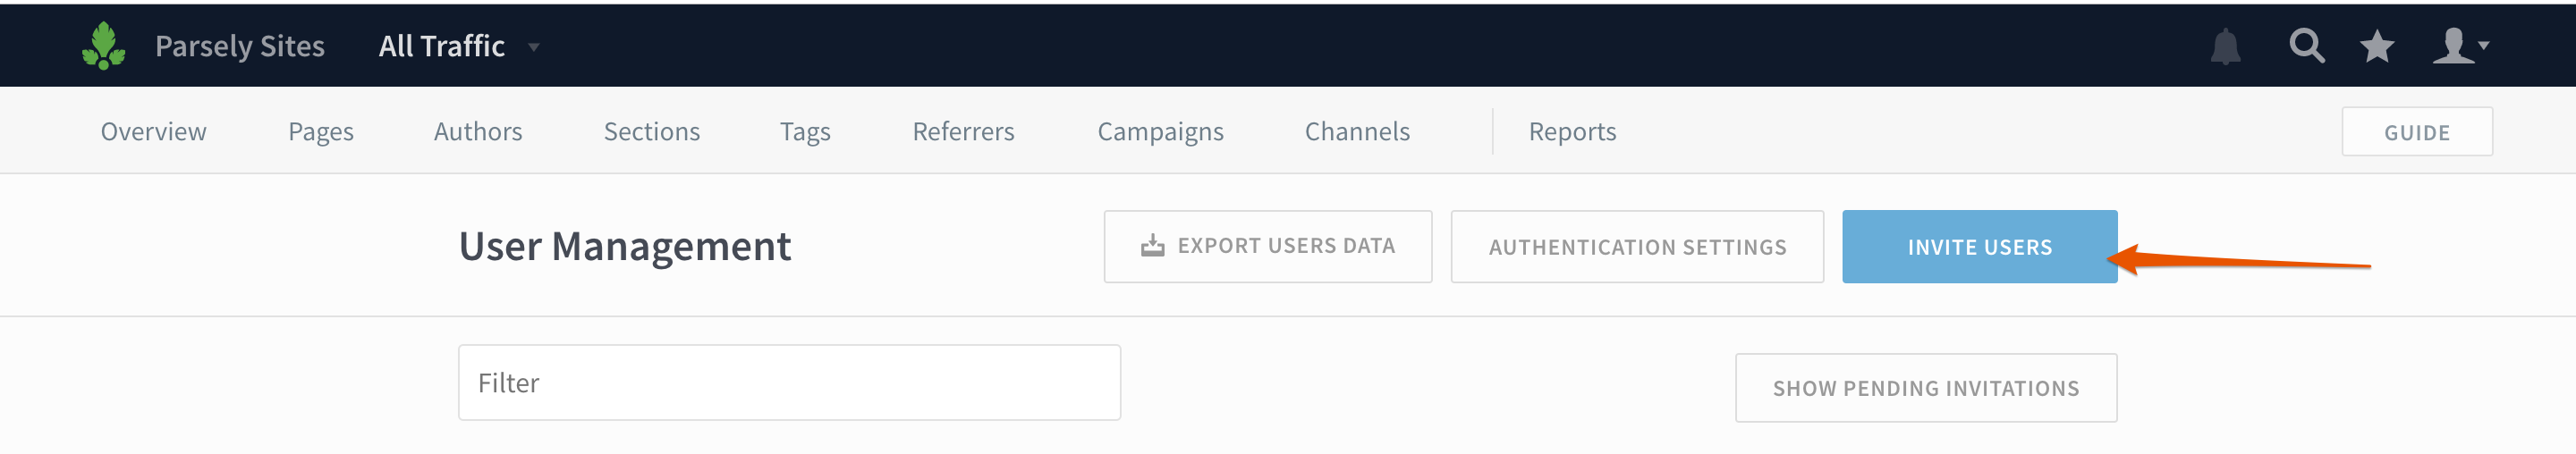
From the network-level Users page (tip: if you see “All Traffic” in the top left corner, you’re on the network level), click Invite Users.
Type in a list of user email addresses and select Network from the Sites dropdown.
You can create multiple network users at once, and assign them specific permissions on the network-level. Click Invite when you’re finished.
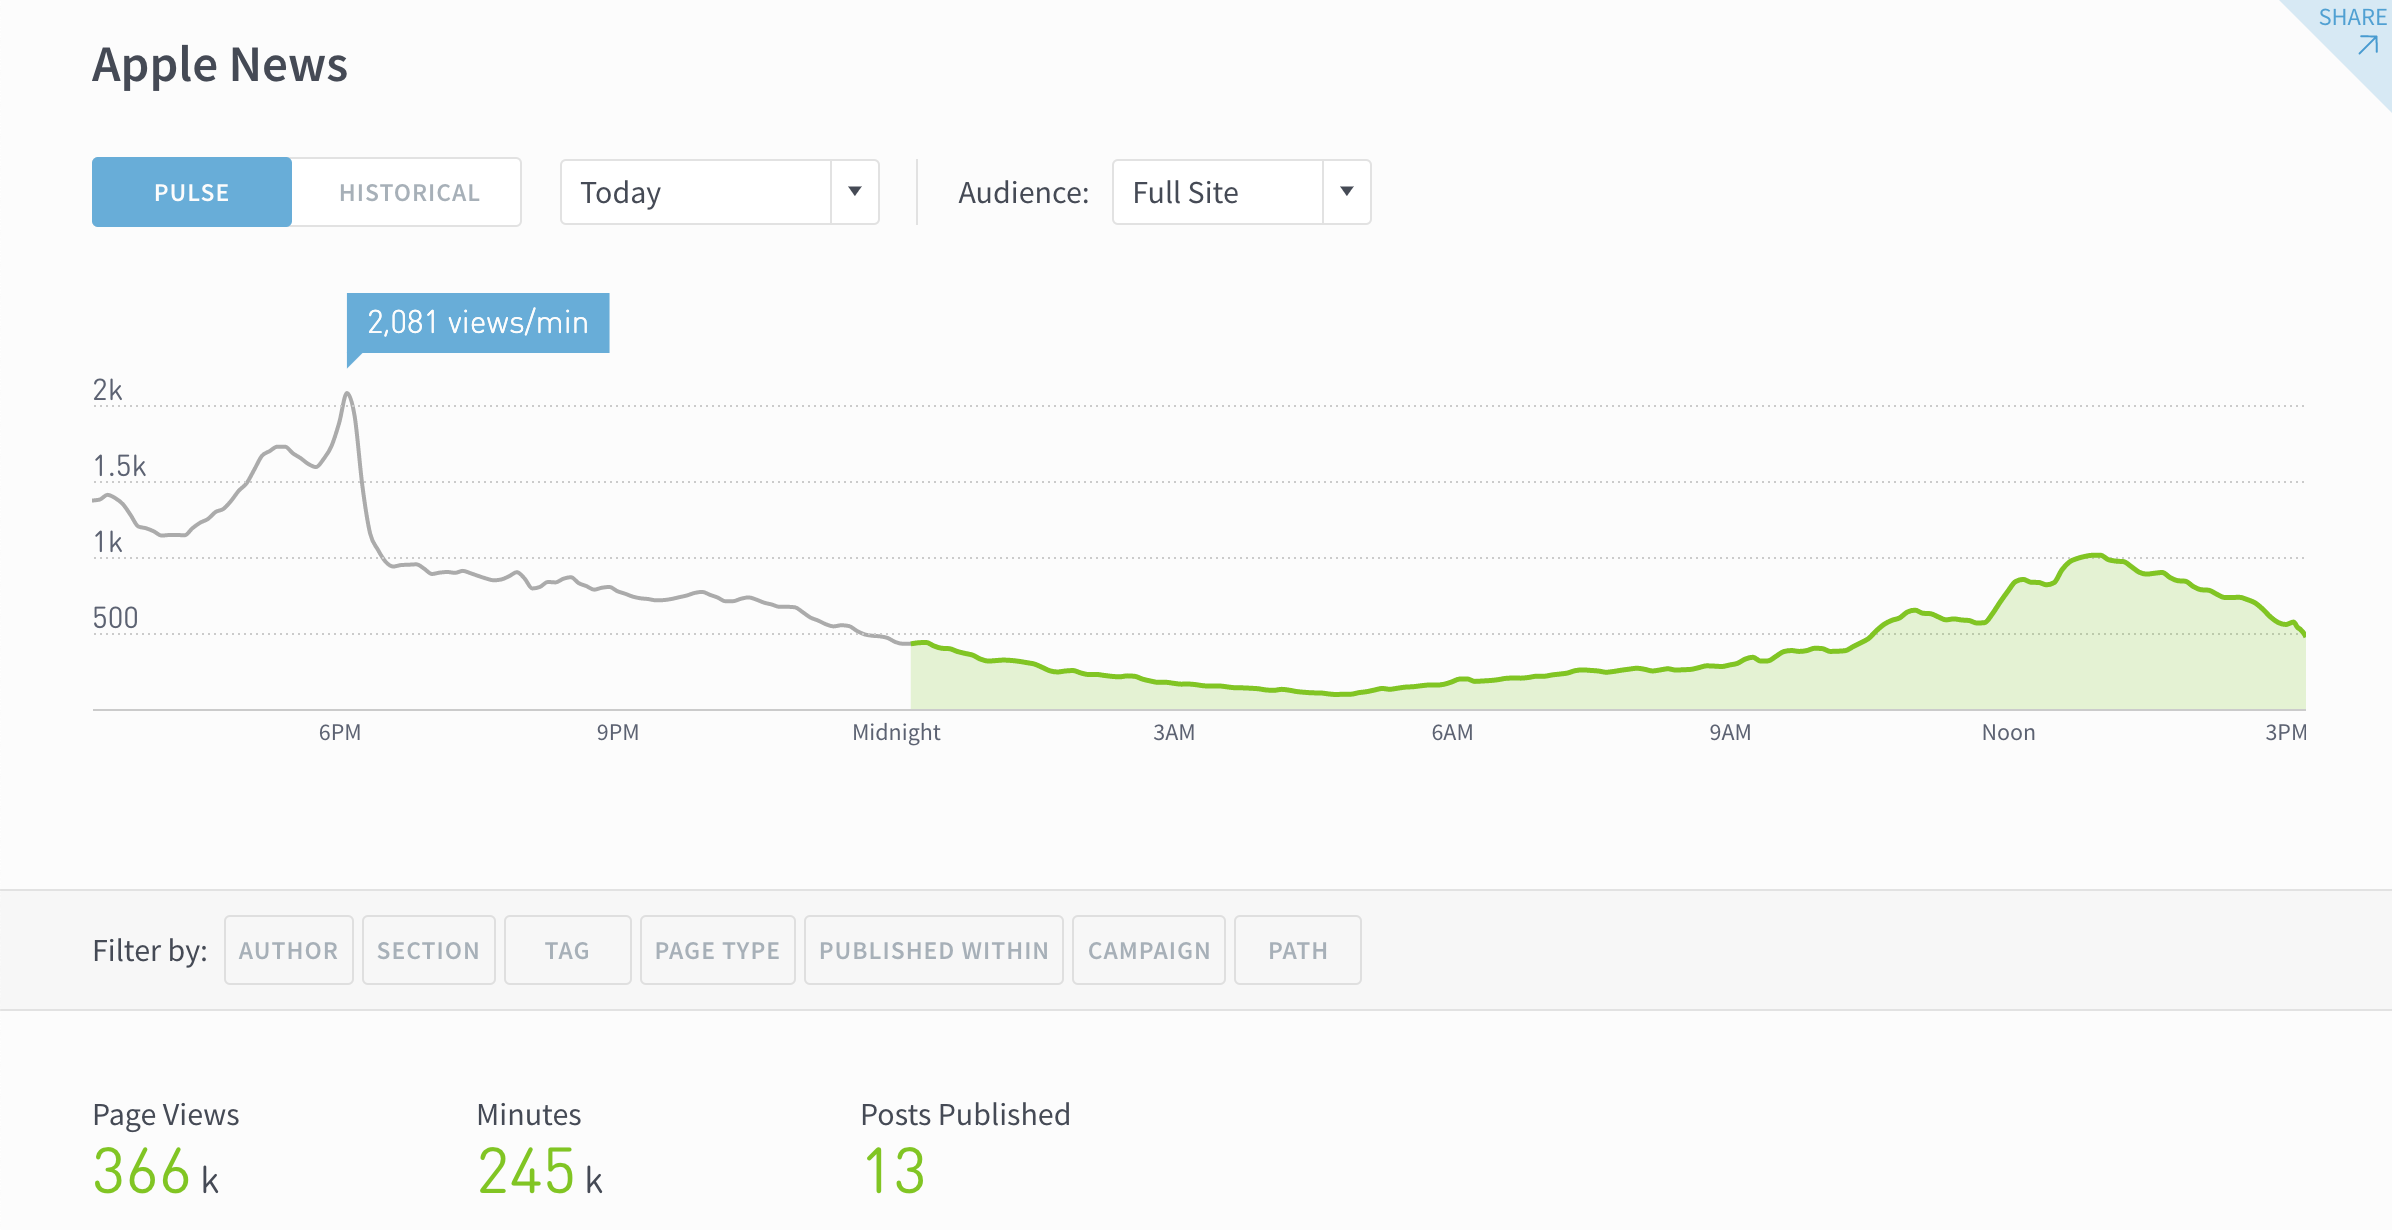
Parse.ly now supports Apple News analytics, including real-time and historical
Page Views
Total Engaged Minutes
Avg. Engaged Minutes
Apple News analytics are available at an additional cost to Parse.ly Enterprise customers. Reach out to your account rep or fill out the form in this product announcement to learn more about pricing.
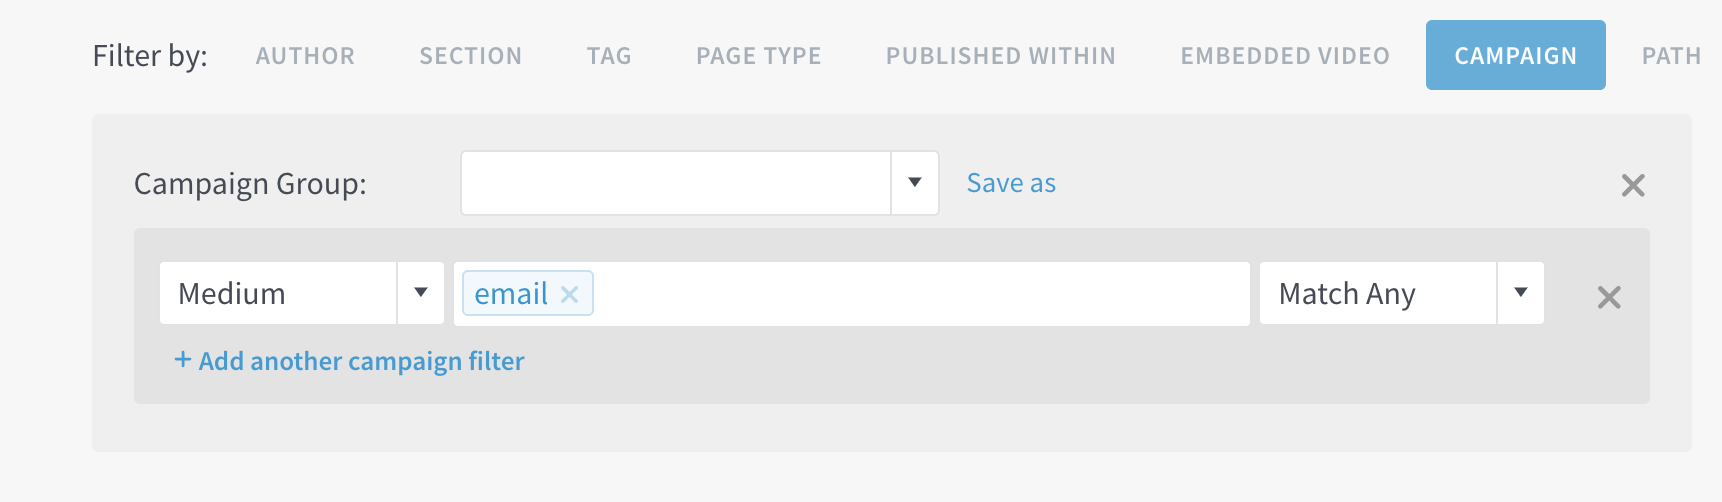
You can now filter by individual campaign parameters (e.g. campaign, medium, source etc.) on any listings page. Click “Save as” to create a new Campaign Group or update an existing one on the fly!
Click Show individual campaign fields. (Or pick an existing Campaign Group.)
Add fields.
If you want to save or update the group, click Save as.
You’ll then be prompted to update or name your new Campaign Group.
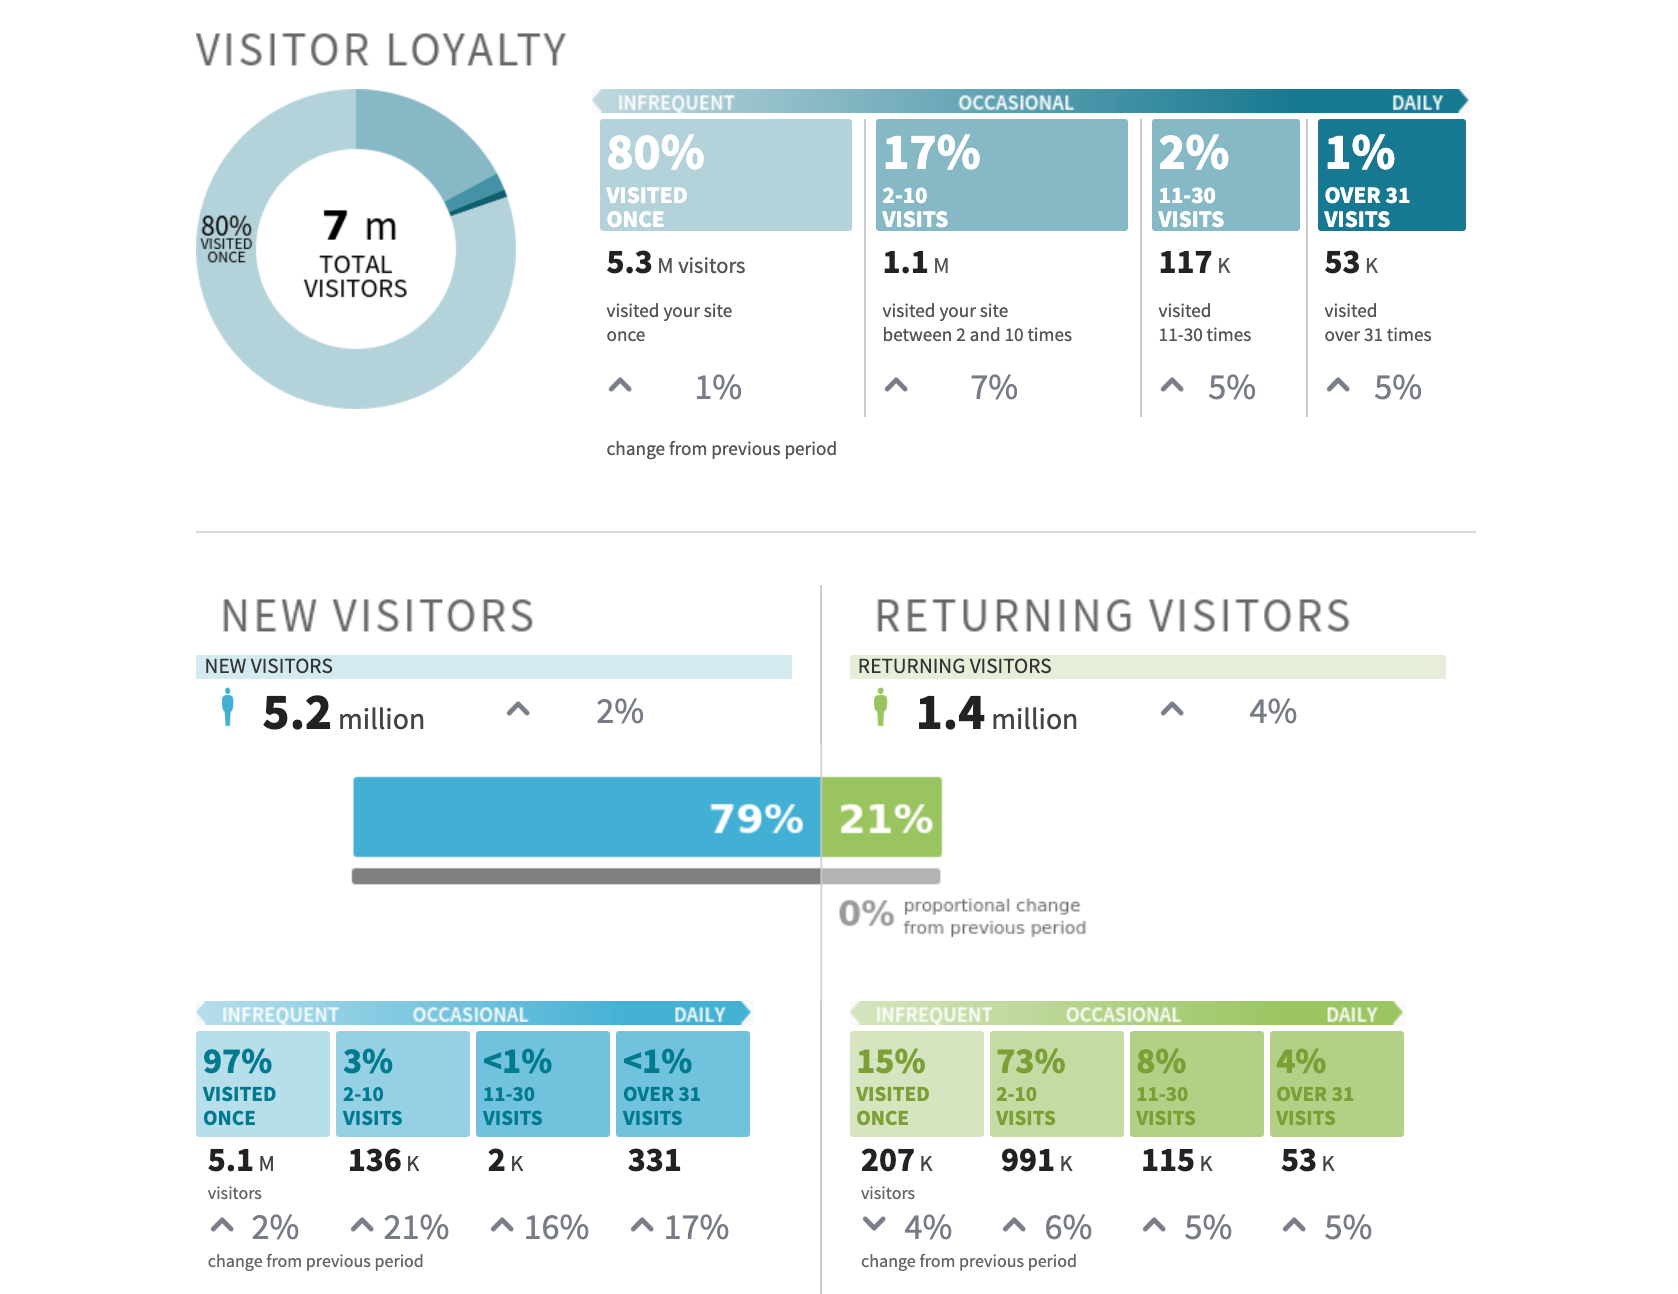
Audience Overview report
On September 4th, all Parse.ly Enterprise customers can run a report to get a better understanding of loyalty and visitor behavior for August 2019. Schedule this report to run monthly to receive it automatically in future months! (You can find it in the reporting suite under Advanced.)
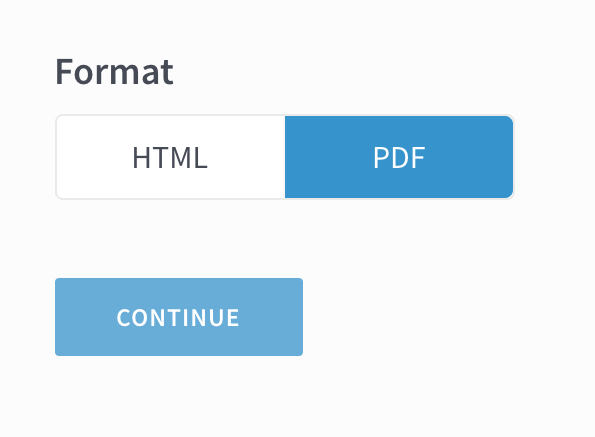
PDF reports
There’s a reason the PDF has been around since 1993. It’s easy to save, store, and forward to your colleagues. And now you can do that with your Parse.ly reports!
All you need to do is select PDF as the format when you create a report:
Export a spreadsheet of Parse.ly users
Need to get a better understanding of your organization’s Parse.ly usage? Admins can now export a list of Parse.ly users from the Users page.
Click the account dropdown on the right.
Click Users.
Click Export user data.
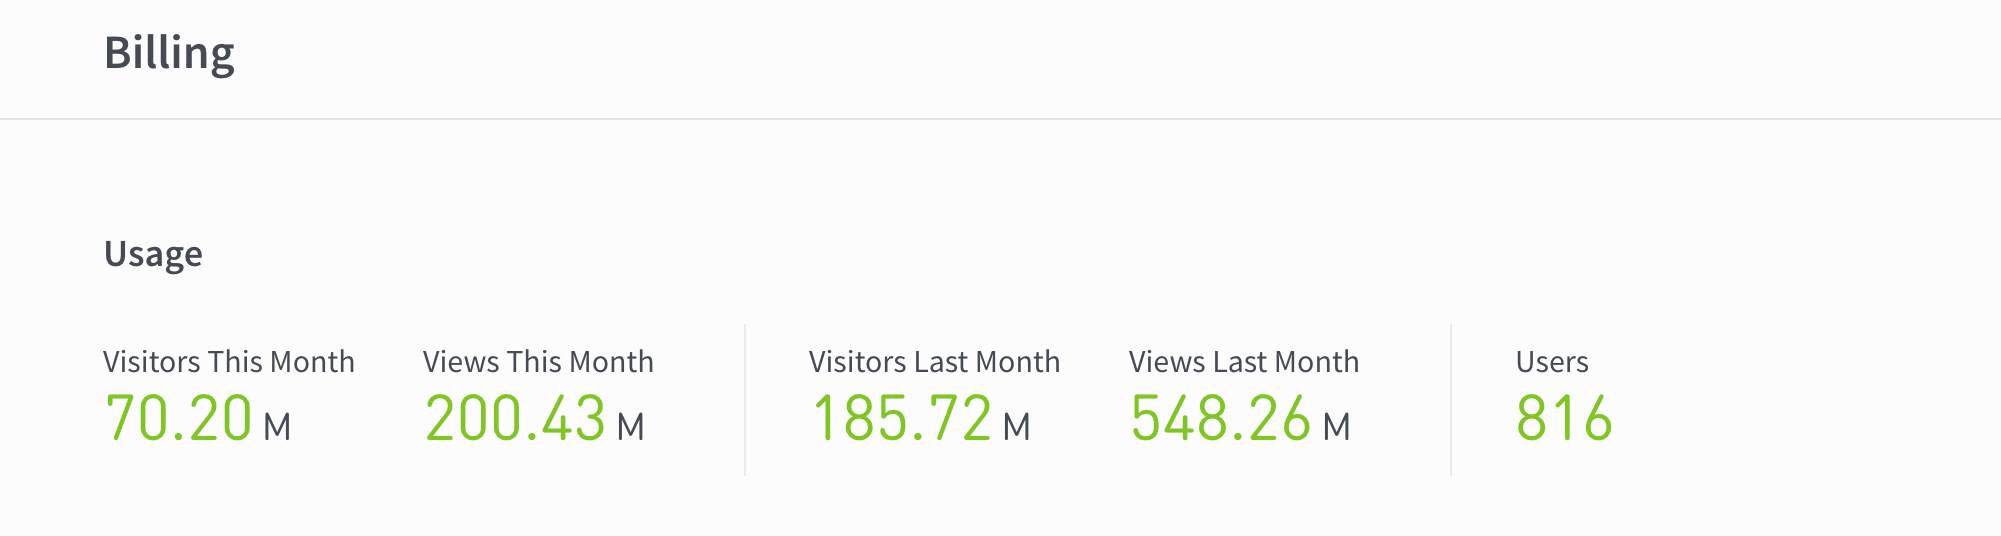
Check your organization’s Parse.ly usage
On the Billing page, admins can now see the visitors and page views for this month and the last month, as well as total users.
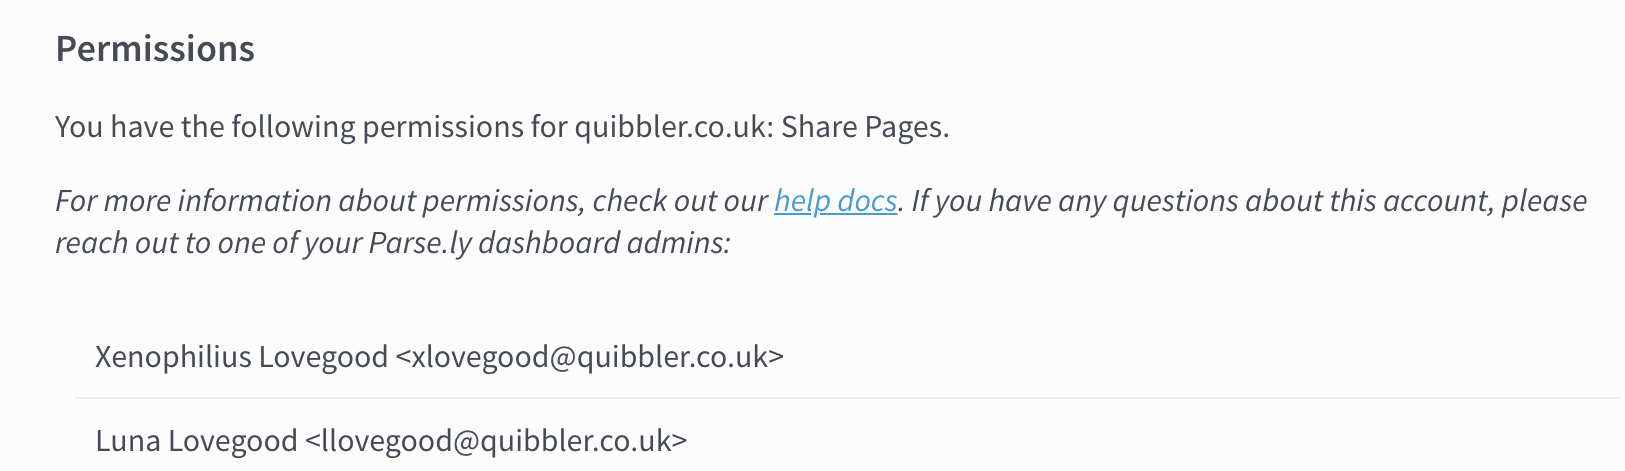
For those who have ever had a question about Parse.ly but but weren’t sure who to ask, this update is for you! Parse.ly now shows a list of your permissions and admins on the User Settings page.
Click the account dropdown on the right.
Click the cog next to your email address.
From this page, you can change your password, see your permissions, and get a list of the names and email addresses of your Parse.ly admins.
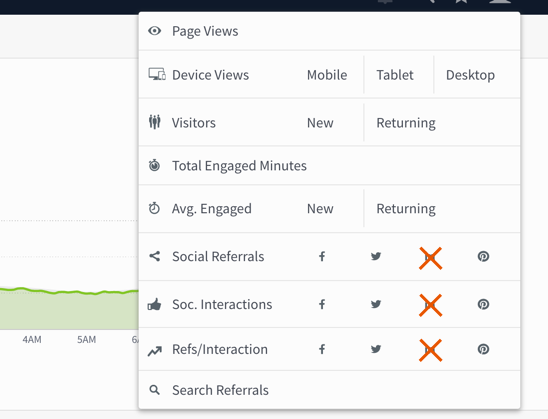
LinkedIn removed from social sort metrics
We’re removed both LinkedIn interactions and referrals from social sorting metrics because LinkedIn shut down an API providing social interaction data for all third-party tools and vendors, not just Parse.ly. We made several attempts to re-gain access to this data by working with LinkedIn’s content and news partnerships team, but we were unsuccessful. Therefore, we had no choice but to drop support for this metric from our product.
Moving forward, Parse.ly will continue to support interactions and referrals as sort metrics for Facebook, Twitter, and Pinterest.
Parse.ly will treat LinkedIn like any other referrer (such as Instagram or Reddit). You will be able to see LinkedIn referrals:
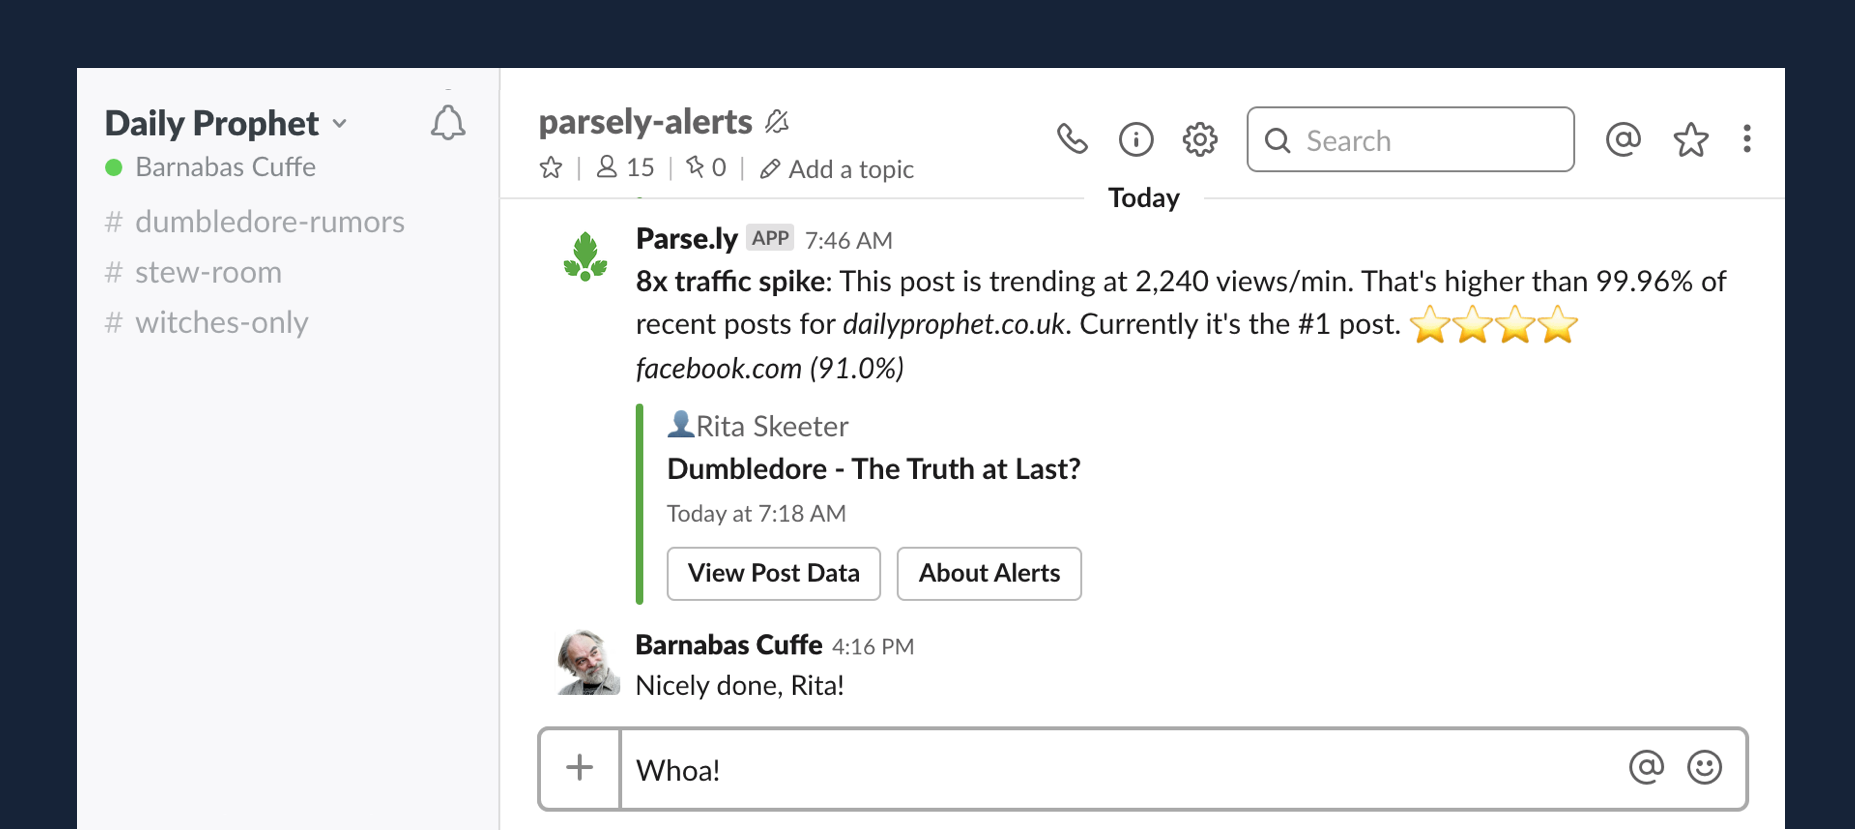
Alerts keep you informed about notable traffic to your content. You can now choose to receive alerts on your browser, on your mobile phone, in Slack, or in email when posts receive significantly more traffic than usual.
Learn how to subscribe to alerts and how alerts work:
When creating a scheduled report, you can now add a custom subject line to the report that will appear when the report arrives in your emailbox.
The new option appears at the bottom of the Parameters screen when creating or editing a report.
The custom title will also appear in the Recently Run and Scheduled tabs in the dashboard interface and will be the title that appears on your HTML report.
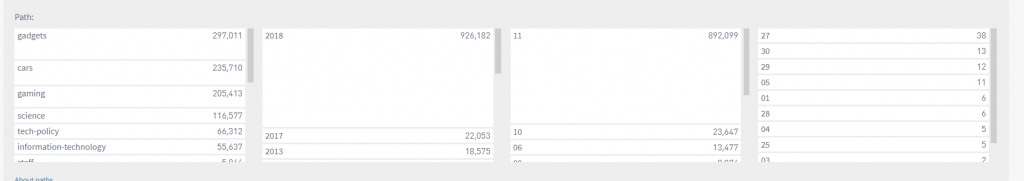
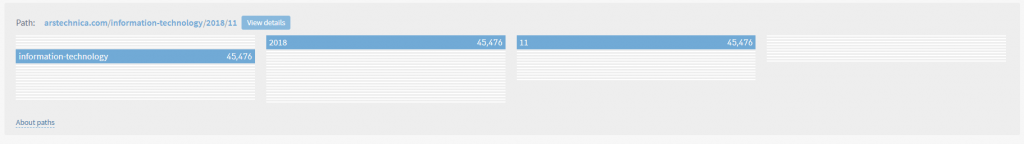
Two notes about fragments: 1) Data is only available since Oct. 1; 2) Your site must have a URL structure where paths are present in order for data to be available.
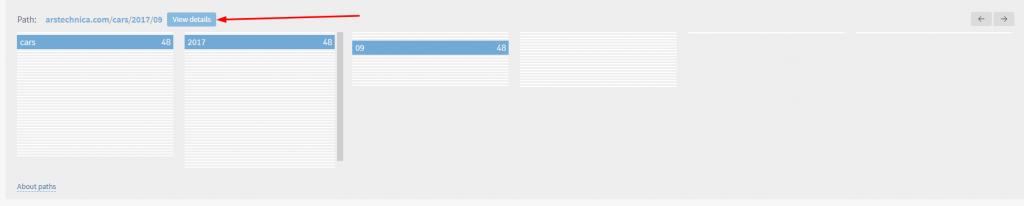
Path fragments are displayed like this:
When making a selection, the list of fragments will immediately narrow to show only the lower-level fragments that appear with the selected fragment.
The height of each row shows the popularity of the fragment compared to other fragments. That is, the taller the path fragment’s box, the more page views it received (or referrer views when on a referrer detail page) relative to the other path fragments.
Once you have selected a path fragment, you can click on the “View Details” option to see full information about URLs matching the pattern.
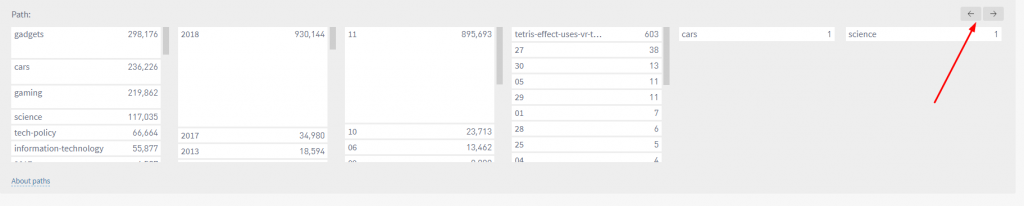
You can drill down as many levels as need be – additional levels can be added to the screen using the arrows in the upper right corner of the Paths box.
Paths are available as a filter in all sections of the dashboard as well as in the reporting suite.
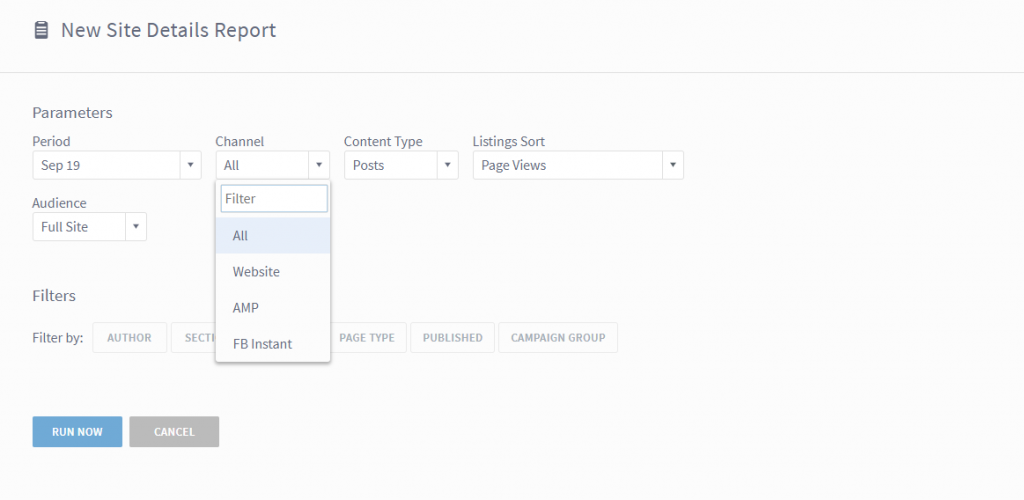
In the reporting suite, you now have the option to see data specifically for Google AMP or Facebook Instant – or specifically without both channels. September 18, 2023 Update: Facebook Instant Articles is deprecated.
In Top Listings, Details and Stats Over Time, these new options are now available, giving you increased visibility into the impact of your efforts on those platforms.
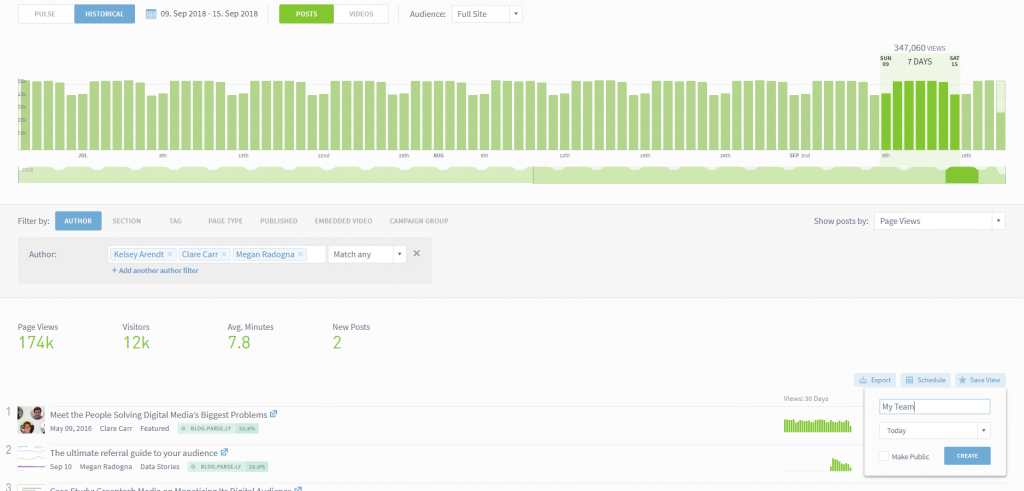
Saved Views
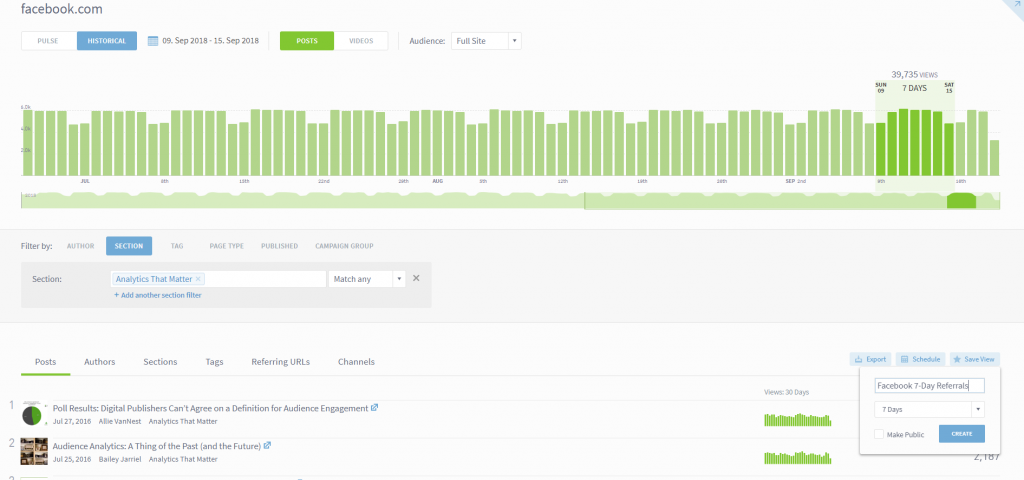
You now have the ability to save configured views in the dashboard, a request we’ve heard from many users and the highlight of this release.
You can now, for example, set up a combination of filters once and not have to redo those configurations each time you use the dashboard. Perhaps you want to quickly see what stories in a specific section received the most traffic from Facebook during the past week. Easy enough:
Or perhaps you want to track a specific group of authors on a single screen. Again, easy to set up and save:
Simply save the desired view and decide whether to share it with the rest of your organization or keep it for yourself.
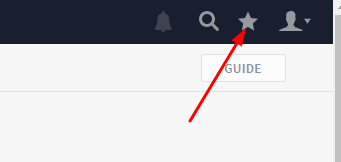
Once you save a view, you can access it by using the star in the menu in the upper right portion of the screen:
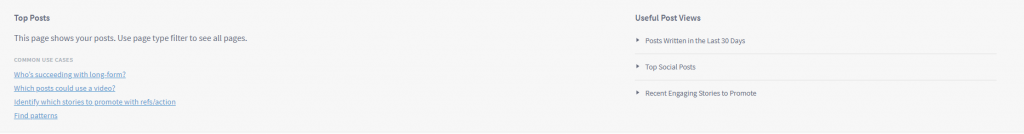
Useful Views
In the Guide tool, we’ve also added some quick clicks to popular views. Think of these as useful filters to help you easily find the information you need:
These appear in each dashboard screen where the Guide button is available.
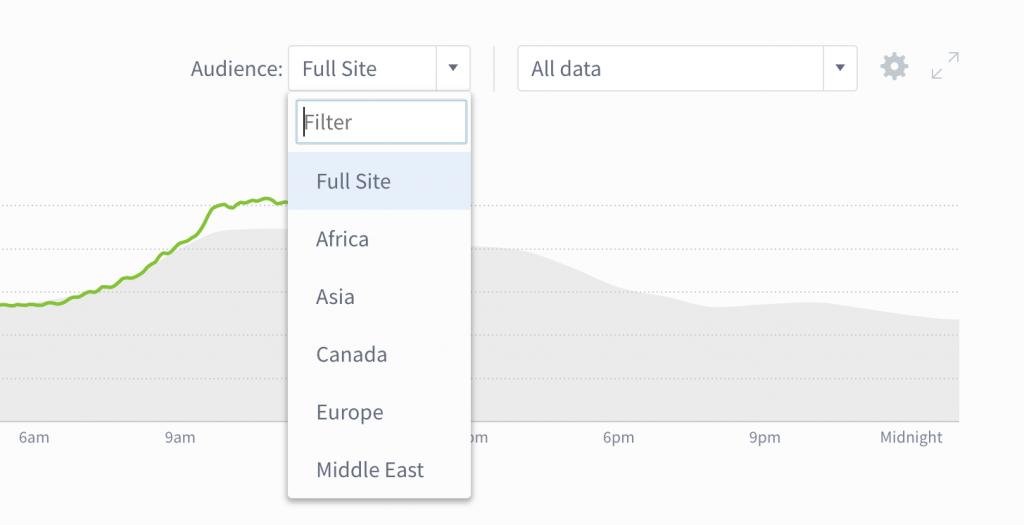
Often, it’s hard to pick out the habits and interests of niche audiences from sweeping aggregate trends. With audience segments, you can understand and optimize for audience subsets like subscribers, users, regional readers, and more.
This release aims to help you get more out of the reporting suite.
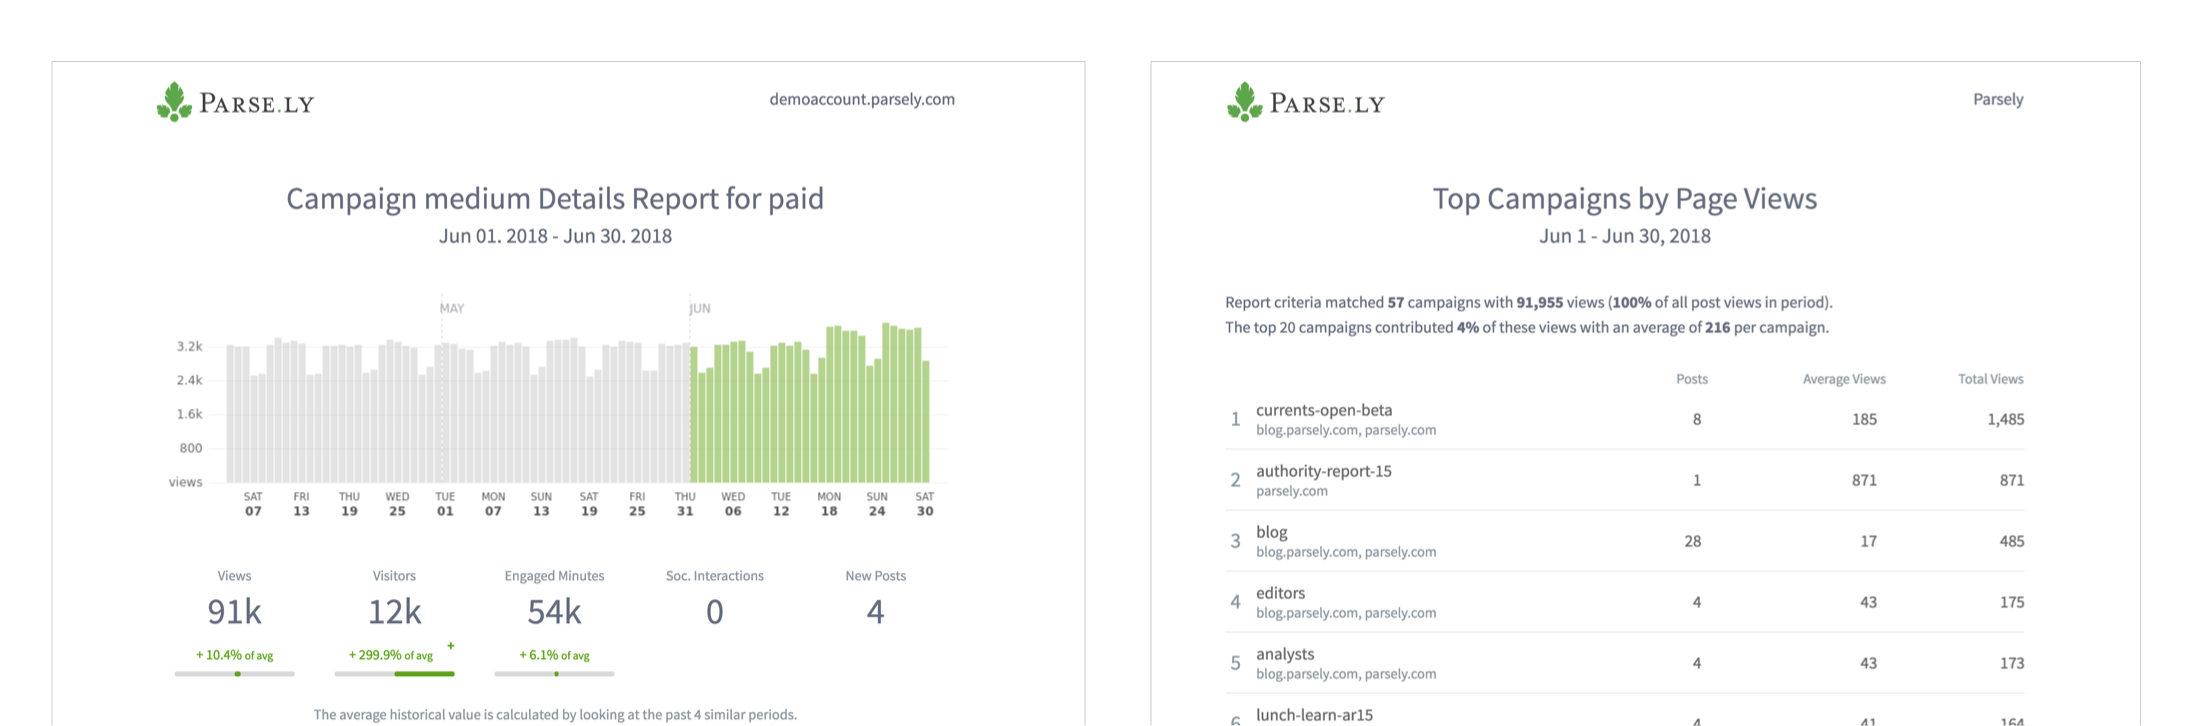
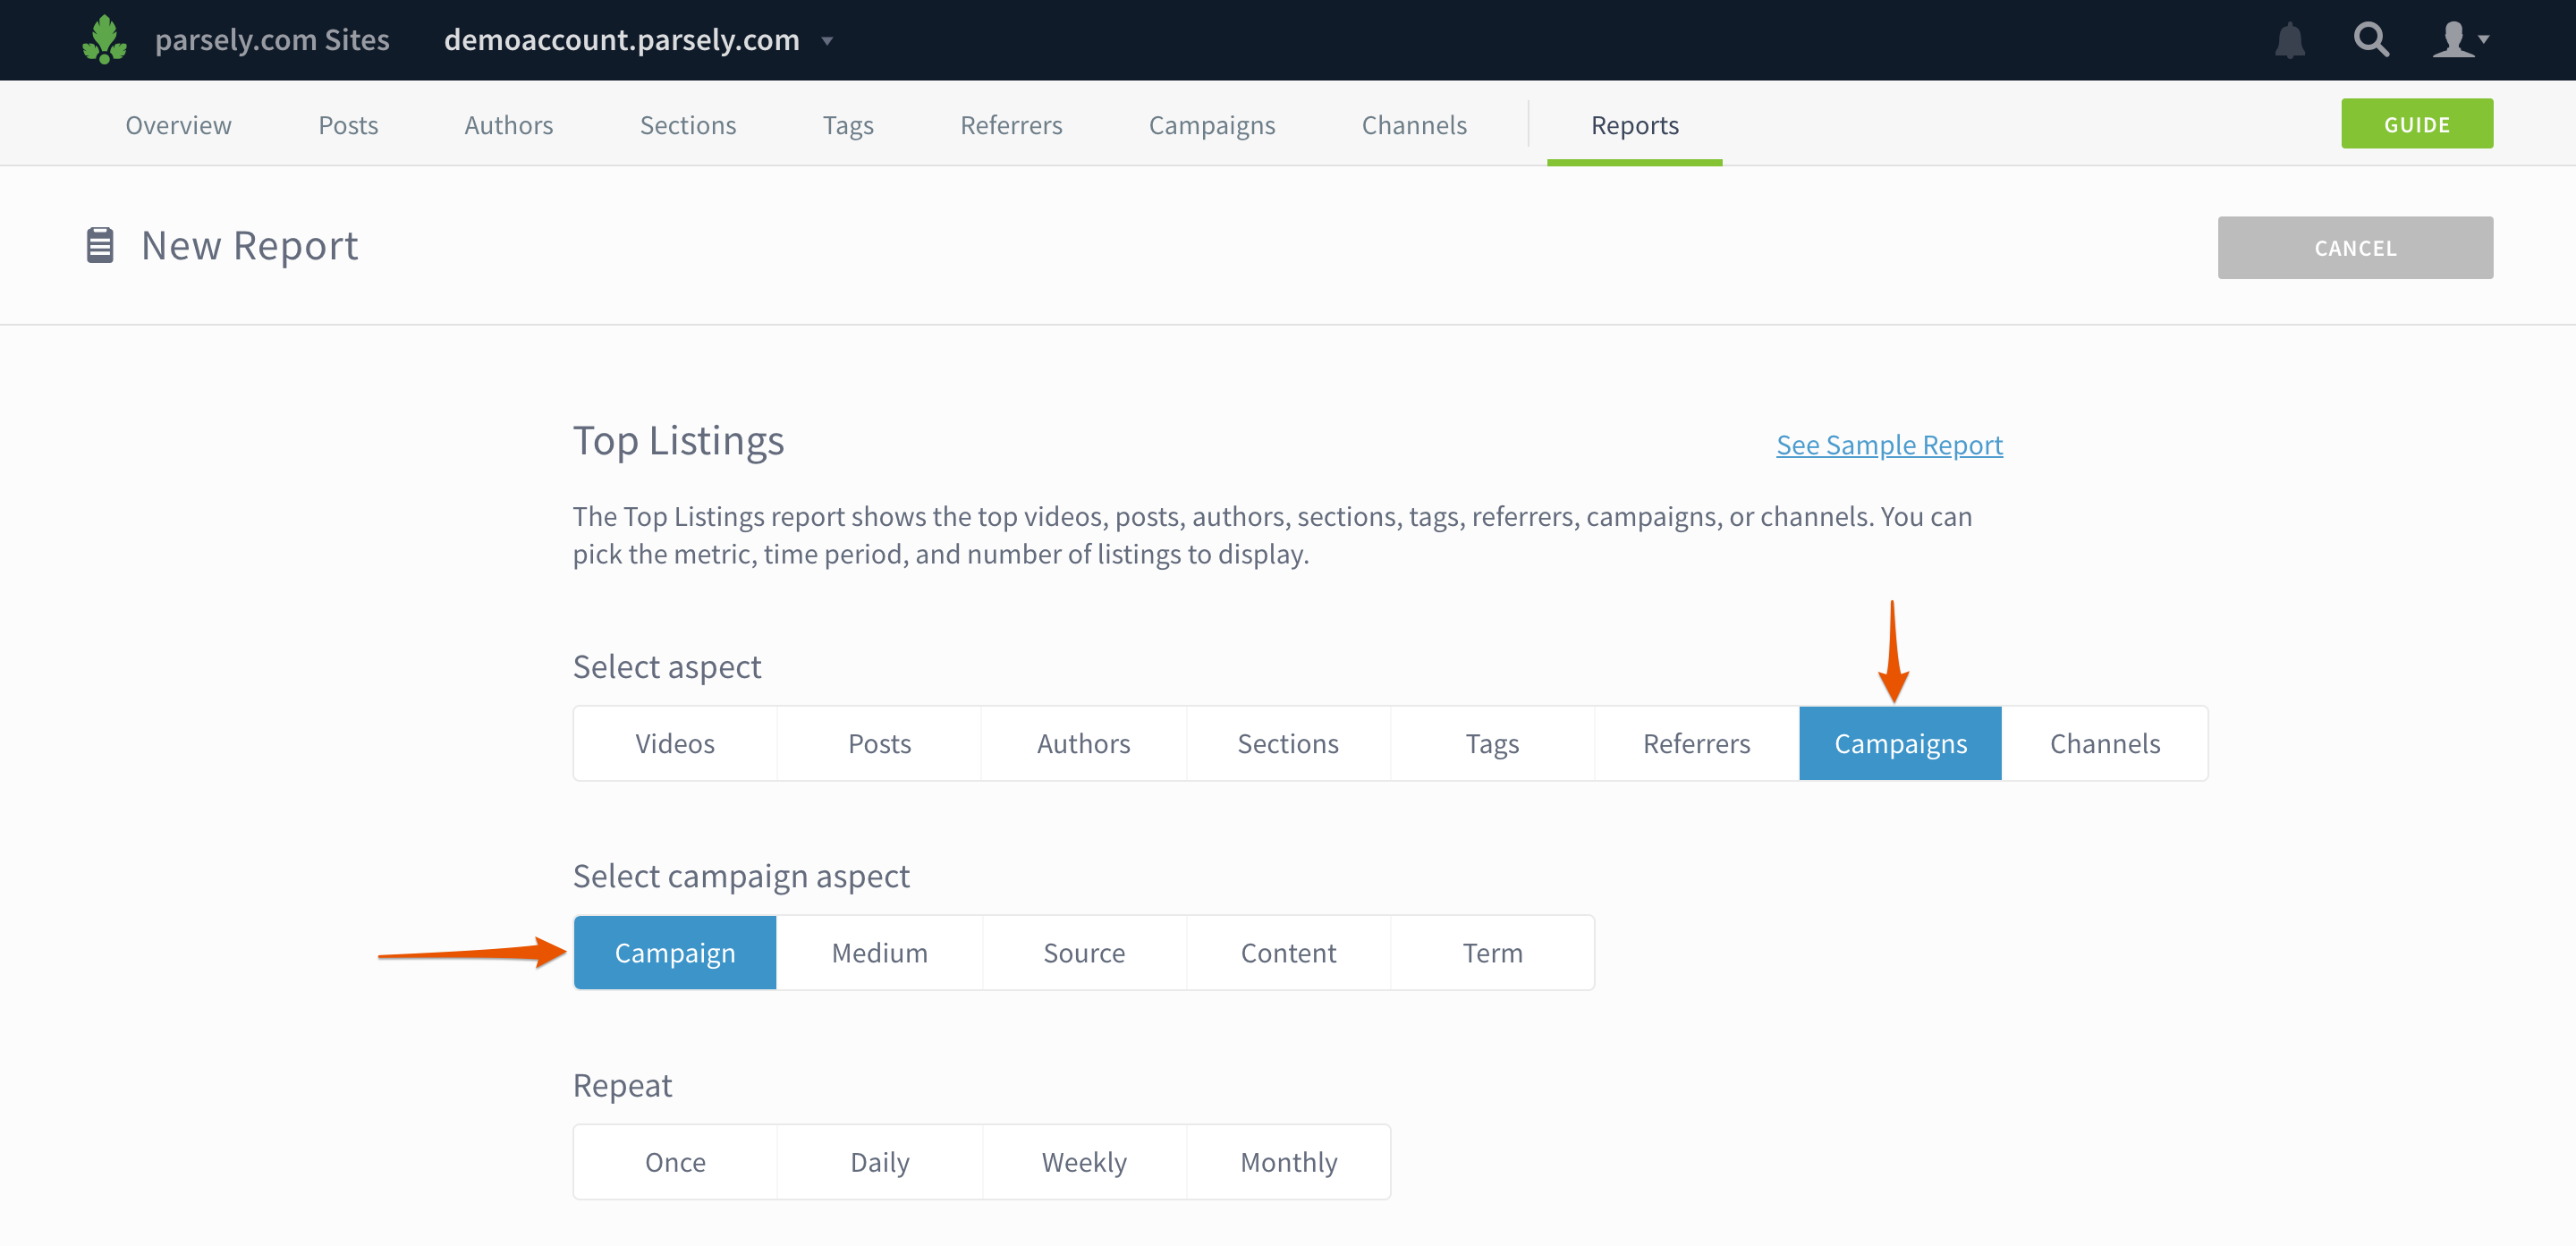
See campaign performance in Top Listings and Details reports
Get a high-level look at the top campaigns or dig into a detailed report on a specific campaign’s performance.
When you create a new report, you can add campaign data by selecting Campaigns and a campaign aspect. (Note: campaign data is not yet available for Stats Over Time, Evergreen Overview, or Audience Overview reports.)
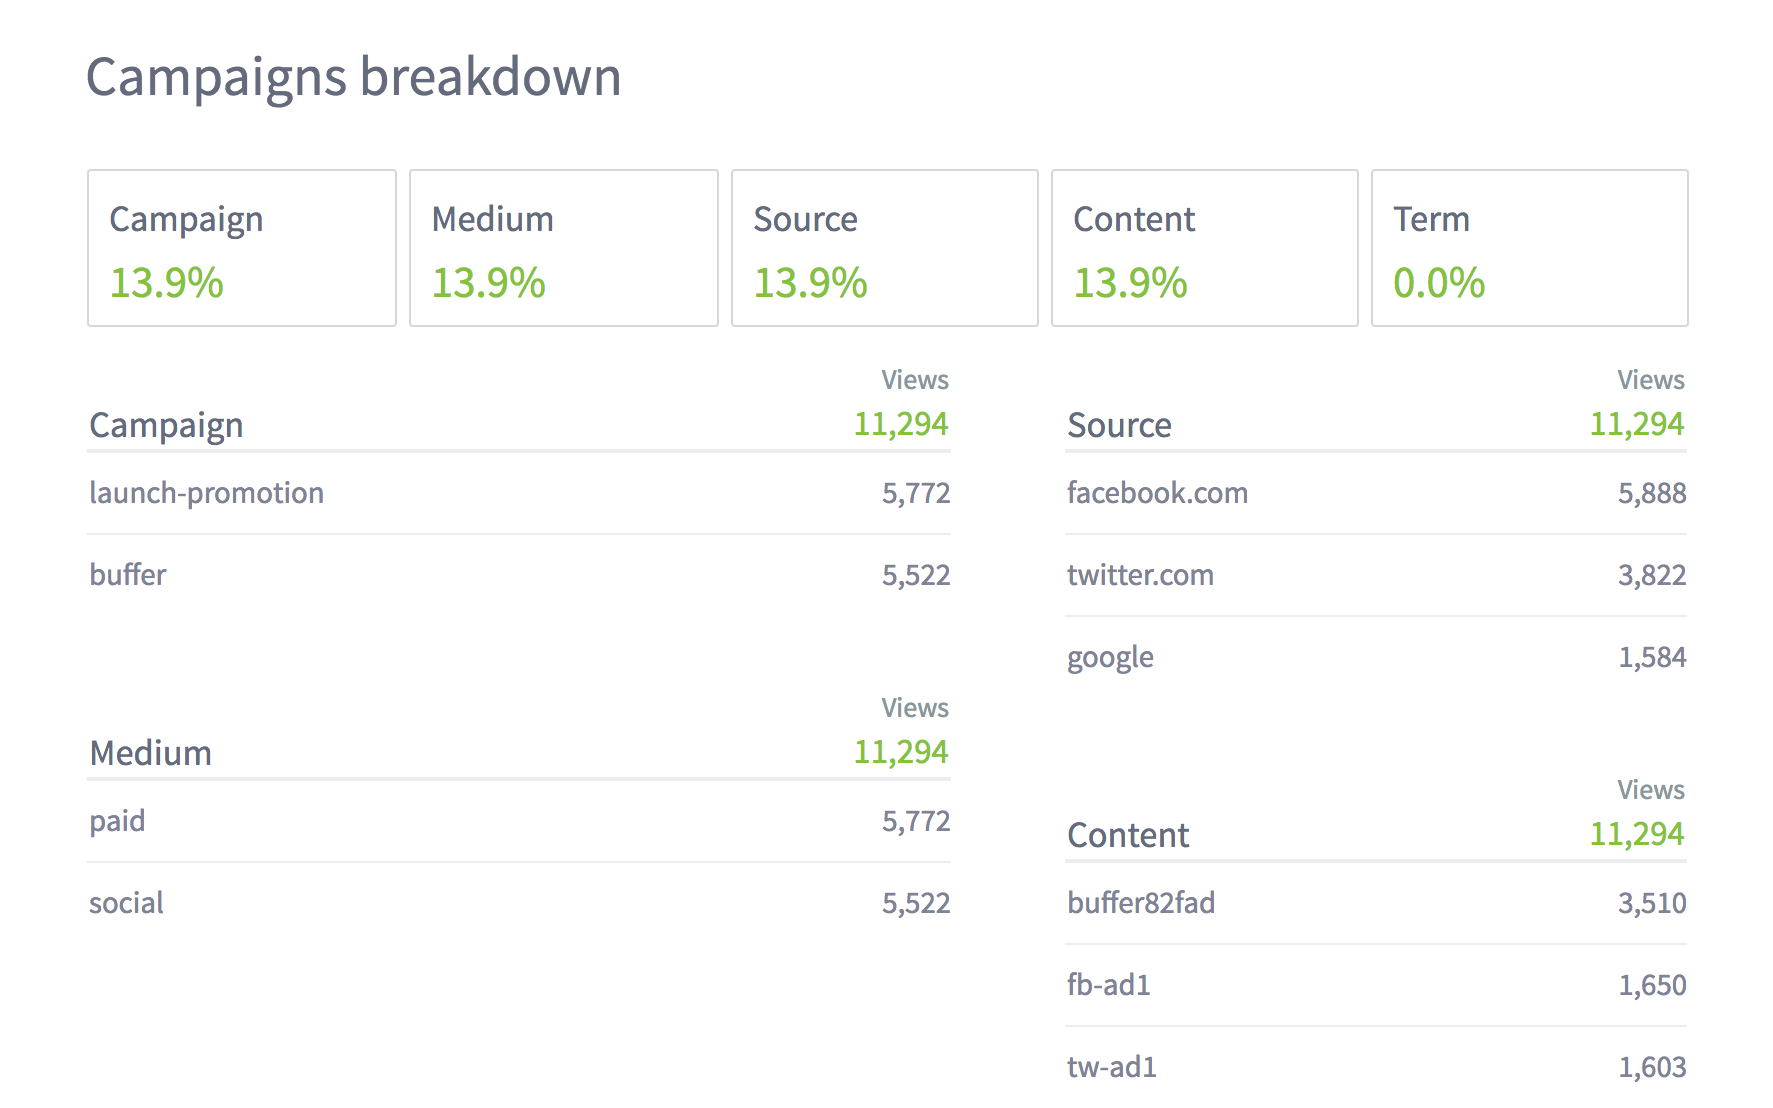
Campaign data also appears in all Details reports, so you can see the top campaigns by section, author, tag, etc.
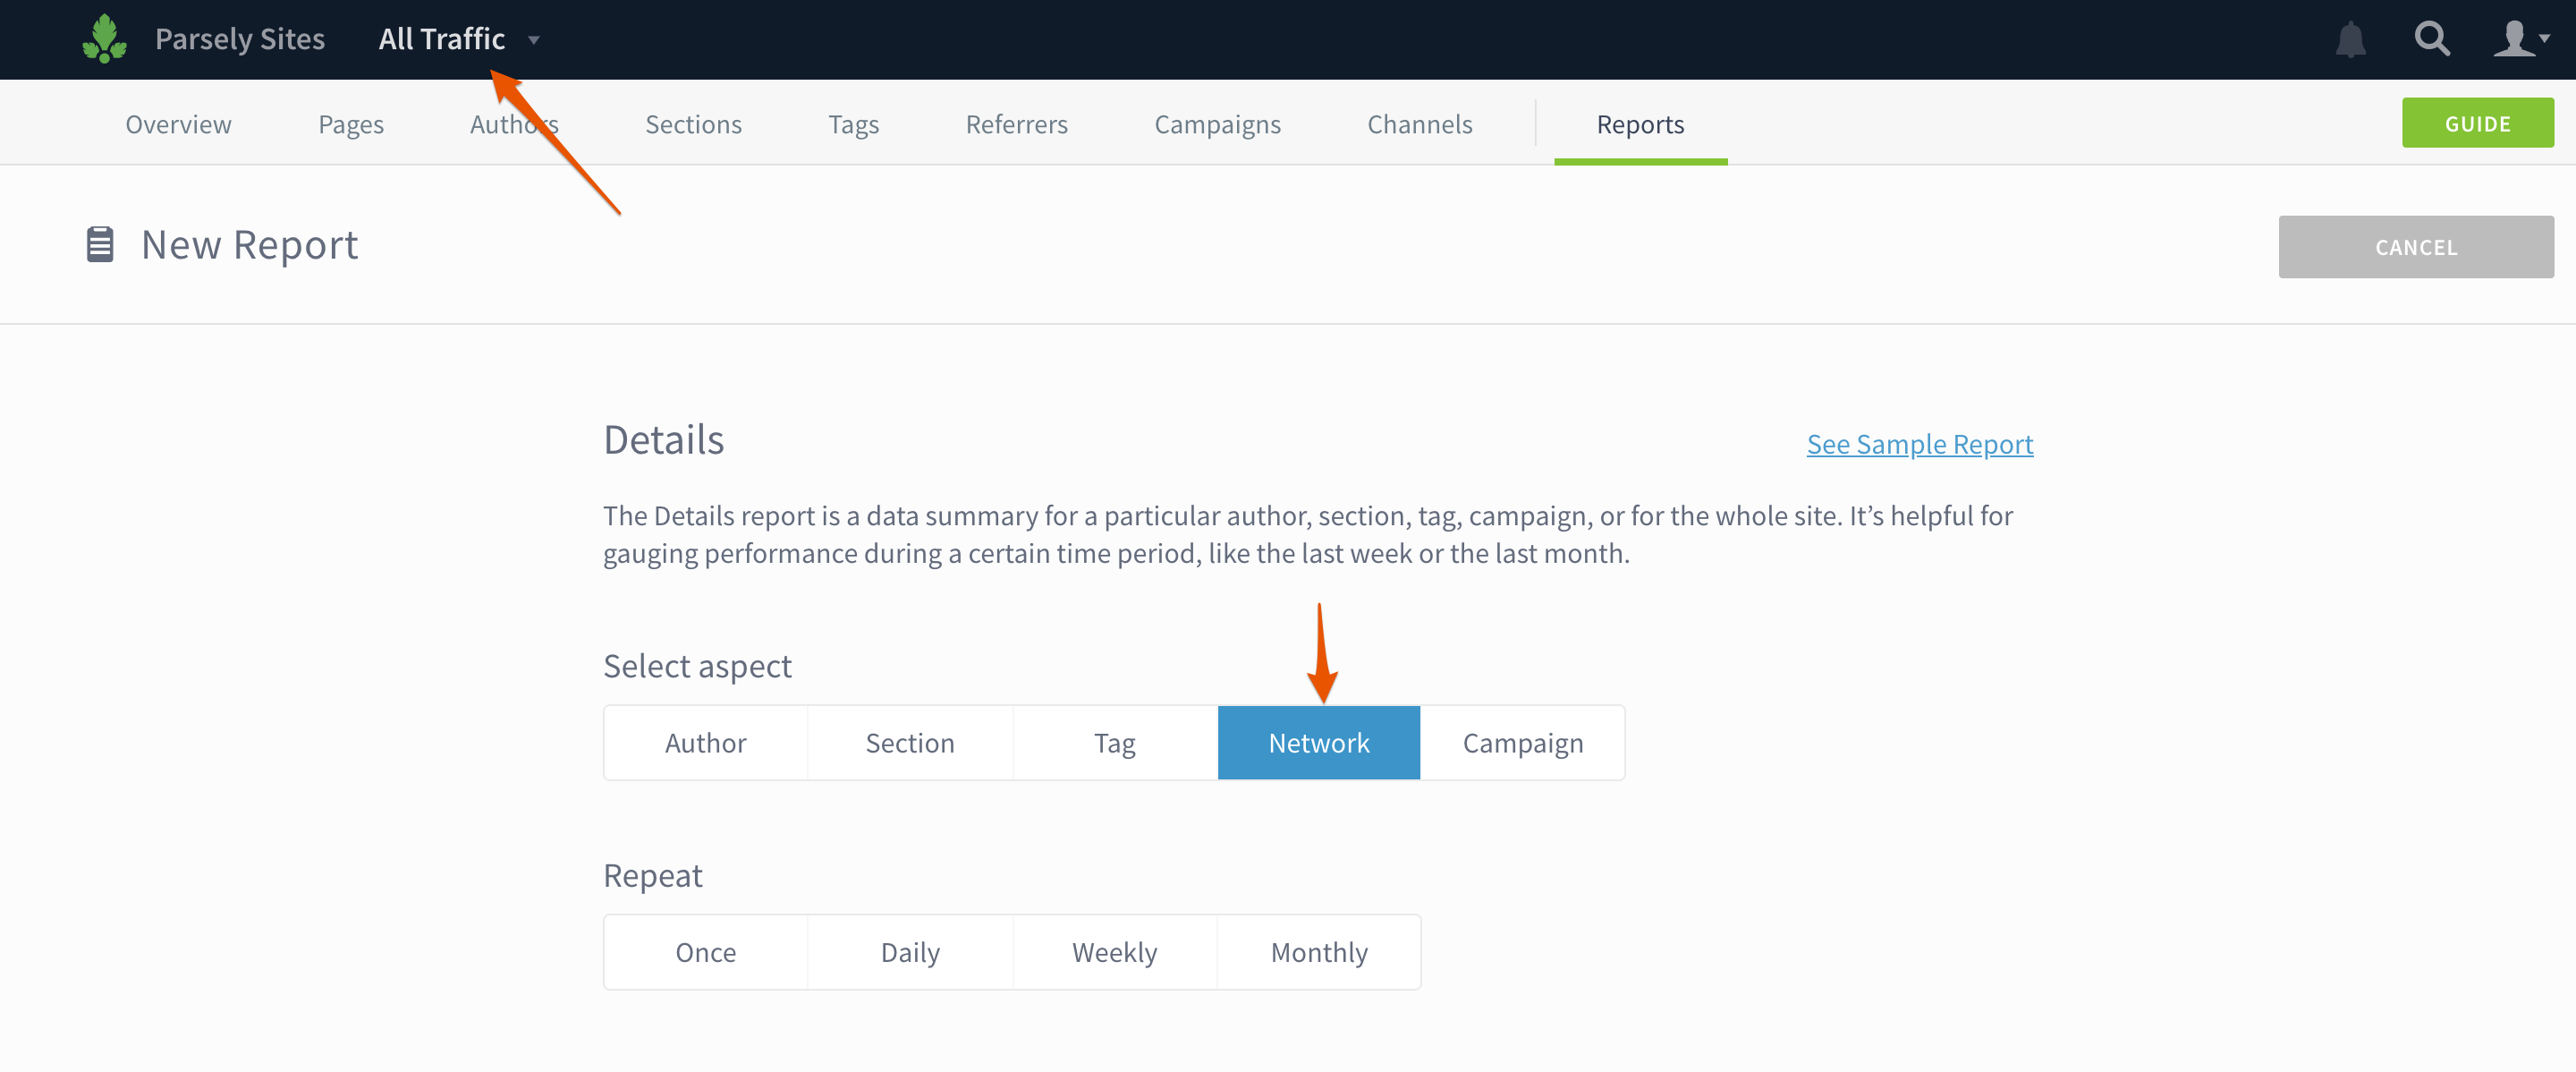
Create a Details report for your whole network or a site group
If you have Network Rollup enabled, you can see how content is performing across your entire network or a group of sites. Select All Traffic or the site group name in the drop down and then select Network or Site Group when you create a Details report.
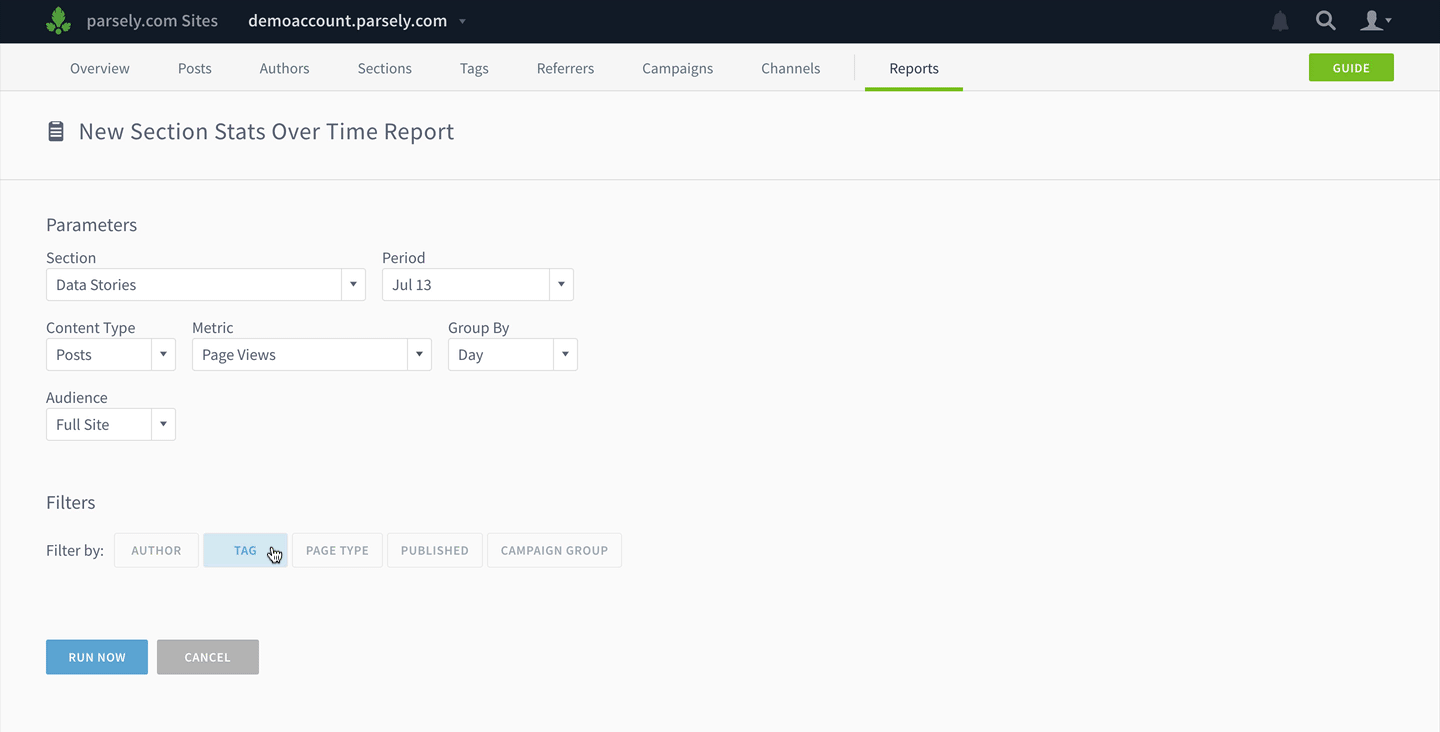
Filter Details and Stats Over Time reports
Add filters to your reports to show the performance of certain topics in a section, specific sections for an author, etc.
Other improvements
Stats Over Time reports and exports now contain a column showing the number of posts published in the selected interval.
Export Top Listings directly from author, section, or tag details pages.