Social data: pageviews, interactions, and referrals
One of the most popular Parse.ly uses is analyzing social data in networks like Facebook, Twitter, and Pinterest.
This is a popular use case because these social networks tend to result in new visitors. They tend to have a “viral coefficient” that allows your content to spread outside of its typical sphere of influence. Read more about social data and real-time content analysis.
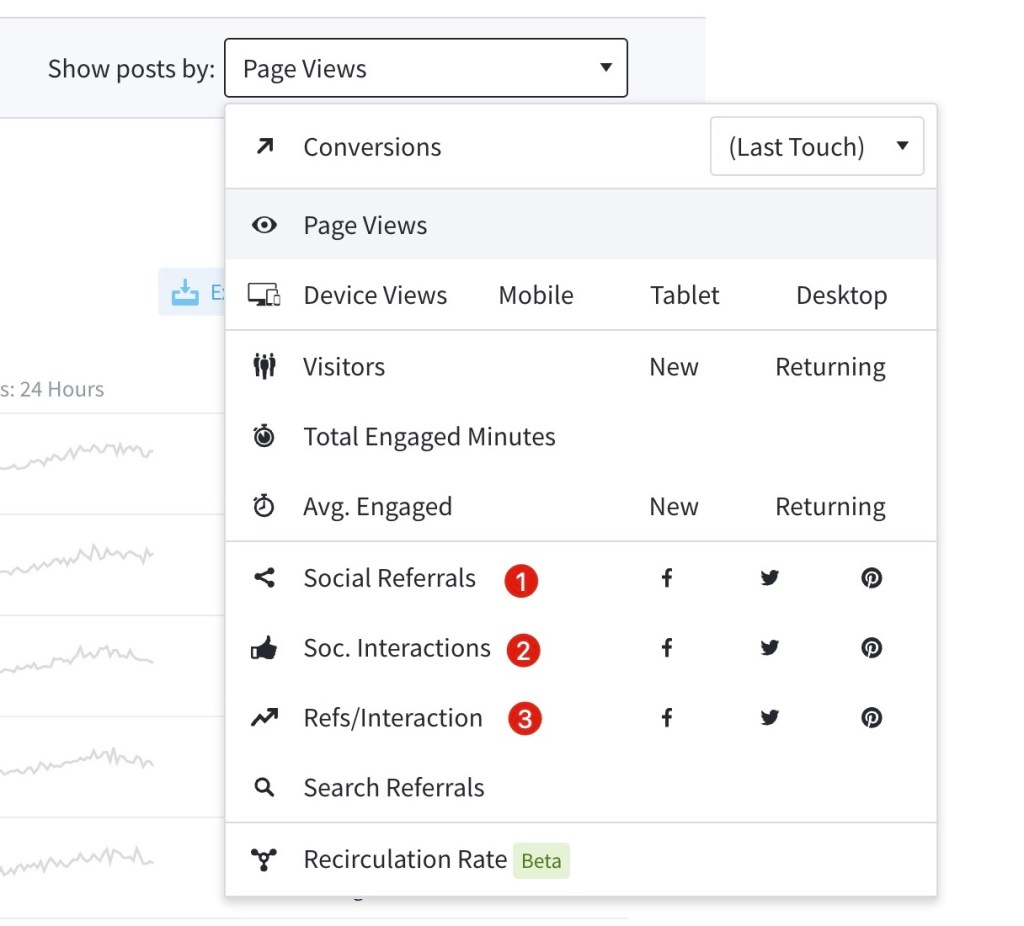
Throughout the Parse.ly Dashboard, and in reports, you can sort by the following social data:
- Social Referrals: these include other networks – see the full list here. Parse.ly periodically updates our list of Social Referrers, but you may also specify custom Referrer Groups.
- Social Interactions: Shares, Likes, Tweets, Retweets, & Pins
- Refs/Interaction: Views referred by a social network per action taken
Top-Level Referrers Tab
By clicking “Referrers“, you can find all the Posts, Pages, or Videos receiving traffic from specific social referrers. This is an “inverted” look that lets you recognize site-wide trends and content that resonates with your audiences.
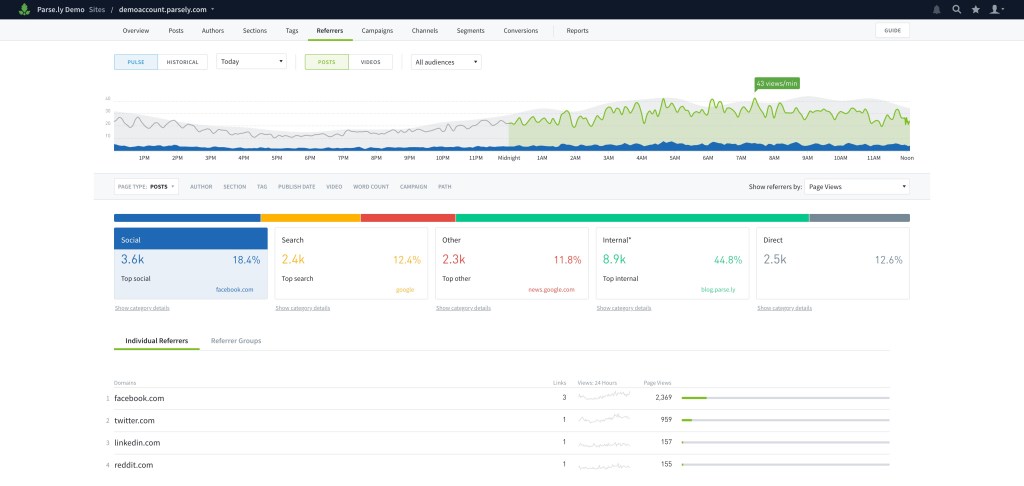
We show page views arriving to your site from social networks by inspecting the pageview “HTTP referrer” header. Examples include
- Facebook: “facebook.com”
- LinkedIn: “linkedin.com” and “lnkd.in”
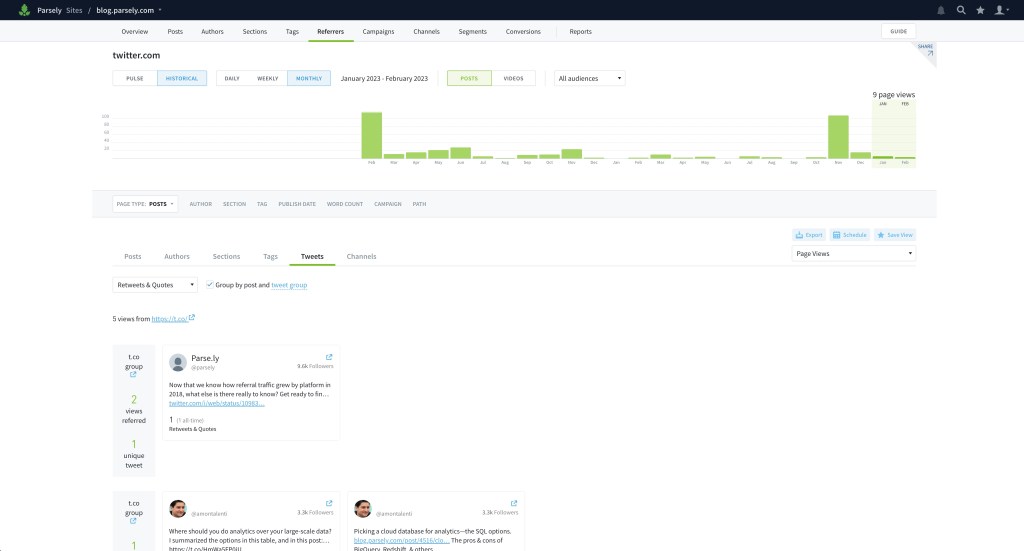
- Twitter: “twitter.com” and “t.co”. For t.co links, you can see the tweet that resulted in the traffic. Tweets can be viewed within the Dashboard under the referrer details for Twitter.
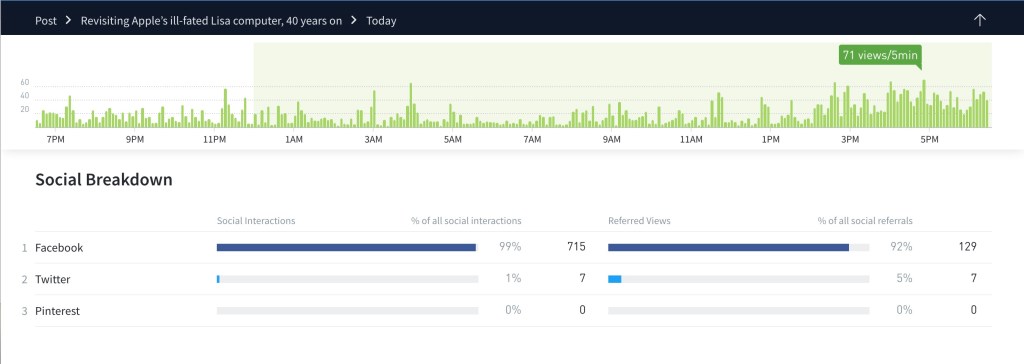
Post or Page Referrer Details
Viewing the individual Post or Page’s details will provide referrer data like the above. Additionally, you can see social breakdown data.
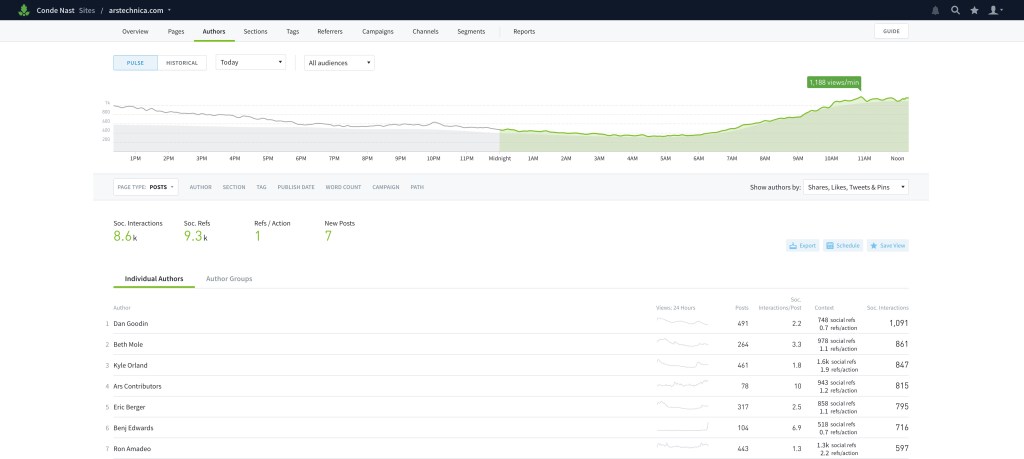
Social Data by Author
This is in the “Authors” tab of the user interface. Parse.ly plugs into the public APIs of Facebook, Twitter, and Pinterest. We then determine the average number of social interactions (Shares, Likes, Tweets, & Pins) per post. This enables a breakout of total interactions for each post published by an author. And from there, you may see sharing behavior and identify trends in coverage.
Last updated: August 15, 2024