Overlay
Overview
The Parse.ly Overlay bookmarklet layers real-time content analytics on top of your site. This enables you to track the performance of posts on your homepage or section pages. It shows historical performance for particular page positions (“slots”) so you can see if an article is doing better or worse than the slot’s average.
Activate and use Overlay
To install and use the Overlay bookmarklet follow these instructions:
- Drag and drop this link to your Bookmarks Bar: Parse.ly Overlay
- Navigate to a page on your site that has the following characteristics:
- Received at least one click through within the last 10 minutes
- Structured in a way that permits custom content-placement, especially your home page
- Contains links to content on the same domain
- Is a Non-Post page per the supplied metadata.
- Is not a Google AMP page
- Go to your site and click on the bookmarklet link to load Overlay.
- Having difficulty? Check for common causes here.
- To close the Overlay, click the “X” in the upper-right corner of the Overlay pane.
Features
Users can easily evaluate slot or post performance to optimize click-through rate on homepages, as well as see data on individual posts. Overlay can be configured in two distinct modes; tracking slots, or tracking posts. The post tracking version of Overlay shows analytics like engaged time, referral traffic, and visitors breakdowns for each unique URL linked on the page. With slot tracking enabled homepage editors can see how posts perform in specific positions on the page to optimize click-through rate
Post details
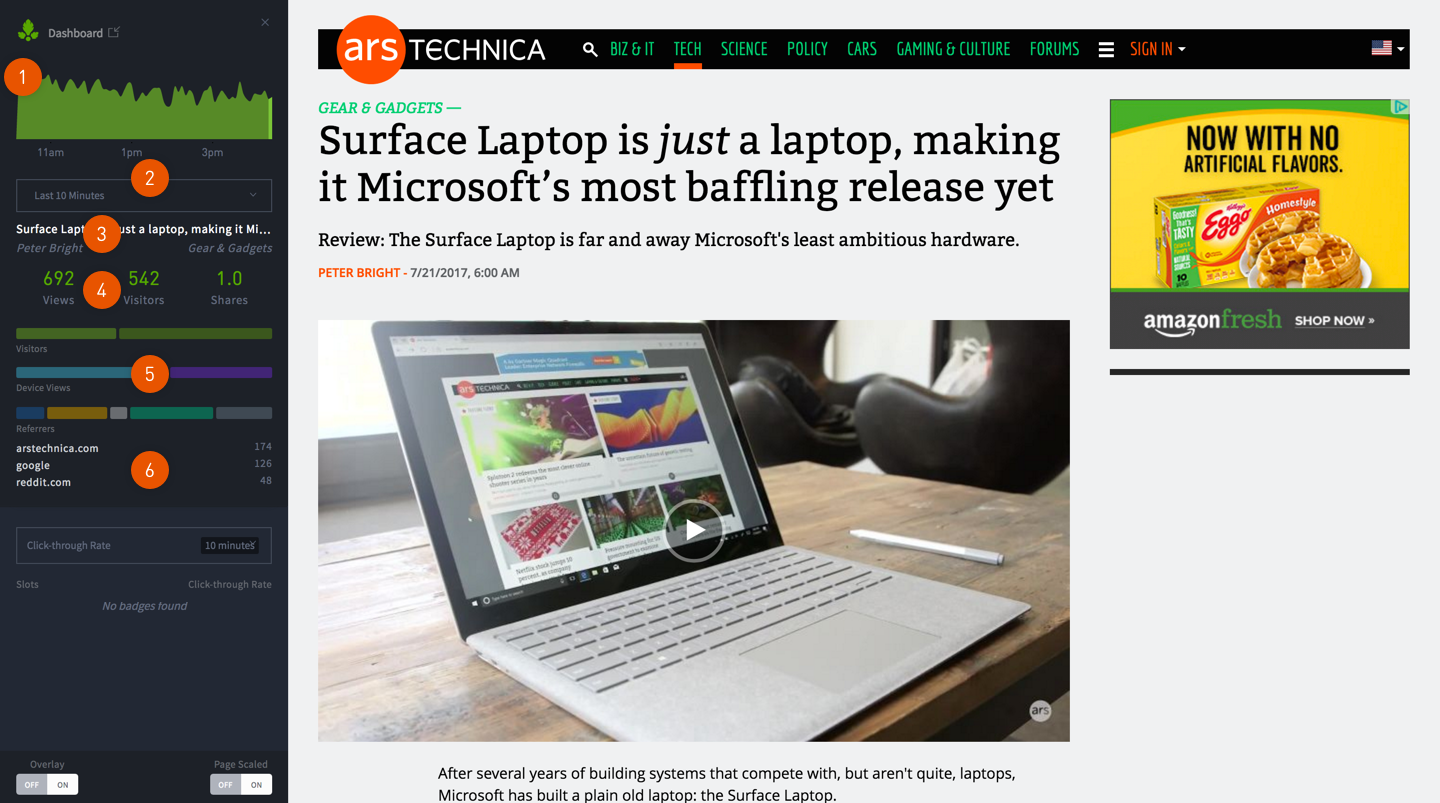
When you’re viewing a post page, Overlay shows:
- Page views over the past 6 hours.
- Time period. This extends from the last 10 minutes to 6 hours and can be changed by clicking the drop down menu.
- Metadata: title, author, and section. Clicking any of these links will take you to a more detailed view in the dashboard.
- Engagement metrics.
- Visitor, device, and referral breakdowns.
- The top three referrers to this page.
Post pages will not show badges with click rates.
Click rates
On non-posts, especially homepages and section pages, you can use Overlay to optimize click rates by seeing how stories perform in certain positions (or slots). Clicking on a badge or a story title in the Overlay panel will reveal specific details about the slot and the articles that have occupied it.
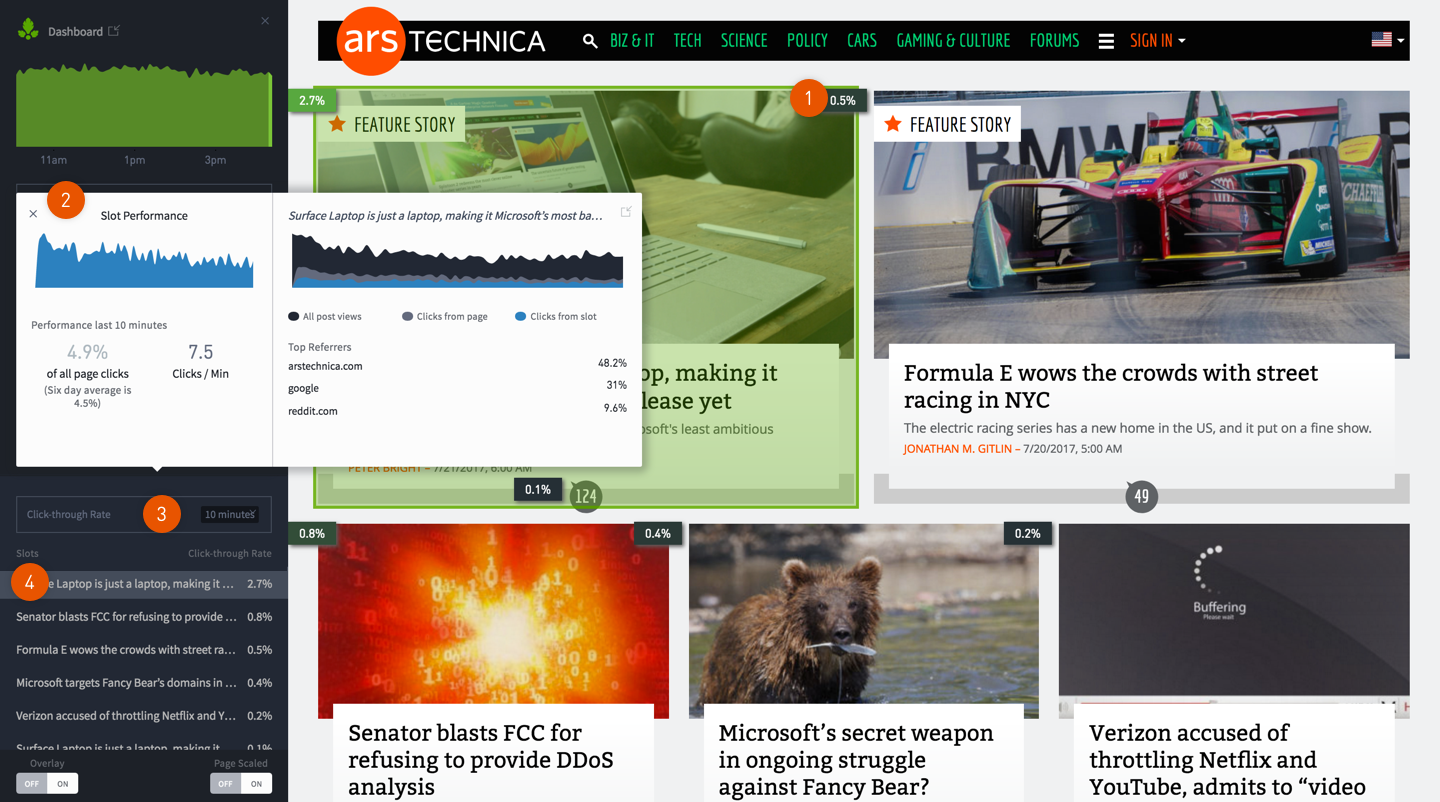
When you’re on a homepage or section page, Overlay shows:
- Badges. These display the metric you’ve selected—clicks per minute, % of clicks, or click-through rate.
- Slot performance. Hovering over the graph will reveal more data about the stories that were in that slot over the last six hours.
- Slot metrics. Click the drop down to select a metric.
- Stories on the page ranked according to the selected metric.
There are seven metrics for evaluating slot performance:
- Clicks per Minute (10 minutes) – Clicks on the selected slot divided by minutes.
% of Page Clicks – Clicks on the selected slot divided by total clicks on the page.
- % of Page Clicks (10 minutes)
- Change in % of Page Clicks (10 minutes vs 6 days)
- Historical % of Page Clicks (6 days)
Click-through Rate – Clicks on the particular slot divided by total page views.
- Click-through Rate (10 minutes)
- Change in Click-through Rate (10 minutes vs 6 days)
- Historical Click-through Rate (6 days)
Display controls
At the bottom of the Overlay panel, there are two toggles for changing how Overlay displays on your site.
Overlay willput a heatmap on top of pages with slots. Green highlights slots that are performing well; red highlights slots that are performing subpar.
Page Scaled will reduces the page size to make it fit on smaller screens.
How does it work?
Overlay tracks slot performance by monitoring the exact location on a web page that a reader clicks to get to an article and storing that in a cookie. When a click occurs, Overlay determines the path of the link that’s been clicked—that is, its position on the page relative to other HTML elements—and sends a ping to Parse.ly servers to store it.
The bookmarklet then creates badges in your browser by doing the reverse: retrieving traffic data from our servers and matching an element on the page with the path that was stored on click (shown on the left, below), along with traffic data for that article URL (shown on the right).
The bookmarklet may require changes to your HTML templates to function properly.
Troubleshooting
The Overlay and Slot Tracking works best for customers with high web-traffic to their homepage or index pages. High traffic means multiple clicks through multiple slots within any given 10-minute window.
The following cases will not work:
- When a slot receives fewer than 1 click within the last 10 minutes.
- Slots linking to Non-posts.
- Slots linking to external sites, i.e., sites that do not share the same Parse.ly Site ID.
- Google AMP
- Mobile-app traffic
- When blocking our cookies, esp.
_parsely_slot_click - Some browser extensions may cause conflict; disable them if needed.
- If you are using the wp-parsely plugin and use the setting that disables tracking of logged in users, then you will need to log out of WordPress.
Customization
We have two optional customization options if you need them.
- You might notice that you have a need for Slot Grouping. For example, you see separate badges on a thumbnail and hyperlink that point to the same target.
- Instead of tracking the performance of a post’s location, you want Post Tracking. If this is the case, contact Support and we will change your site settings.
Last updated: June 05, 2025