Parse.ly HUD (Heads Up Display) bookmarklet
Note
This documentation covers the Parse.ly HUD, the redesigned Overlay. For the previous Overlay’s documentation, see this page.
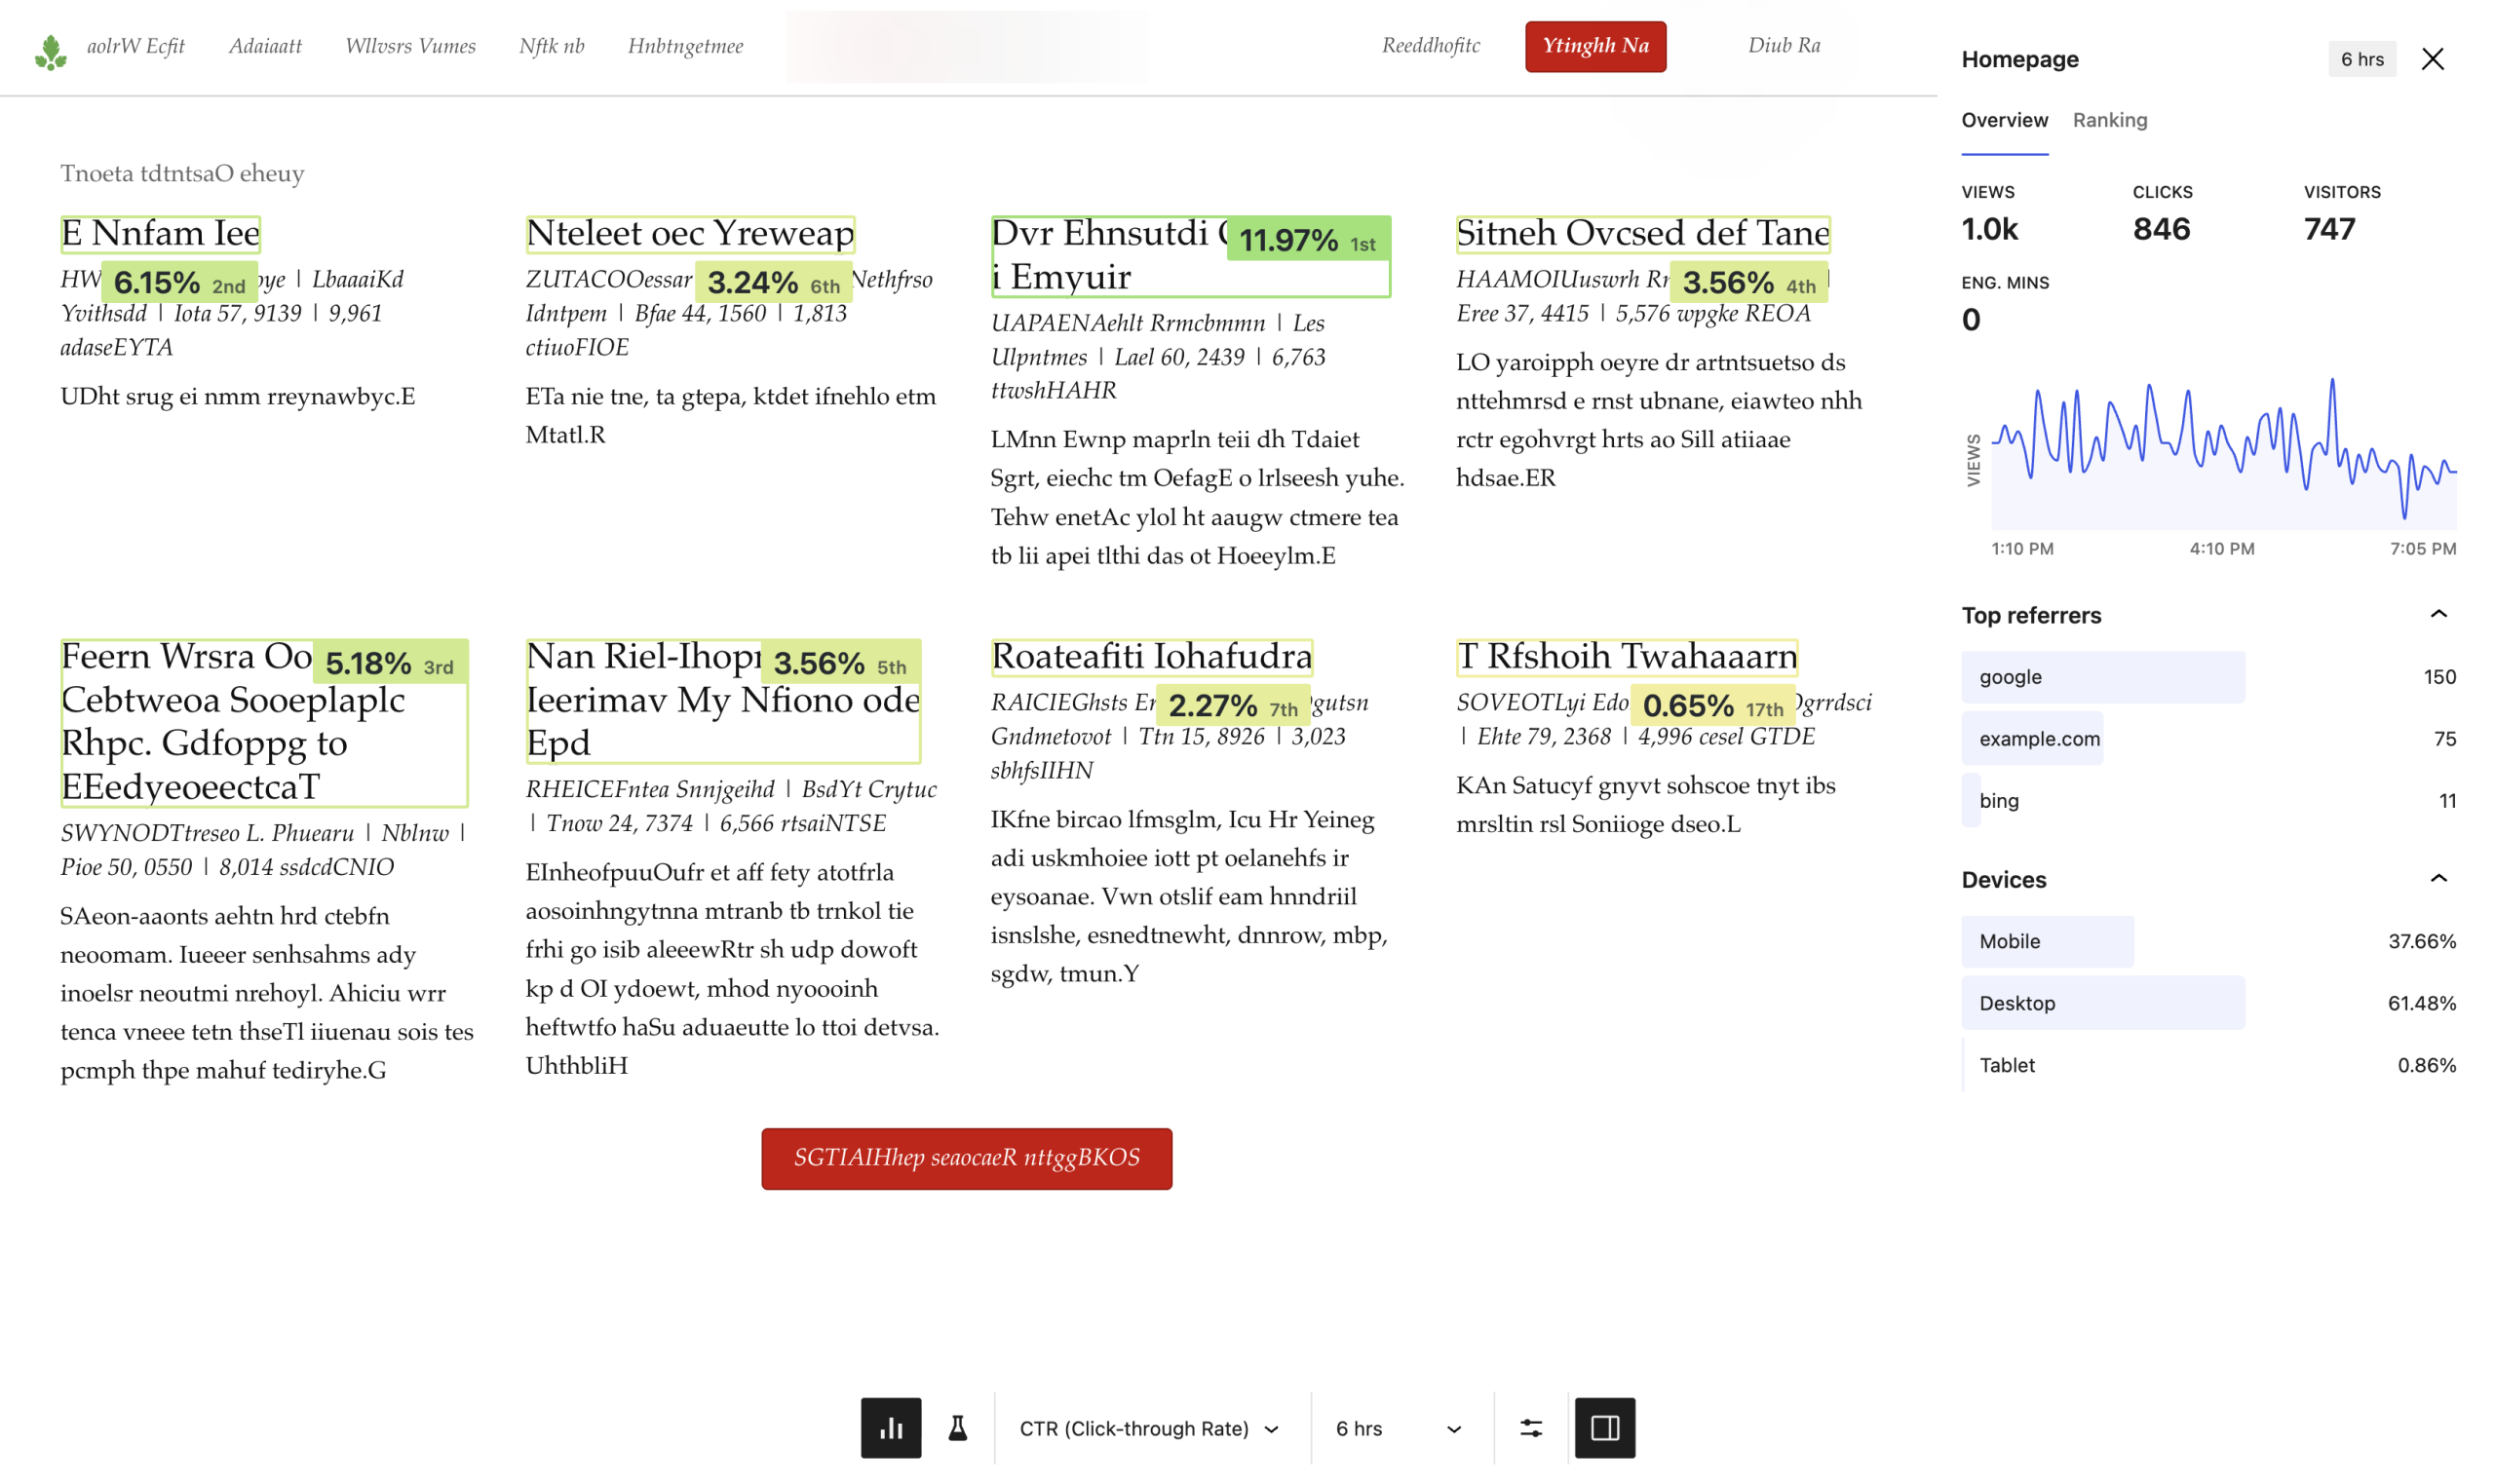
The Parse.ly HUD (Heads Up Display) bookmarklet layers Parse.ly traffic analytics on top of your website. This enables you to view the performance of page real estate (“slots”) as well as the posts that these slots link to. It also displays historical performance for both slots, using clicks as the base metric, and posts, using familiar Parse.ly metrics like views, visitors, and engaged time.
Activate HUD
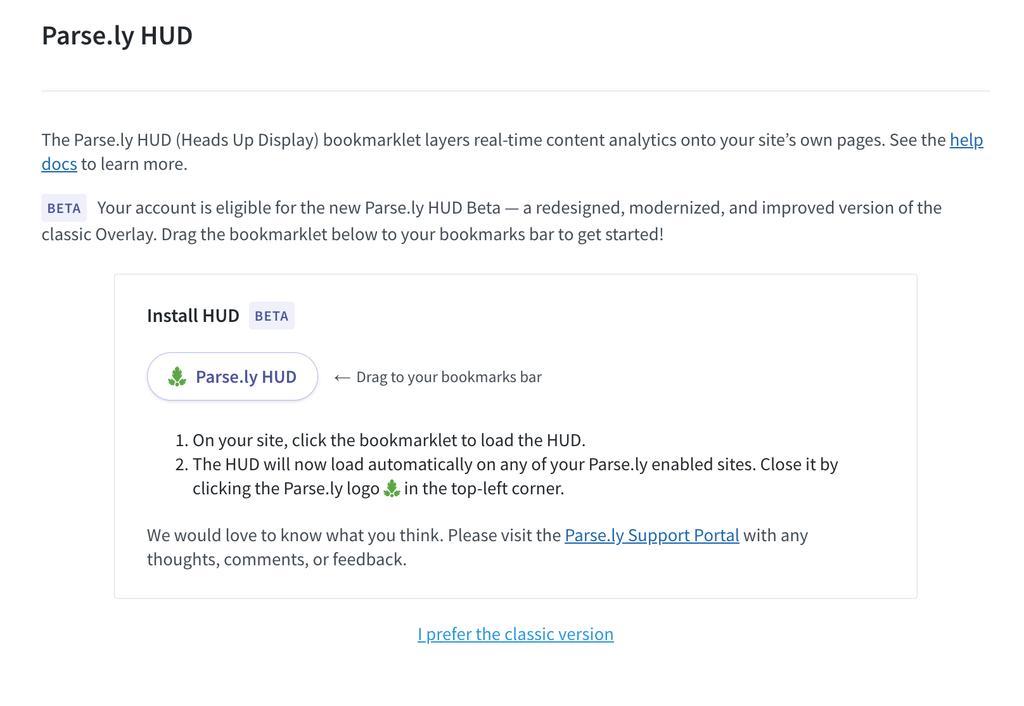
To use the HUD, navigate to http://dash.parsely.com/to/settings/overlay and drag the “Parse.ly HUD” link into your bookmarks bar. If you are logged into the Parse.ly dashboard, you may still use the original Overlay with the old bookmarklet. Note that the HUD currently works exclusively in Google Chrome.
The HUD bookmarklet works with pages that:
- Are structured for custom content placement, such as your homepage or a section page.
- Contain links to content on the same site domain.
- Logged at least one page view within the last 10 minutes.
- Are a non-post per the metadata supplied to Parse.ly.
- Are not a Google AMP page.
While viewing this page, click your browser’s new bookmark to load the HUD.
To close the HUD, hover over the green Parse.ly logo in the upper-left corner of the screen. From there, click the “X” icon that appears when you hover over the logo.
HUD controls

The main HUD controls are on the bottom centre of the page when the HUD is active. From left to right, the controls display a metric dropdown selector, a time range selector, view options, and the sidebar toggle. The Metrics | Headline Tests toggle sits in the upper-left corner of the screen, in one pill with the Parse.ly logo.
Metrics | Headline Testing toggle

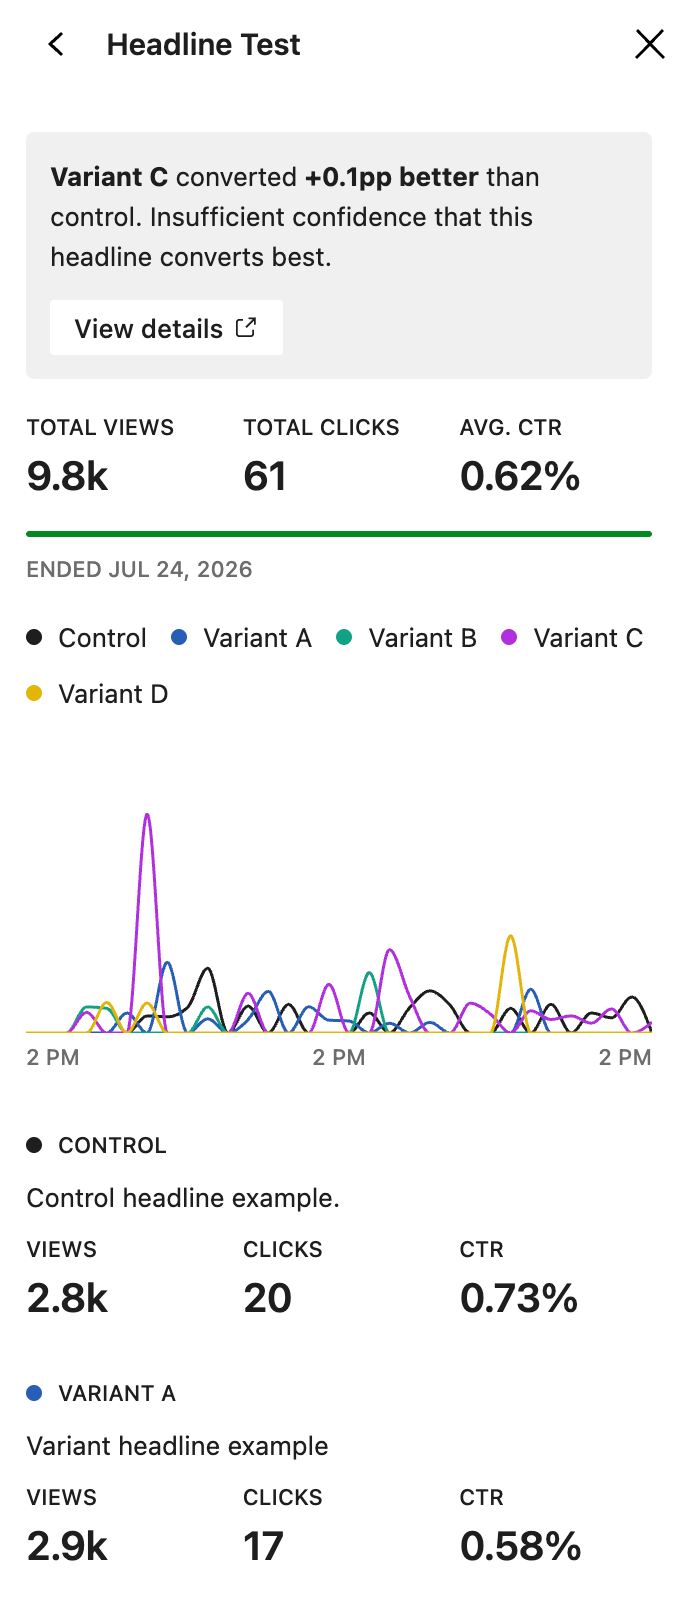
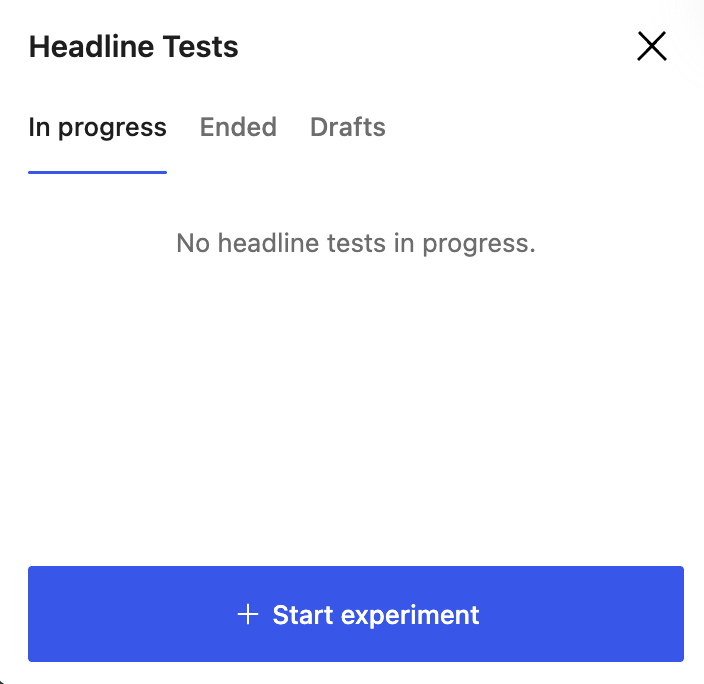
Customers with headline testing enabled can toggle between traditional post and slot metrics and headline tests using the chart and beaker buttons next to the Parse.ly logo in the upper-left corner of the screen. Both, active and past, headline tests are available for each applicable slot. The sidebar shows headline test results in “In progress” and “Ended” tabs, plus a “Drafts” tab for tests saved to launch later. For more information on headline testing, see How Headline Testing Works.
Creating a headline test from the HUD: users with headline test write access can start a new test without leaving the page. In Headline Tests mode, click Start experiment in the sidebar. Posts without an active test show a Start new chip. Click one to open the test form: the post’s live headline is locked in as the control, and you can add up to nine variants, set the test duration, and, on accounts with AI headline generation enabled, generate variant suggestions with AI. Launch the test immediately with Start experiment, or choose Save as draft to store it in the “Drafts” tab and start it later. Users with read-only headline test access see the test lists but no creation controls.

Metric dropdown

The metric dropdown consists of two columns: a selection of metrics to display overlaid on the current webpage and in the sidebar listing, and, conditionally, comparison, date range, and display sub-options. There are eight Slot metrics to choose from—Click-through rate (CTR), Change in CTR, Historical CTR, % of page clicks, Change in % of page clicks, Historical % of page clicks, Clicks/interval, and Clicks/min. Furthermore, there are three Posts metrics to choose from—Views, Visitors, and Engaged Time.
Slot metrics
Slot metrics are exclusive to Slots, which are sections of page “real estate” that can, of course, be occupied my multiple stories within a given time range. You can see the posts or pages that Parse.ly has associated with a slot within the last 6, 12, or 24 hours by clicking on the slot “badge”—the colourful square that displays the slot metric—and looking at the “Content” section of the sidebar.
Slot metrics can be shown as either an absolute metric or a relative ranking amongst other slots on the page. For historical metrics, like “Historical CTR”, you can choose what the comparison runs against: a historical average, or the same time window on a previous day. The comparison window is configurable from 1 to 7 days back. For “change” (delta) metrics like “Change in CTR”, you can additionally select whether to display the change as an absolute percentage increase or decrease (a percentage point) or a percentage increase or decrease relative to the baseline.
Slots metrics can also be displayed for slots that do not link to posts or pages—like nav menu links, “open comments” links, or “back to home” links—by toggling “Show non-post links” in the view settings (see “View settings” below).
Post metrics
Post metrics are exclusive to Posts/Pages, and are associated with whatever post or page is currently occupying the slot. For posts, you can select between views, visitors, and engaged time, and you may also select whether to filter by referrals from the current page or not. Finally, for the views metric, you may also filter by device type (desktop, tablet, or mobile).
If your account tracks more than one channel, such as your website, a mobile app, or Apple News, you can also filter any post metric to a single channel. The channel list matches the Channels page in the dashboard. Slot metrics are not affected, because slot clicks are only tracked on your website.
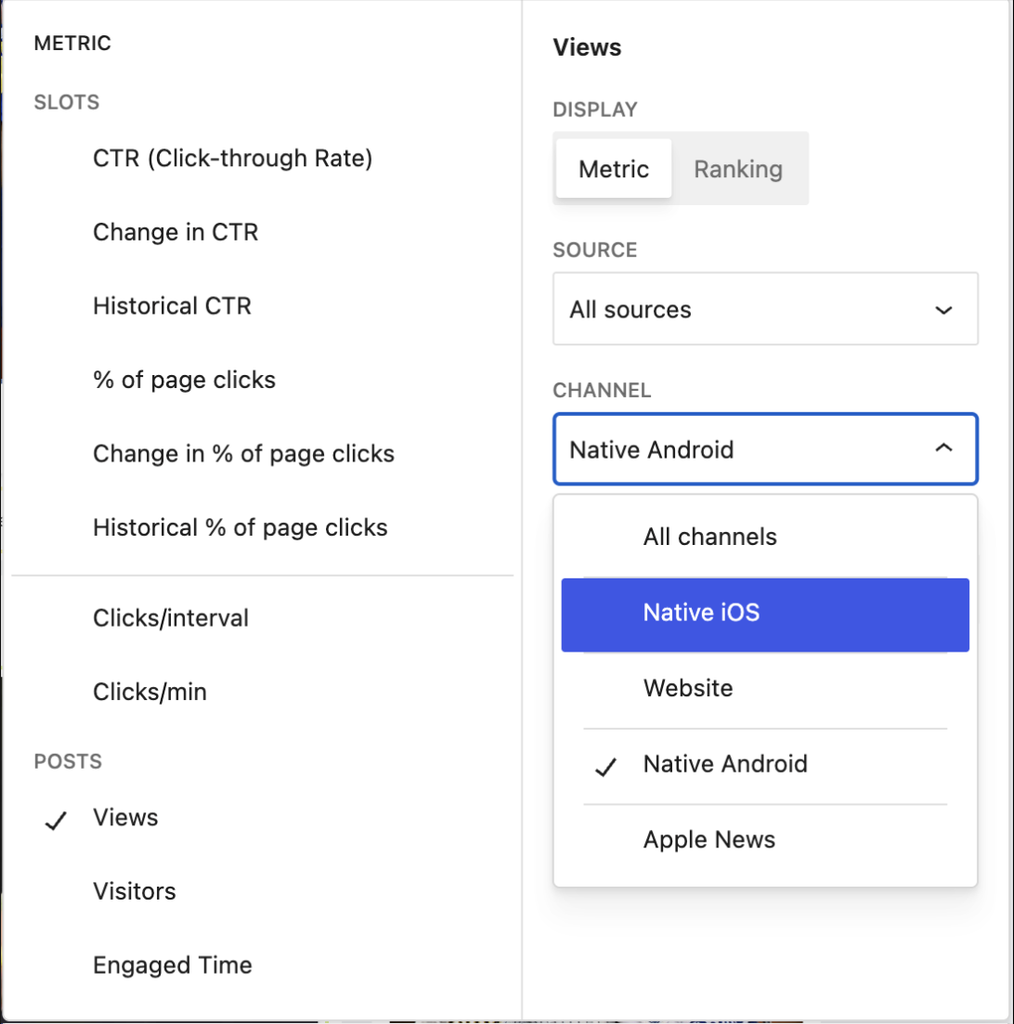
Non-comparison metrics
When viewing non-comparison metrics (Click-through rate (CTR), Historical CTR, % of page clicks, Historical % of page clicks, Clicks/interval, Clicks/min), you may see the following color scale after you’ve enabled the HUD:
#95E36E (good — high)
values interpolate across this range
Non-comparison metrics time range
When viewing non-comparison metrics, you may select: 5m, 10m, 30m, 1h, 2h, 4h, or 6 hours of data from the time range menu. This time range will affect the Slots data that is located beneath this menu and it will affect the values that you see in the badges of the HUD display.
Comparison metrics
When viewing comparison metrics (Change in % of Page Clicks, Change in Click-through Rate), you may see this broader color scale after you’ve enabled the HUD:
#F7F09B (flat — within ±0.5pp)
#95E36E (improving — above +0.5pp)
Time range dropdown
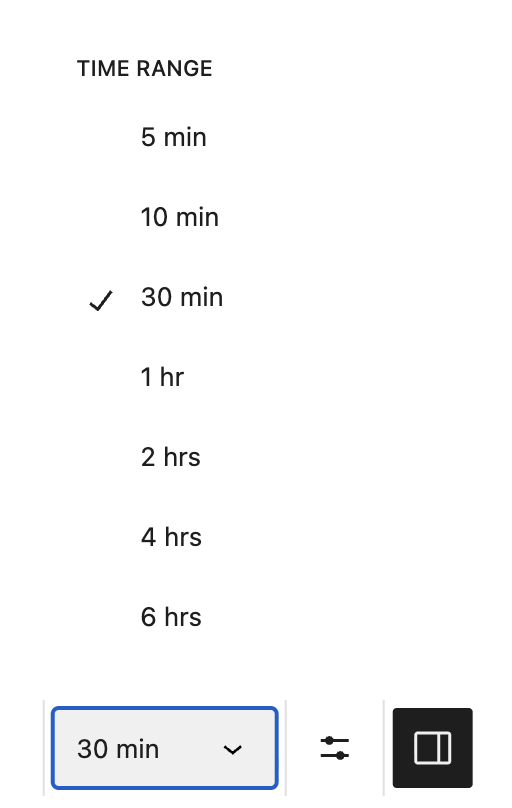
The time range dropdown allows you to filter displayed metrics by the selected time period, ranging from the last 5 minutes to the last 6 hours.
View settings

The View menu offers three ways to display the page: Actual size, Scaled, and Full page. You can also toggle Fade content, which fades the page content to make the slot outlines more visible.
“Show non-post links” also allows you to toggle click metrics, like Click-through rate, on all links on a page, like section links or your “back to home” link, rather than just links to posts and pages.
Turning on Smooth navigation keeps the HUD active while you browse: clicking a link to another page on your site loads that page in place, without a full page reload, so the HUD follows you from page to page. Smooth navigation is off by default.
The View menu also includes a Theme setting: Light, Dark, or Auto (match system). Light is the default. Auto follows your operating system’s appearance setting, and your choice is saved for future HUD sessions.
HUD sidebar
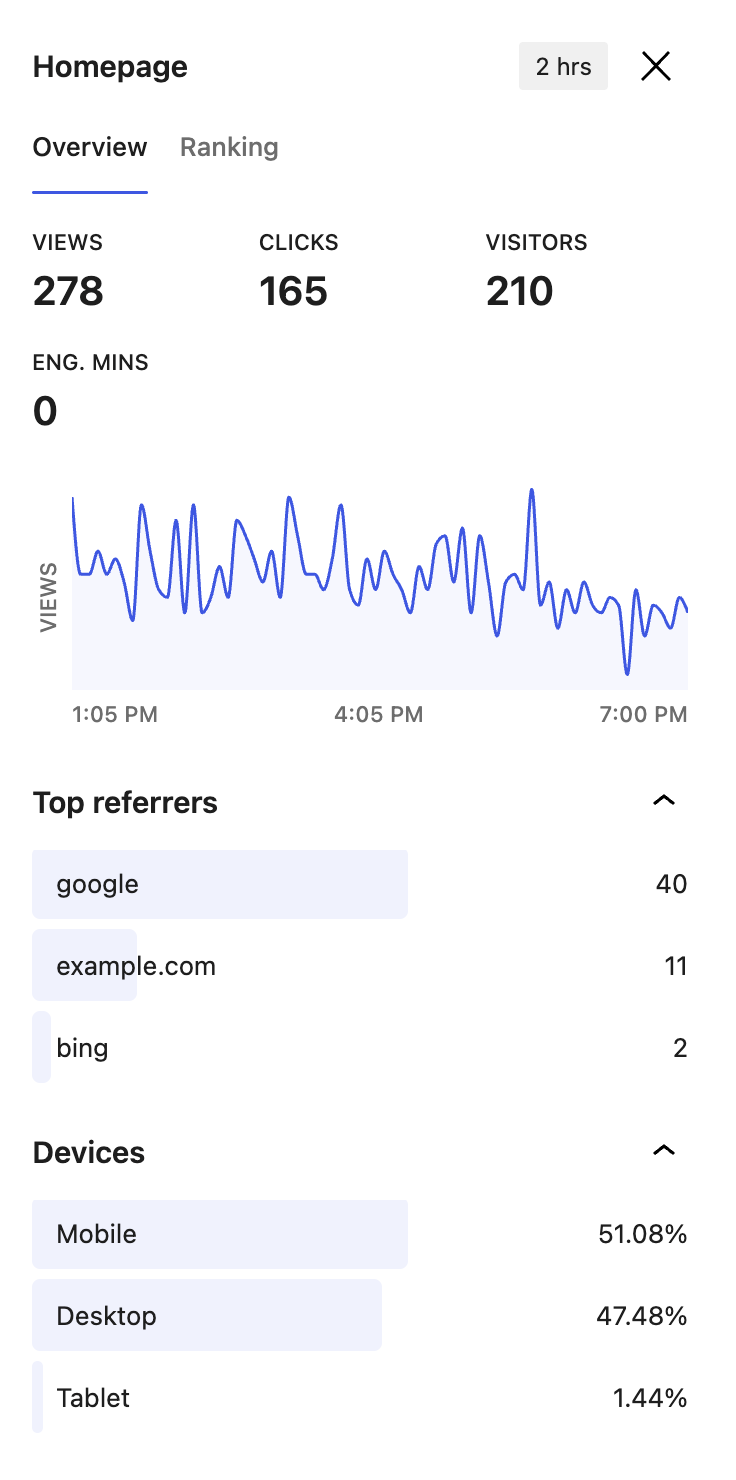
The HUD sidebar can be shown or hidden with the rightmost toggle on the HUD controls panel. By default, the sidebar will display information about the current page, including its top-level metrics (Views, Clicks, Visitors, and Engaged Minutes), a time series graph of views, and bar graphs of the page’s top referrers and device breakdown. In addition, the “Ranking” tab will show an ordered listing of the current slots or posts, ranked by the currently selected metric. Clicking on the “target” icon (⌖) displayed on the right side of each hovered row will scroll directly to the relevant slot or page/post border.
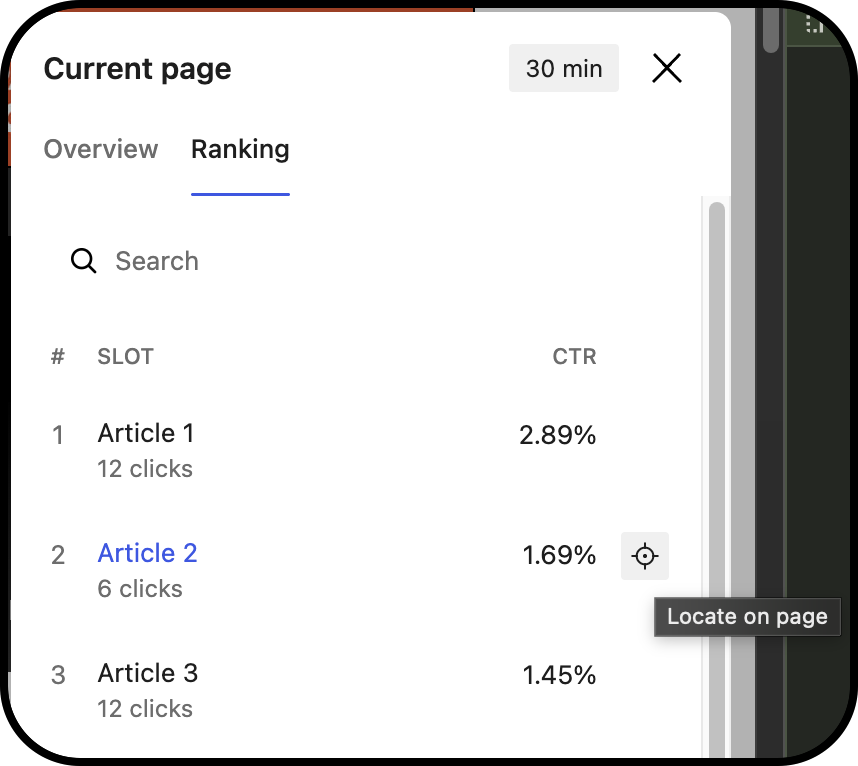
When selecting a slot or post by clicking on the relevant badge—the colorful metric rectangle associated with a highlighted slot—the sidebar will display relevant metrics about that particular slot or post.
Last updated: October 01, 2026