Social media metrics
One of the most popular Parse.ly Dashboard uses is analyzing social data from networks like Facebook, Twitter, and Pinterest. These social networks tend to result in new visitors, with a “viral coefficient” that allows content to spread outside of its typical sphere of influence. Read more about social data and real-time content analysis.
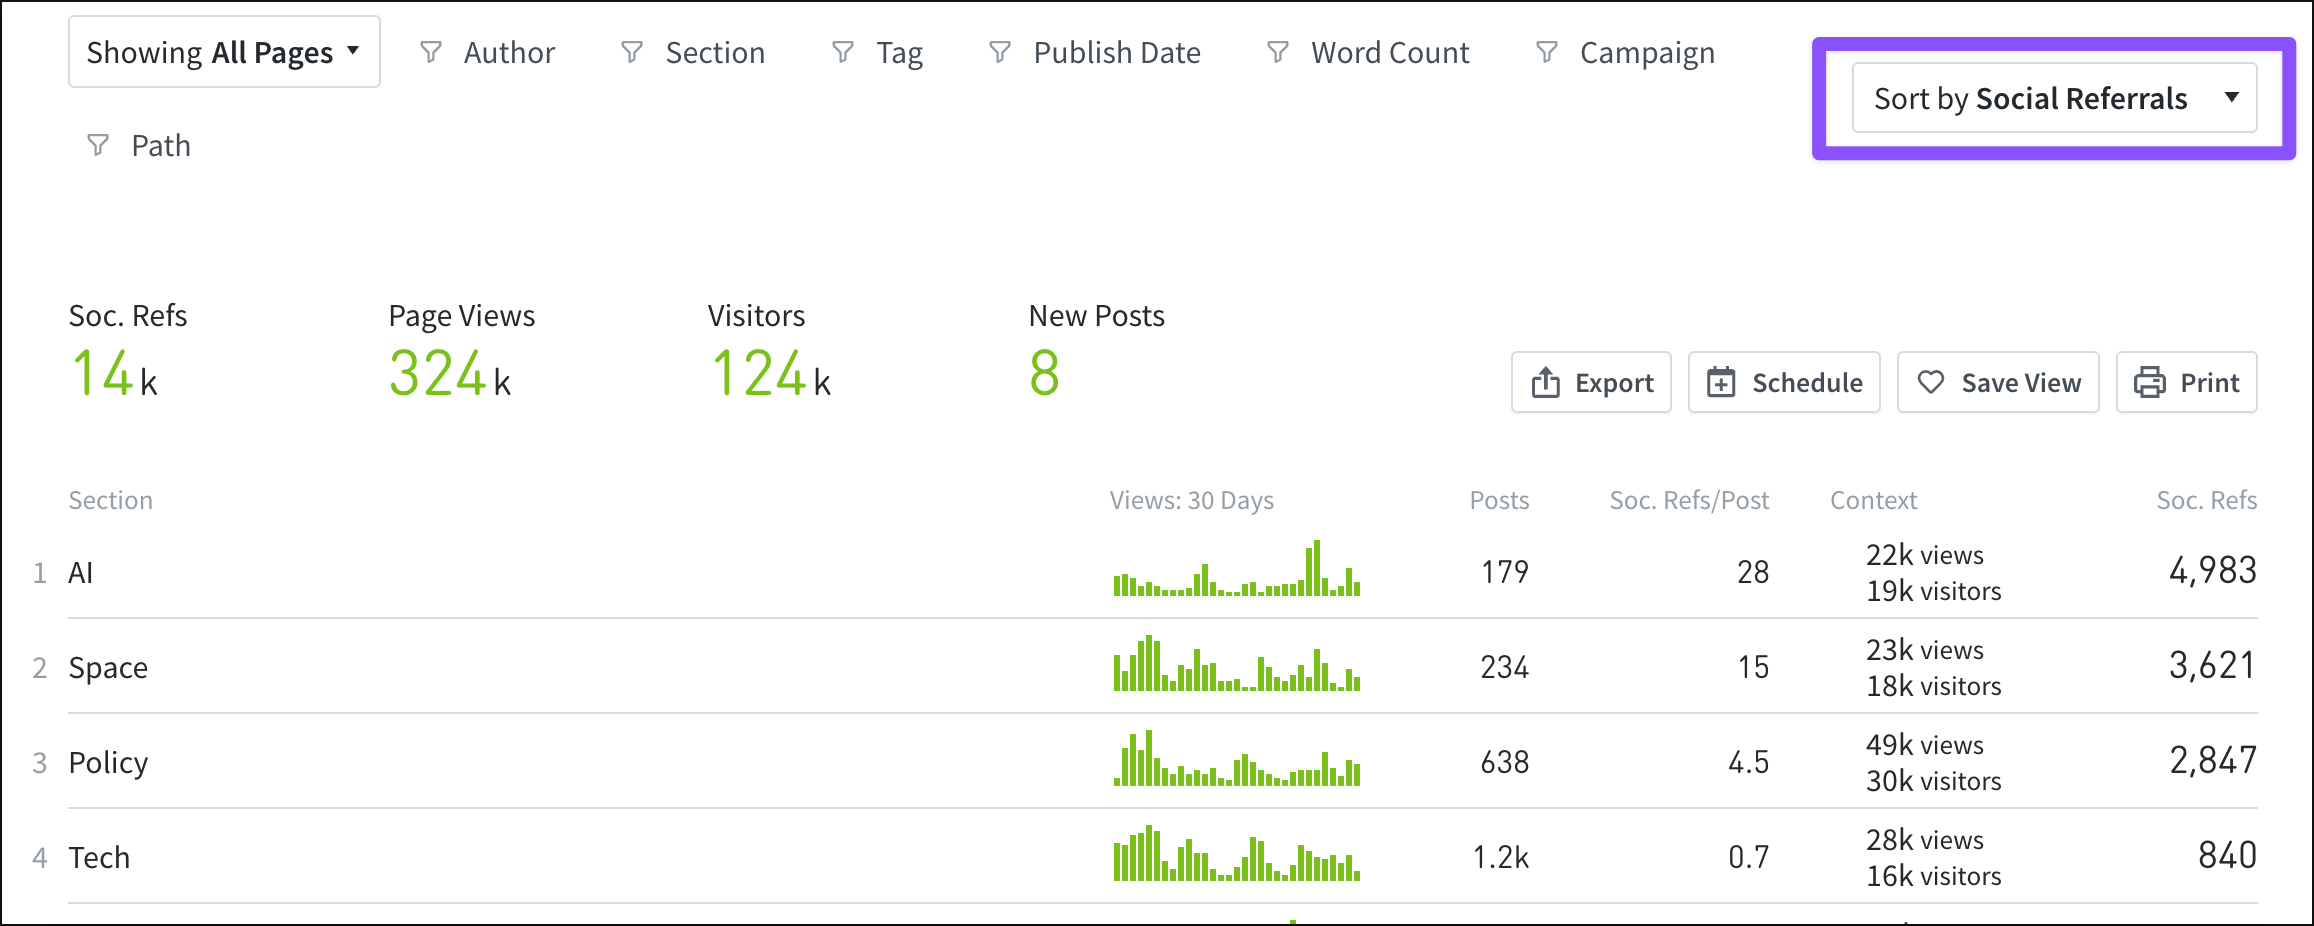
Throughout the Dashboard and in reports, you can sort by various social media metrics — and the Referrers tab allows a deep dive into site-wide trends and content that’s resonating with audiences.
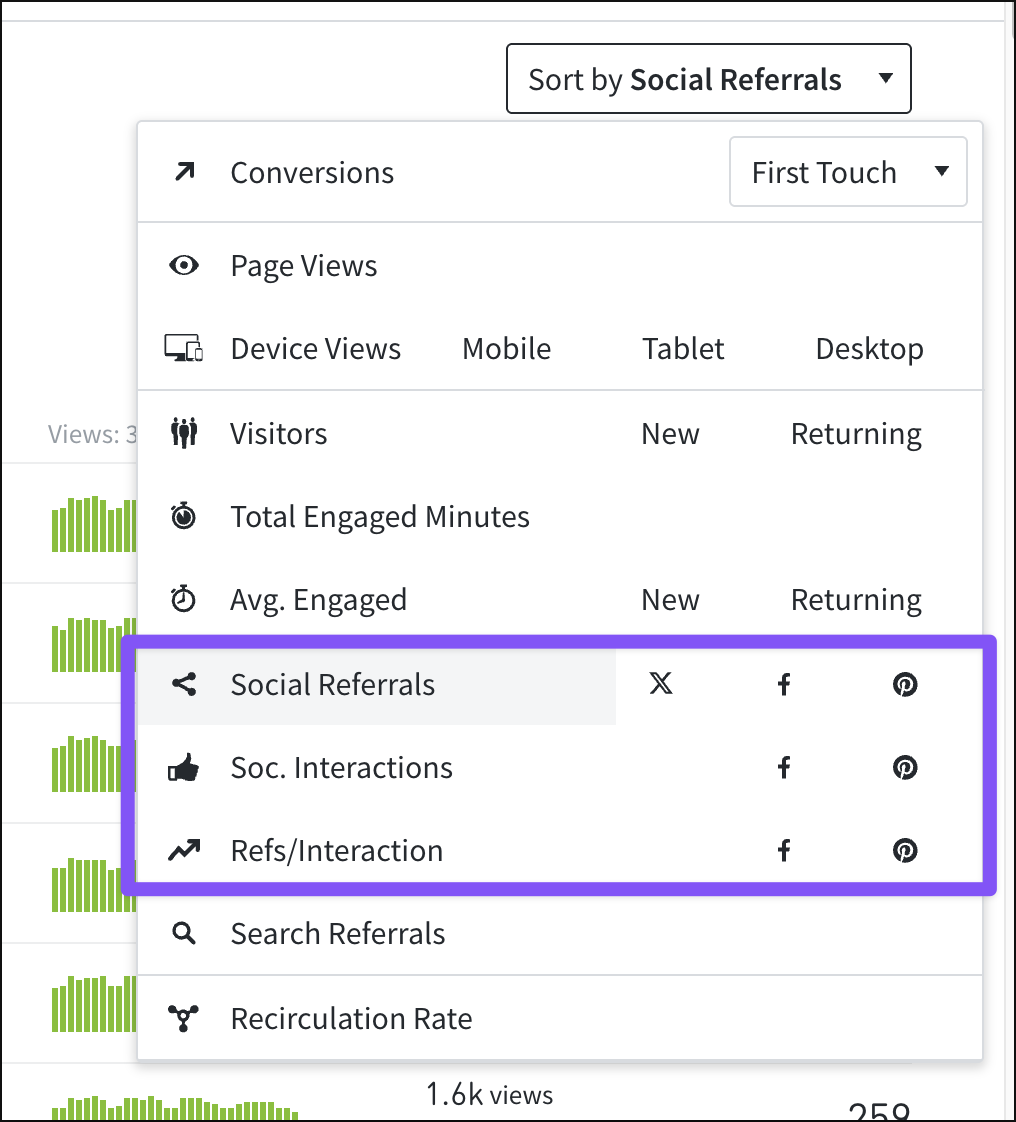
Social referrals
Social referrals (also noted as “social refs” in some places around the Dashboard) show how much traffic, measured in page views, came to your site from social media platforms. Parse.ly maintains and periodically updates a list of social referrers. If at least part of your social media goals is to direct people back to your site and content, get acquainted with this metric. You can also look at referrals from specific social media platforms — for example, you can view which individual threads drove clicks from Facebook.
Social interactions
The social interactions metric captures all off-site engagement for a select group of social networks that Parse.ly officially supports through API integrations. These include Facebook and Pinterest.
In the Dashboard, you can see social interactions in total or broken down by Facebook or Pinterest. Facebook interactions include shares, comments, and likes. Pinterest interactions include saves (pins) and comments.
Since Parse.ly derives social interactions metrics from API connections to these platforms, they are a powerful signal of organic off-site content sharing. Monitor posts (or sections or tags) for their interactions throughout the day. Even if those interactions are not driving much traffic yet, they will be a strong signal that your content resonated with a socially active audience.

Refs/interaction
Refs/interaction is a ratio metric that contextualizes how these two metrics (social referrals and social interactions) relate to one another.
In the image below, the Posts tab has been sorted by Facebook interactions. The top post listed had 71 Facebook interactions (shares, comments, or likes), which then drove 89 Facebook referrals (or page views) back to the site. That gives this post a 1.3 refs/interaction ratio.
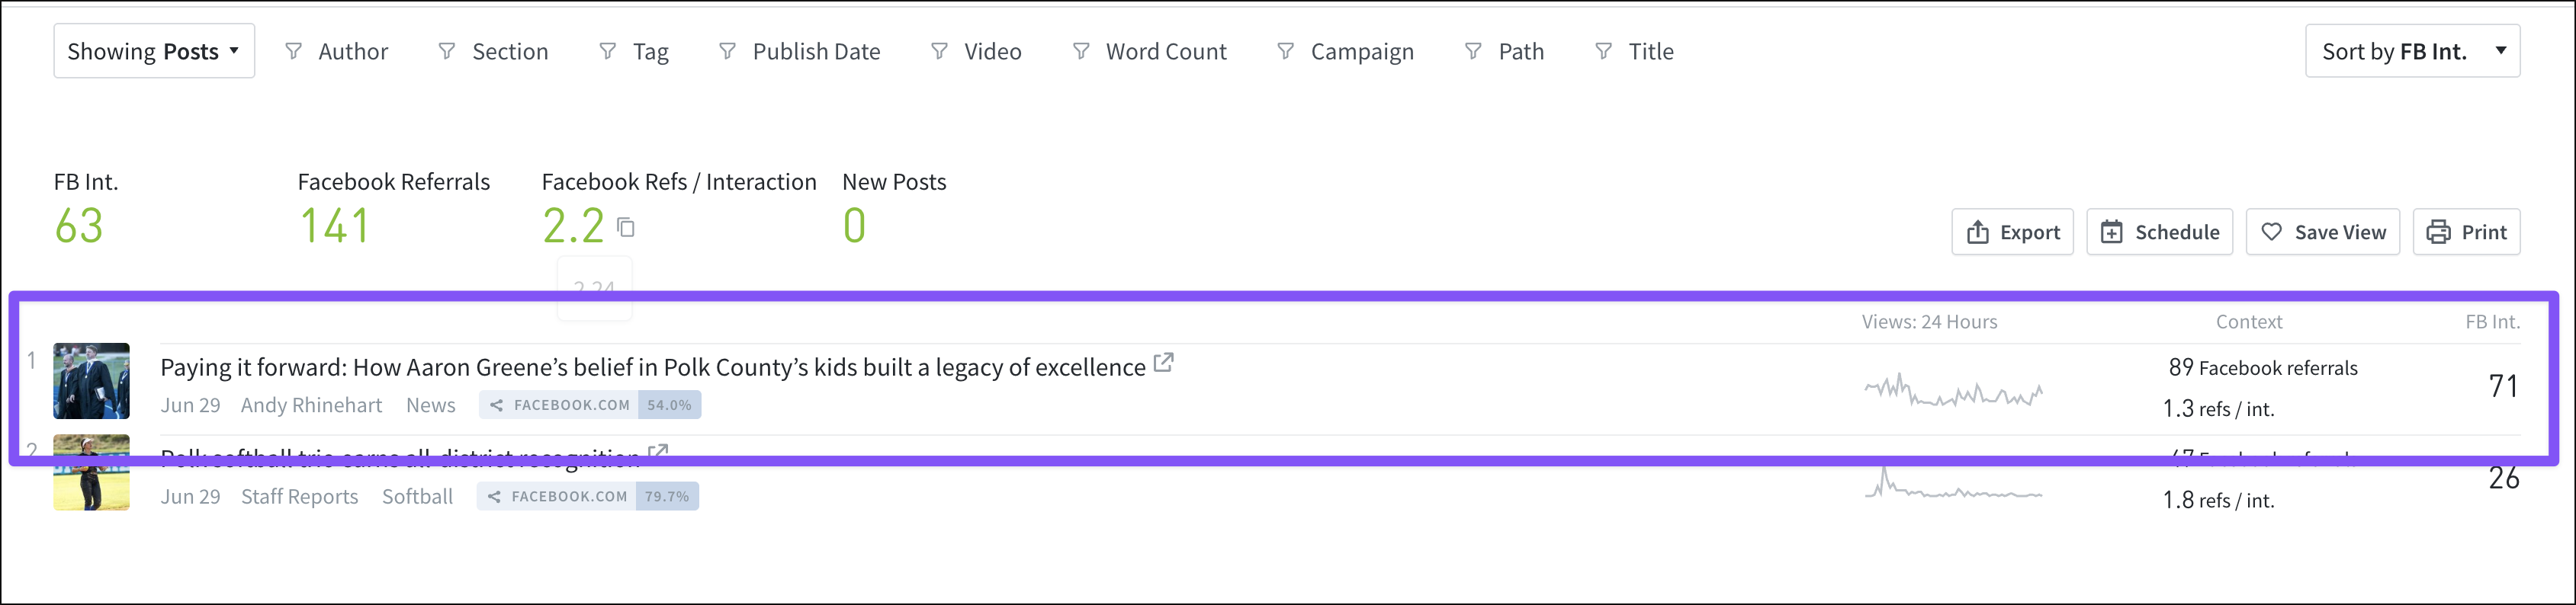
The higher a refs/interaction ratio is, the more optimized a post is to grow site traffic through social media.
This information can help in choosing which content to promote in limited Facebook page posting slots, or whether to cross-promote a post to other platforms that behave similarly to Facebook (e.g., Twitter or Reddit).
Last updated: July 08, 2025