Understanding Parse.ly calculations
Throughout the Parse.ly Dashboard, you’ll encounter averages, projections, comparisons, and other numbers. Knowing what these metrics mean and how they’re calculated is key to putting them to work to improve content strategies, help with editorial decisions, and understand performance.
Note
If questions remain on Dashboard metrics and calculations, contact Parse.ly Support at support@parsely.com.
Timeline averages and projections
Timelines seen in the Overview tab and other Dashboard tabs (Posts/Pages, Authors, Sections, etc.) show data comparisons and projections. For deeper comparisons, use Parse.ly’s Comparison Mode and Benchmarks.
Overview timeline averages
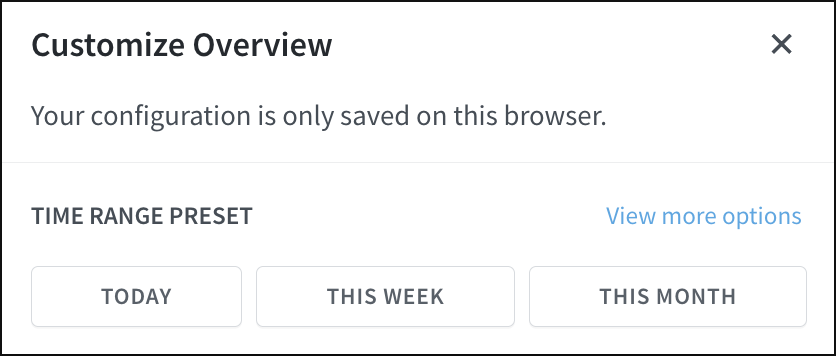
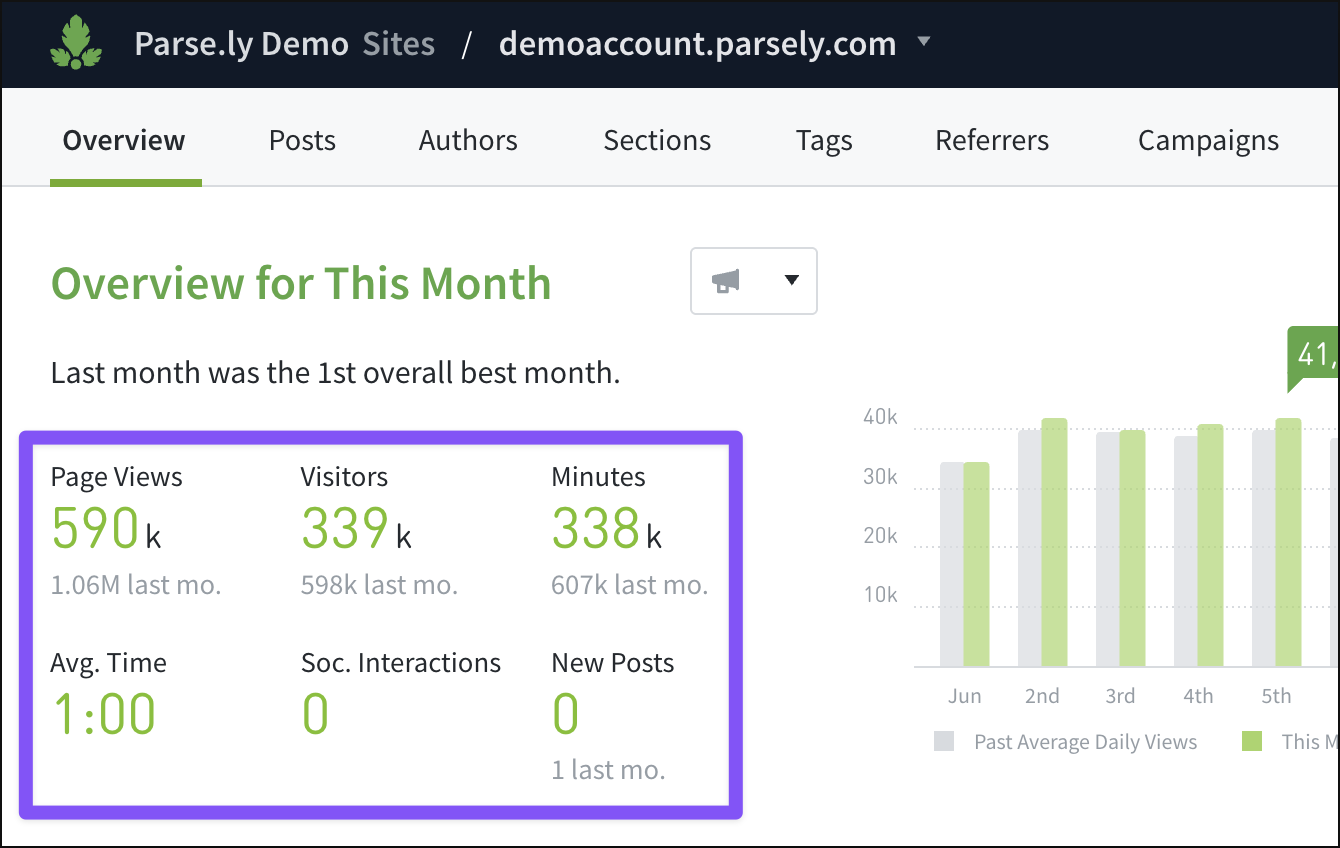
The Overview timeline allows data comparison using a gray area to represent traffic averages, along with a green value for current traffic. Depending on the Time Range Preset chosen in the Customize Overview panel, the timeline looks different.
Overview’s Sentiment Headline also summarizes traffic performance and compares it to previous periods.
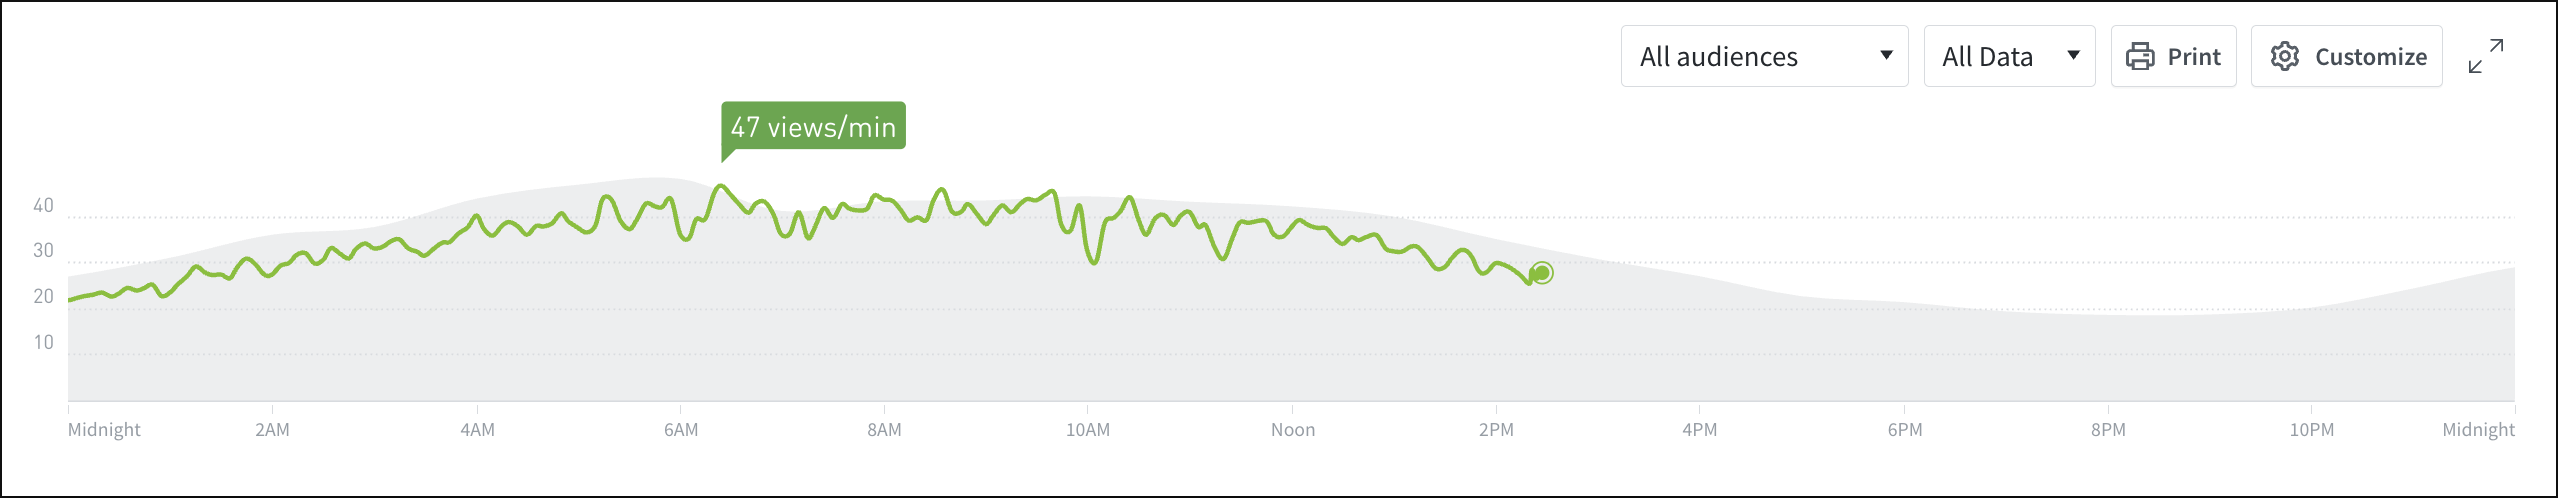
Today
When Overview is set to Today, it collects the previous 8 weeks of data for today’s weekday, then calculates the average and draws the gray area on the timeline. For example, if today is Tuesday, Overview uses data from the previous 8 Tuesdays to calculate the average and draw the gray area to compare today’s green line against.
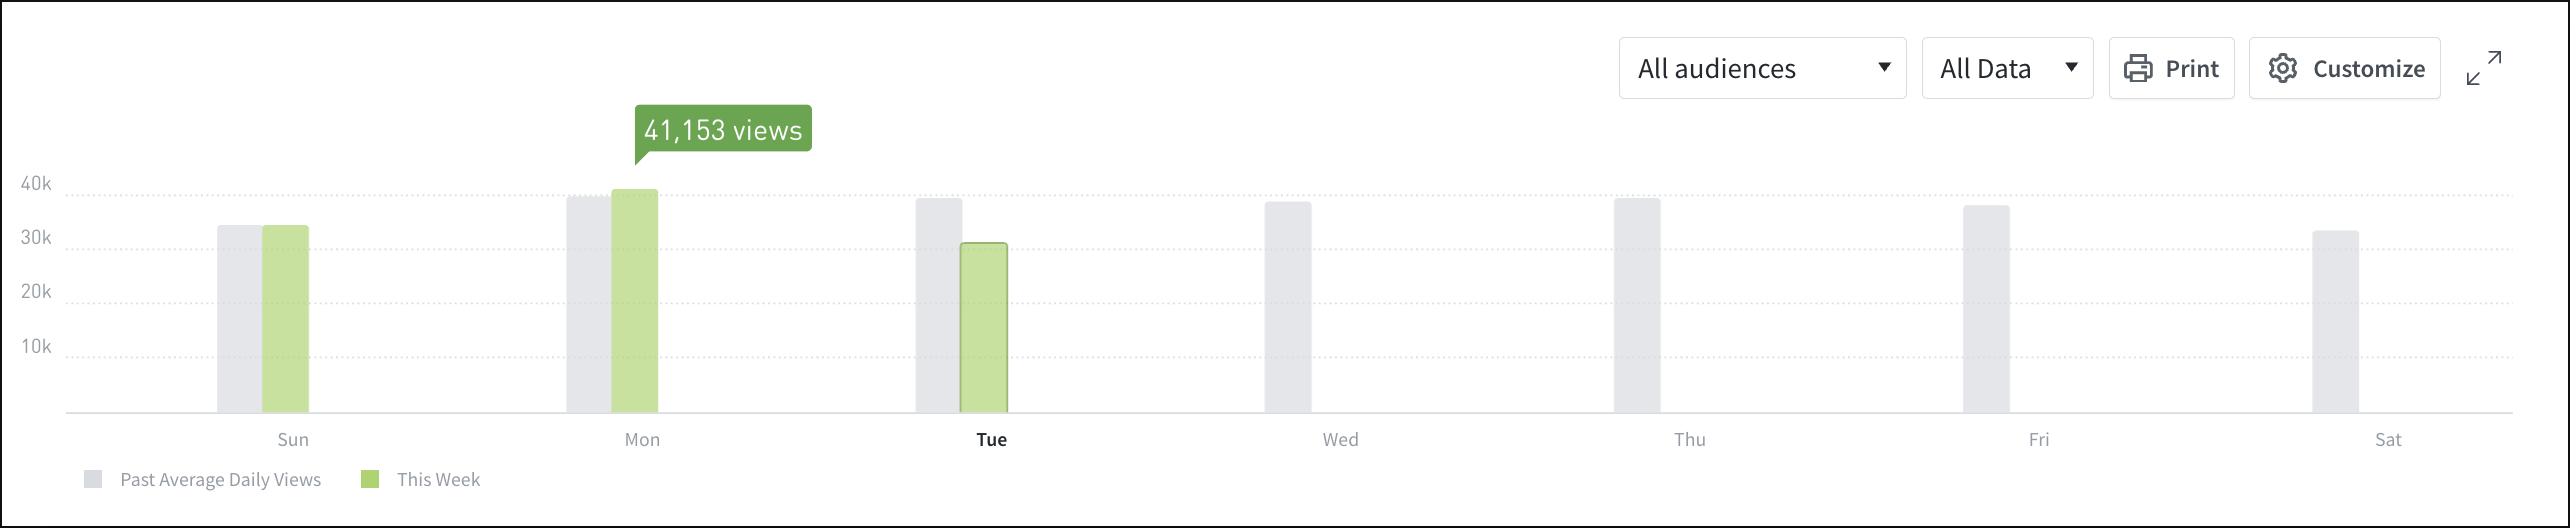
This Week
When set to This Week as the Time Range Preset, Overview collects the previous 8 weeks of data, then calculates the average for each weekday. Gray bars represent these daily averages alongside the green bars of the current week’s daily traffic.
This Month
Setting Overview to This Month collects the previous 8 months of data, then calculates the average for each day of the month. Gray bars represent these daily averages alongside the current month’s daily traffic in green bars.

Timeline projections
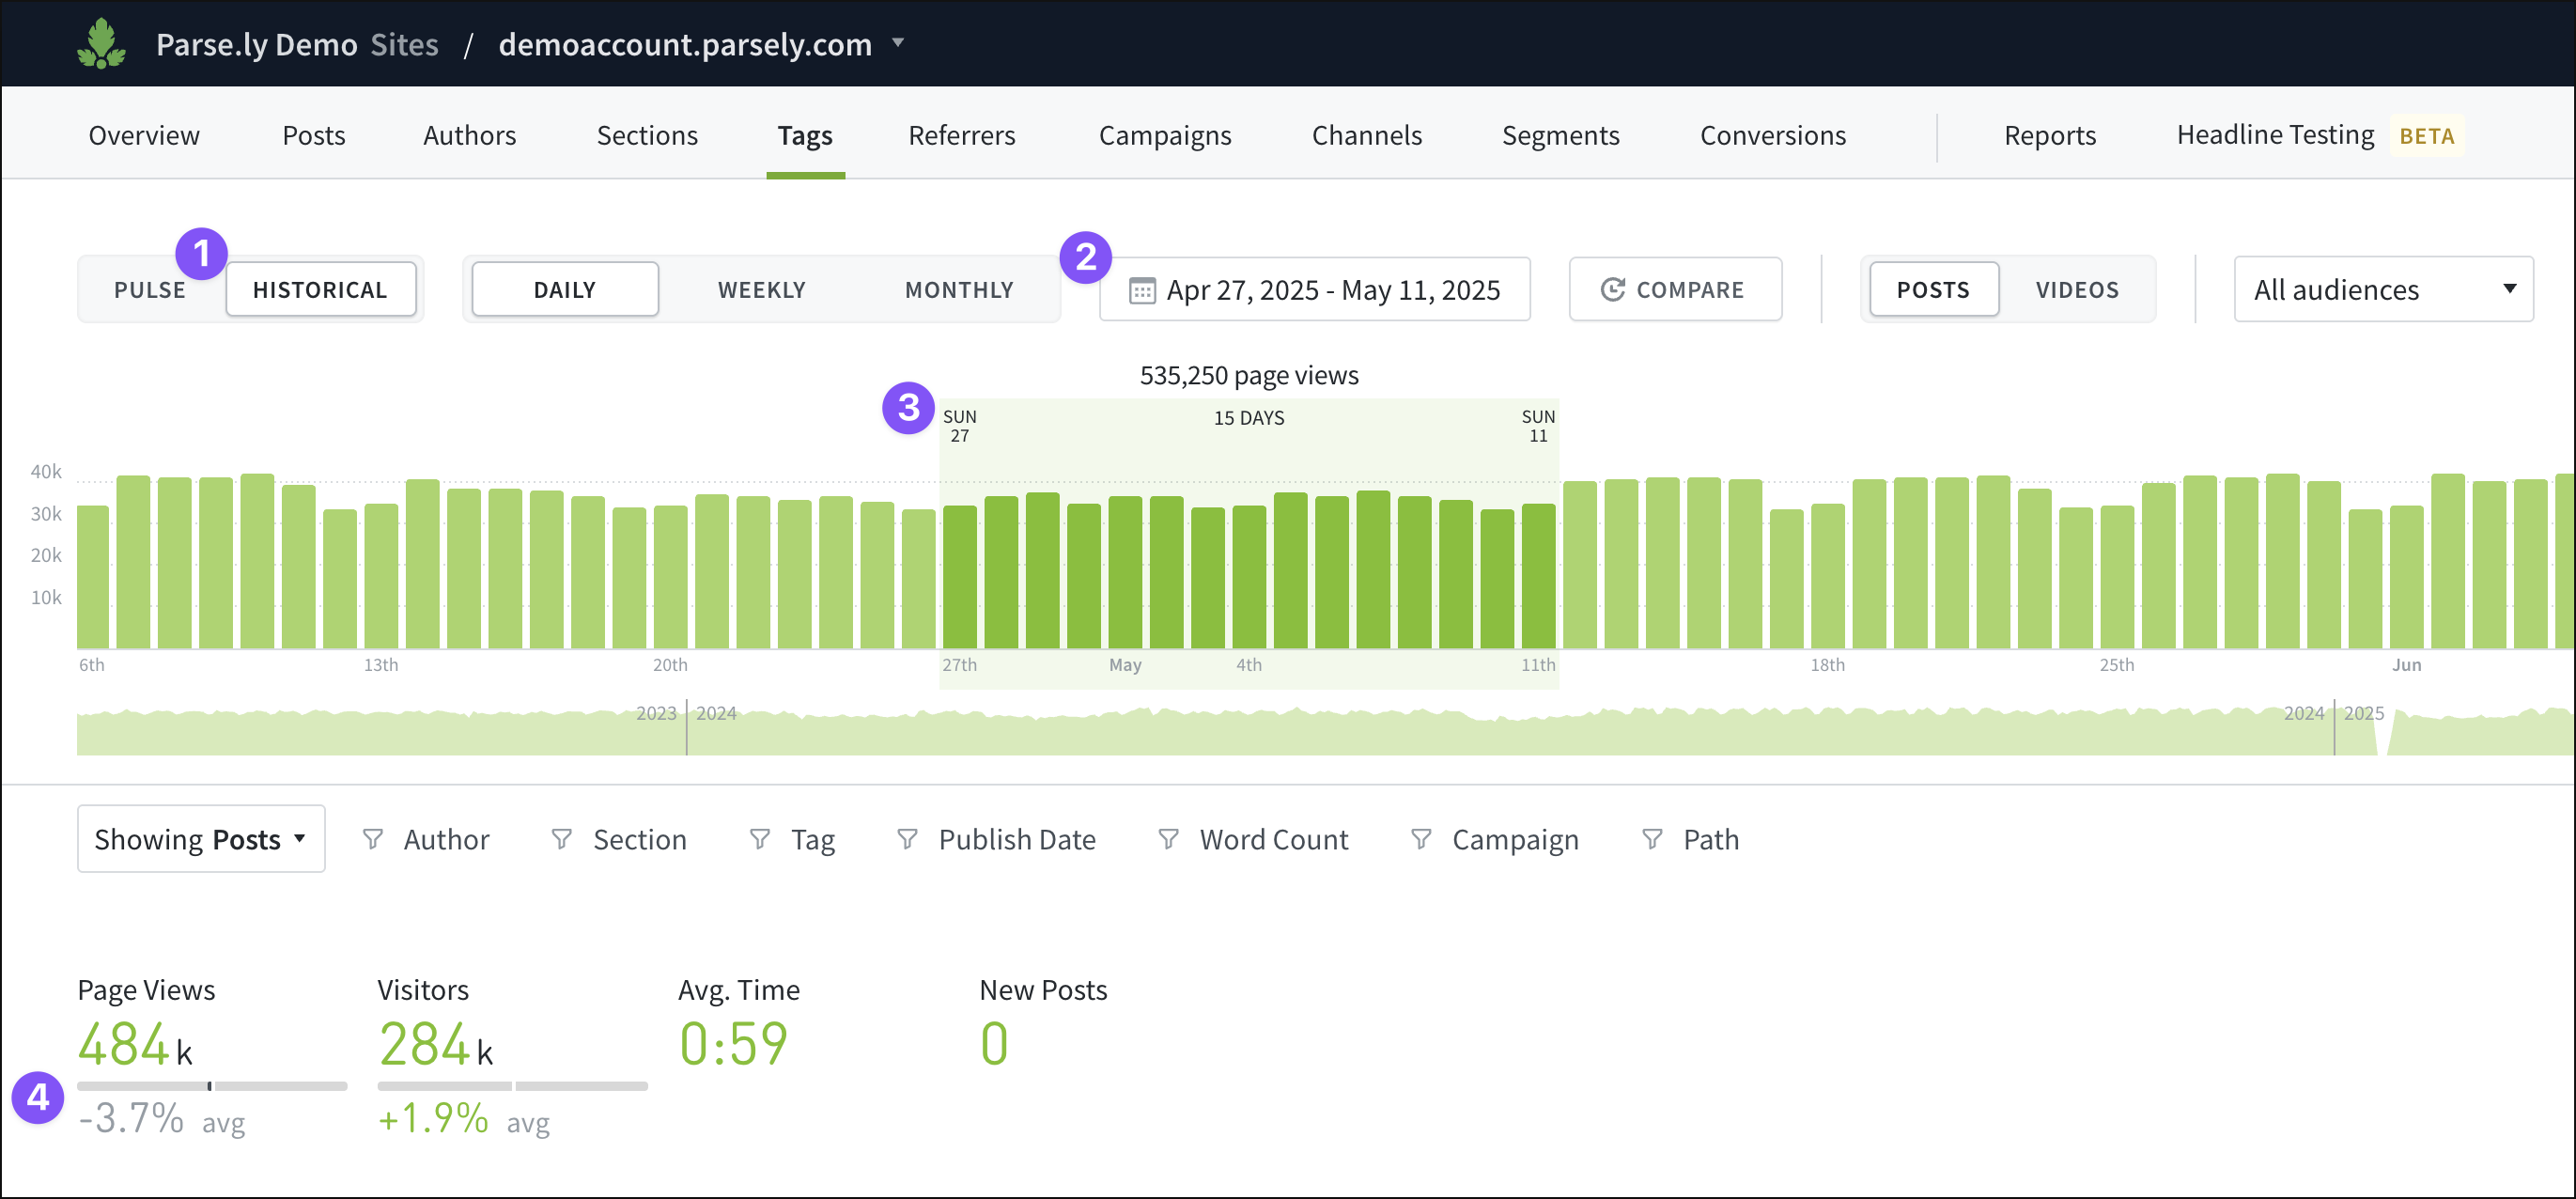
When viewing tabs other than Overview in the Dashboard — Posts/Pages, Authors, Sections, Tags, Referrers, etc. — switching the view to Historical and the Daily time range preset reveals a bar graph representing daily traffic through previous weeks up to today.
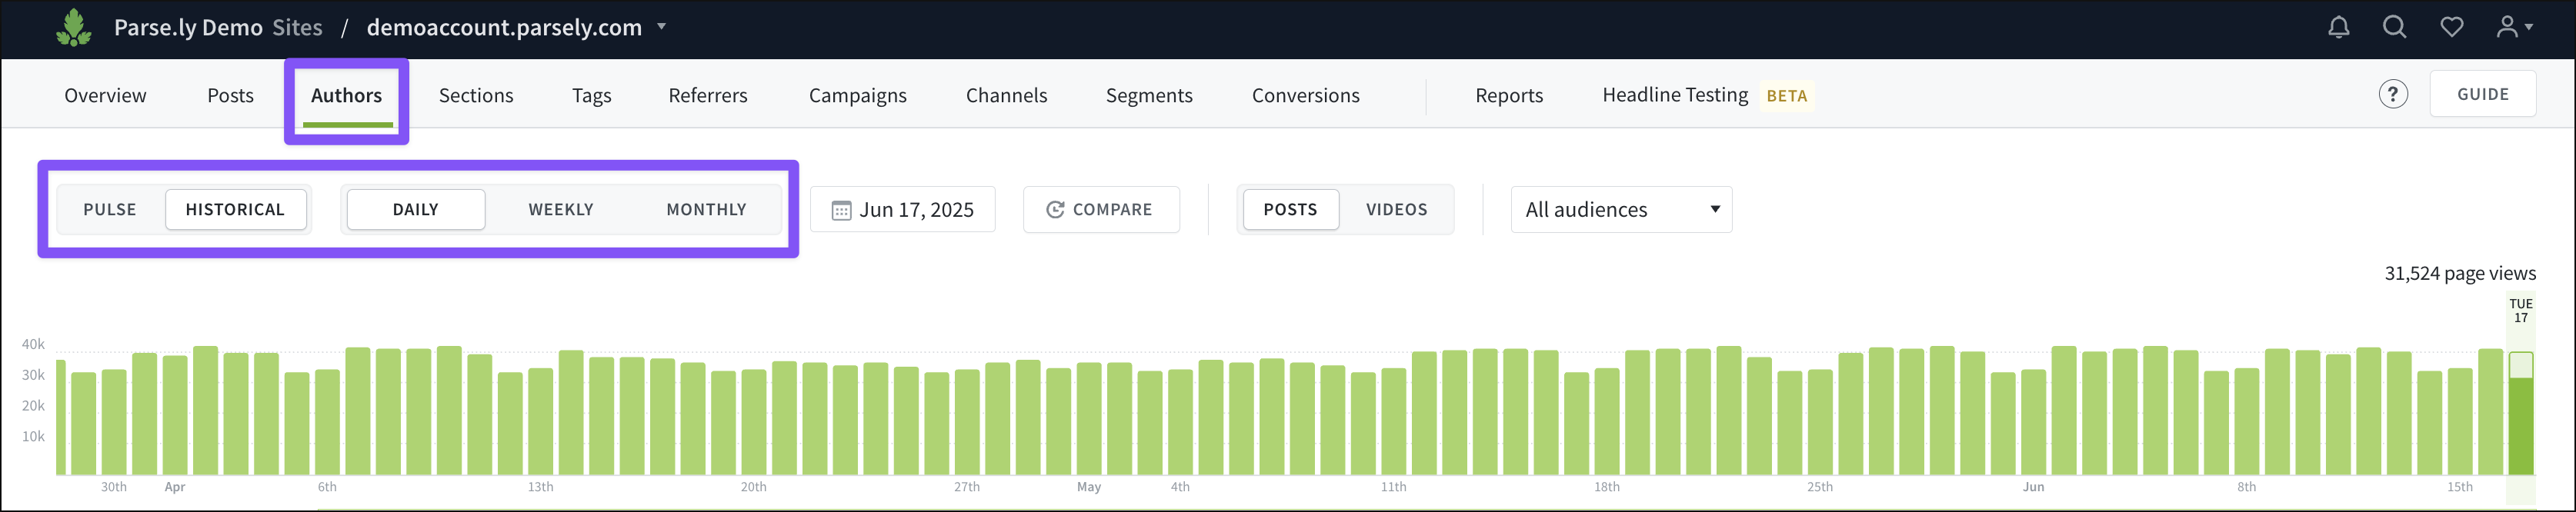
The bar at the far right representing today on this graph begins as a green outline that fills as traffic logs throughout the day. The outline represents the projected amount of traffic for today. This projection is found by collecting the data for the same weekday over the previous 8 weeks and calculating the average. For example, if today is Tuesday, the traffic projection for today will be the average of traffic over the previous 8 Tuesdays.

Factoids
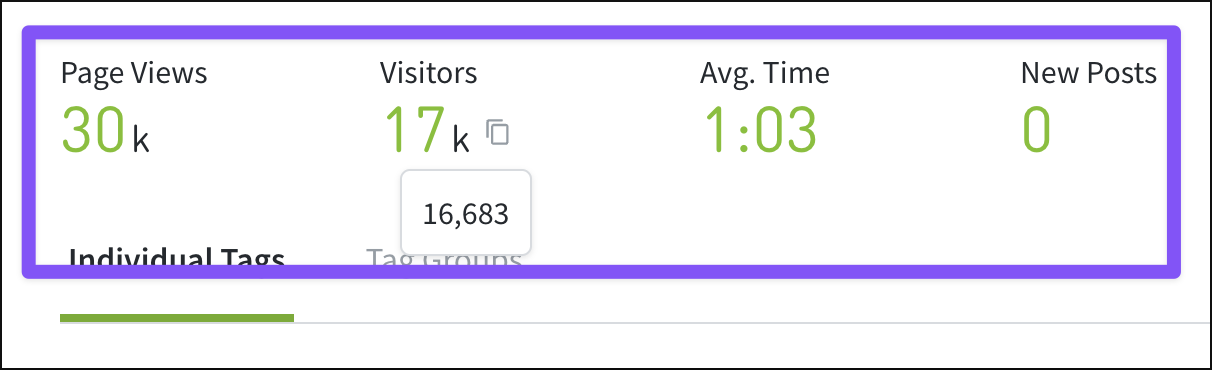
Factoids appear on many Dashboard tabs, including Overview, Posts/Pages, Authors, Sections, etc. These numbers are meant as a snapshot of important calculated metrics. Hovering over each will display the full number (if it’s been rounded in the factoid display), as well as an option to copy the value.
On Overview, the displayed factoids can be adjusted using the Customize Overview panel. On other tabs, the drop-down “Sort by” menu affects which factoids are displayed.
Comparisons using factoids
When viewing the Dashboard in Historical mode, a date range can be selected using the calendar icon or by clicking and dragging a date range on the bar graph. If selecting 31 days or fewer, this displays comparison bars beneath factoids of the relative change between the current factoids and the average of previous data. For deeper comparisons, use Parse.ly’s Comparison Mode and Benchmarks.
- View a tab in Historical mode.
- Set a date range of 31 days or fewer using the calendar icon.
- Or click and drag a date range of 31 days or fewer on the graph.
- Comparison bars appear, reflecting the relative change from the average of previous data.
When choosing a date range in the Historical view, the comparison bars’ data will be pulled from the previous 4 comparable time ranges. Examples: If choosing a single day (Tuesday), the previous 4 Tuesdays’ data will be averaged for the comparison bars. If choosing a single month of 31 days (July), the previous 4 periods of 31 days will be averaged.
Calculating goal progress
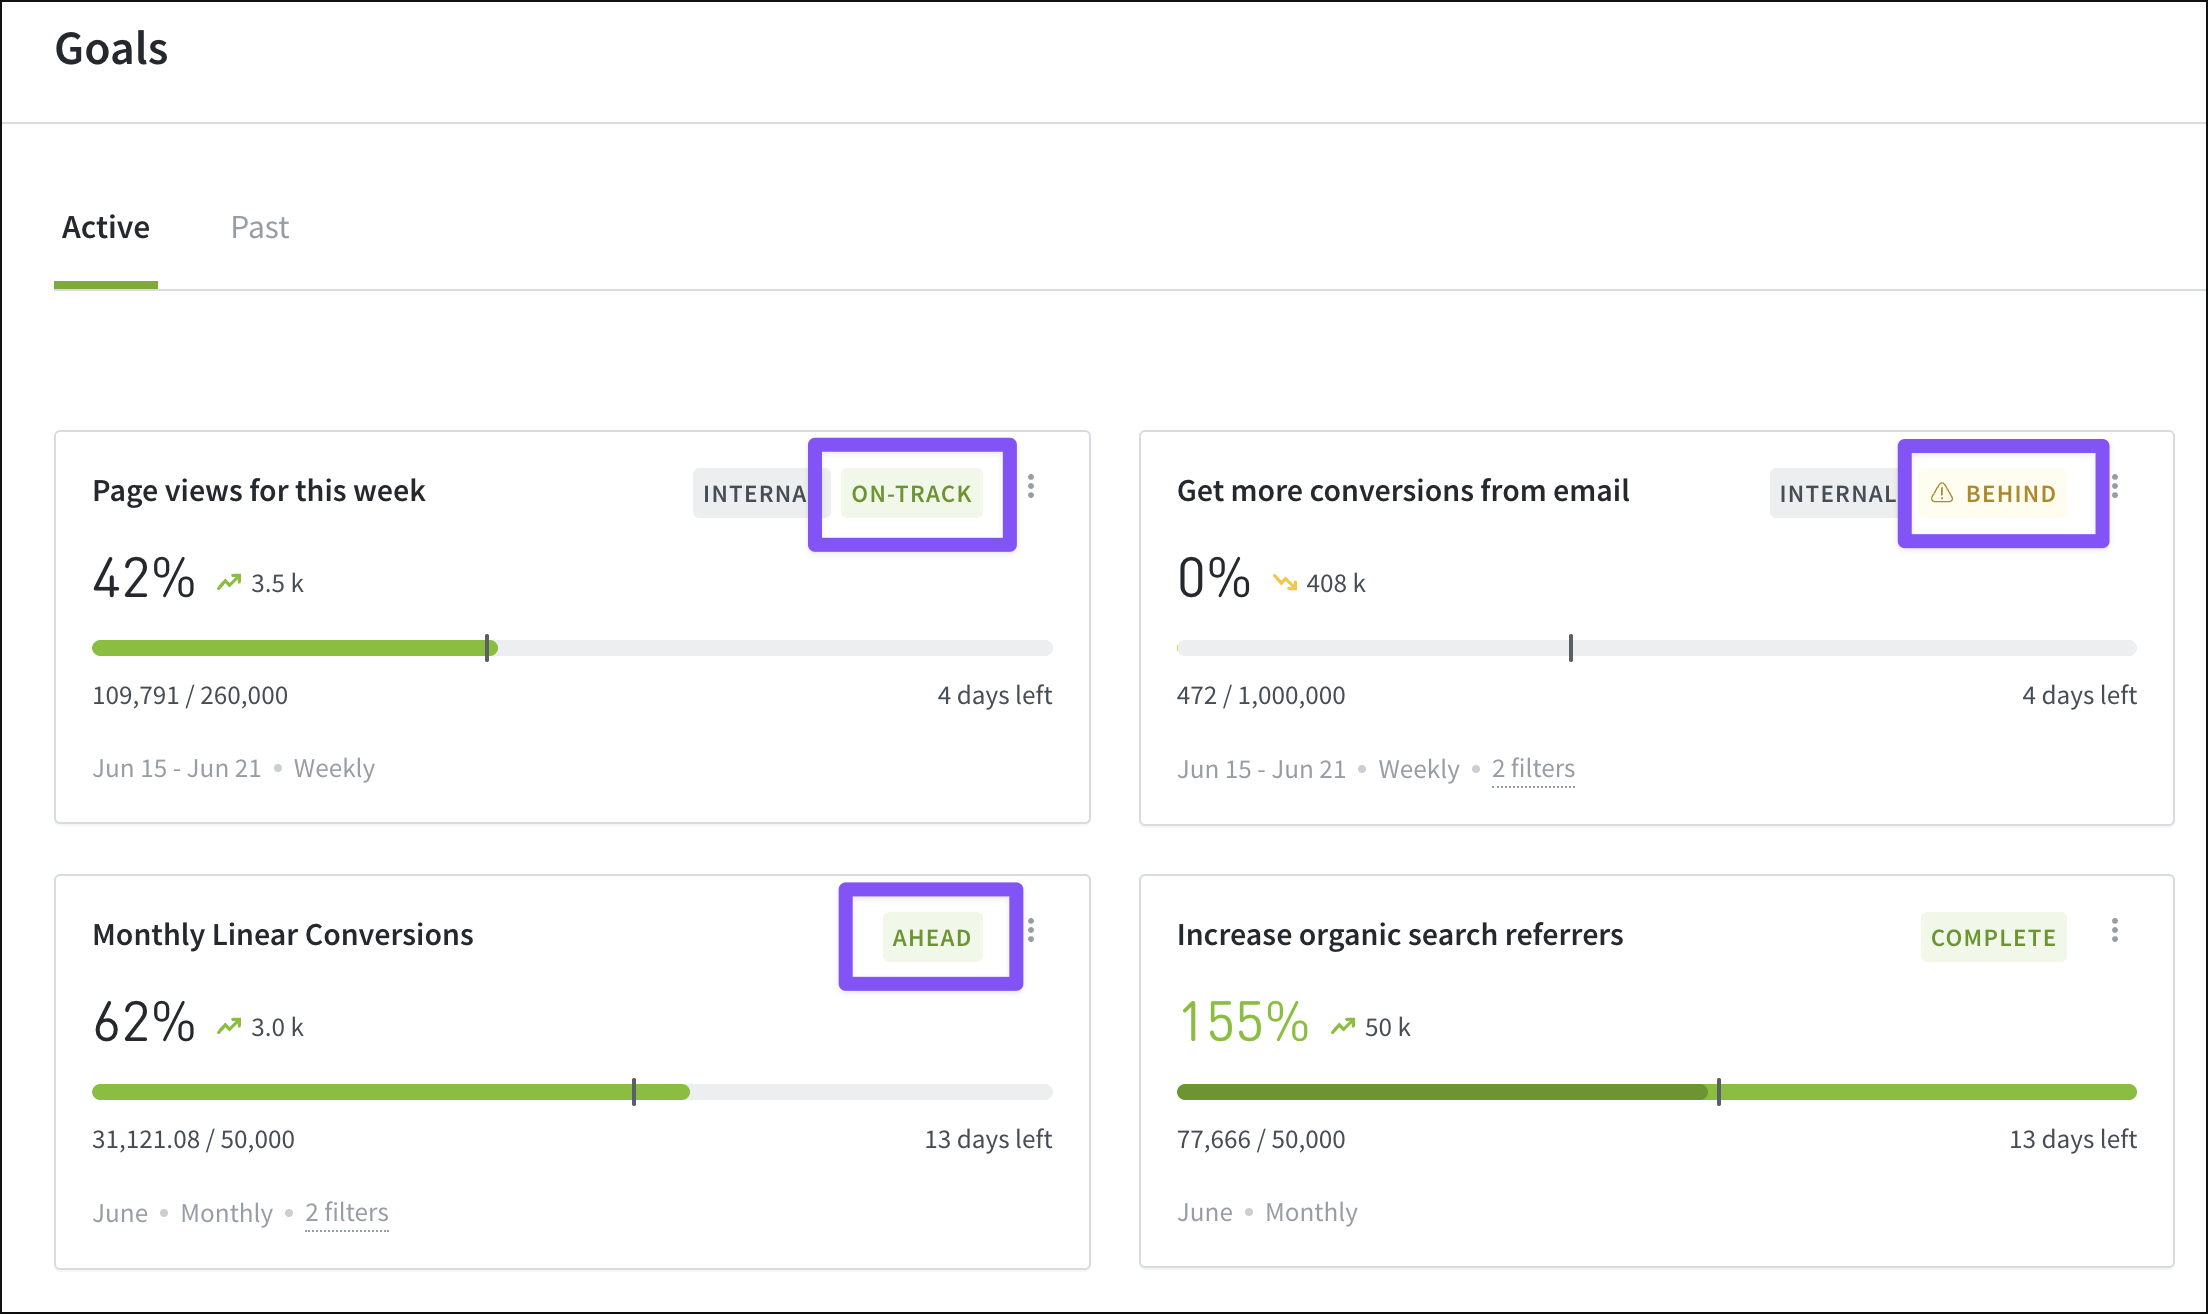
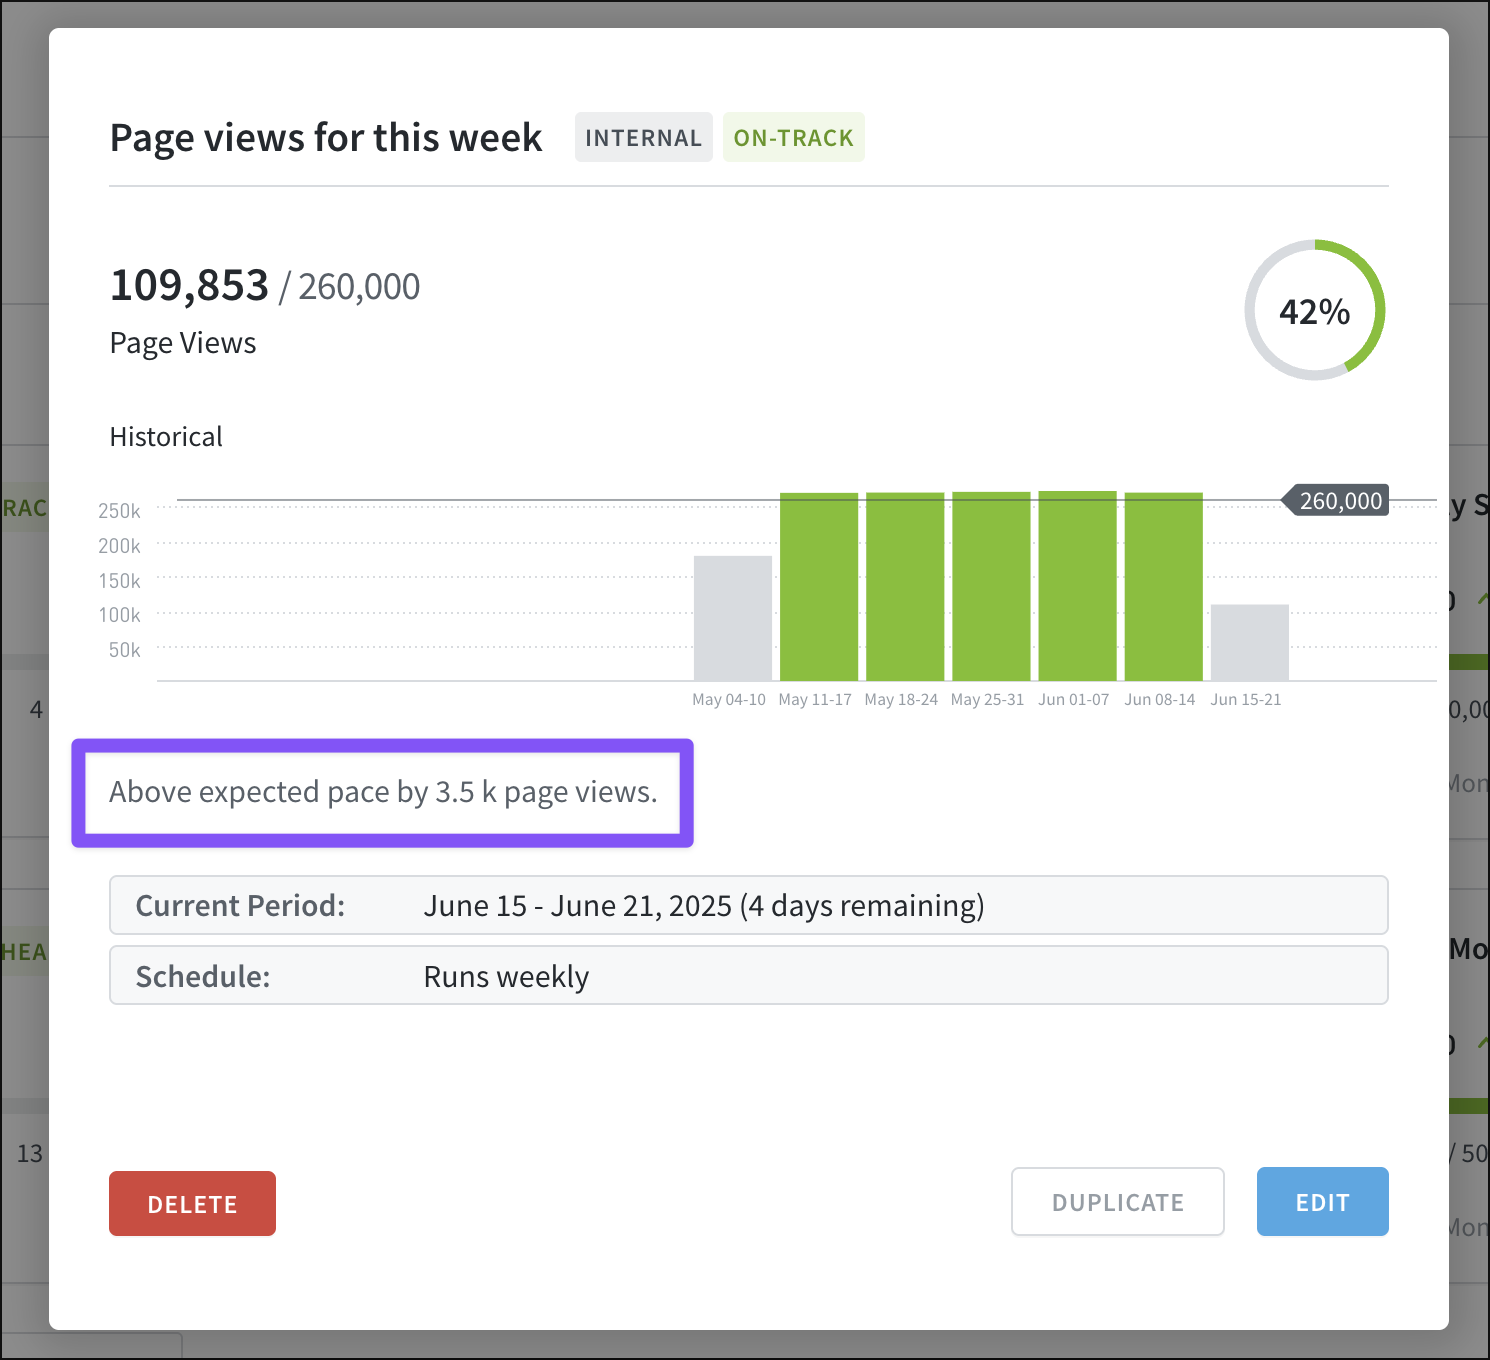
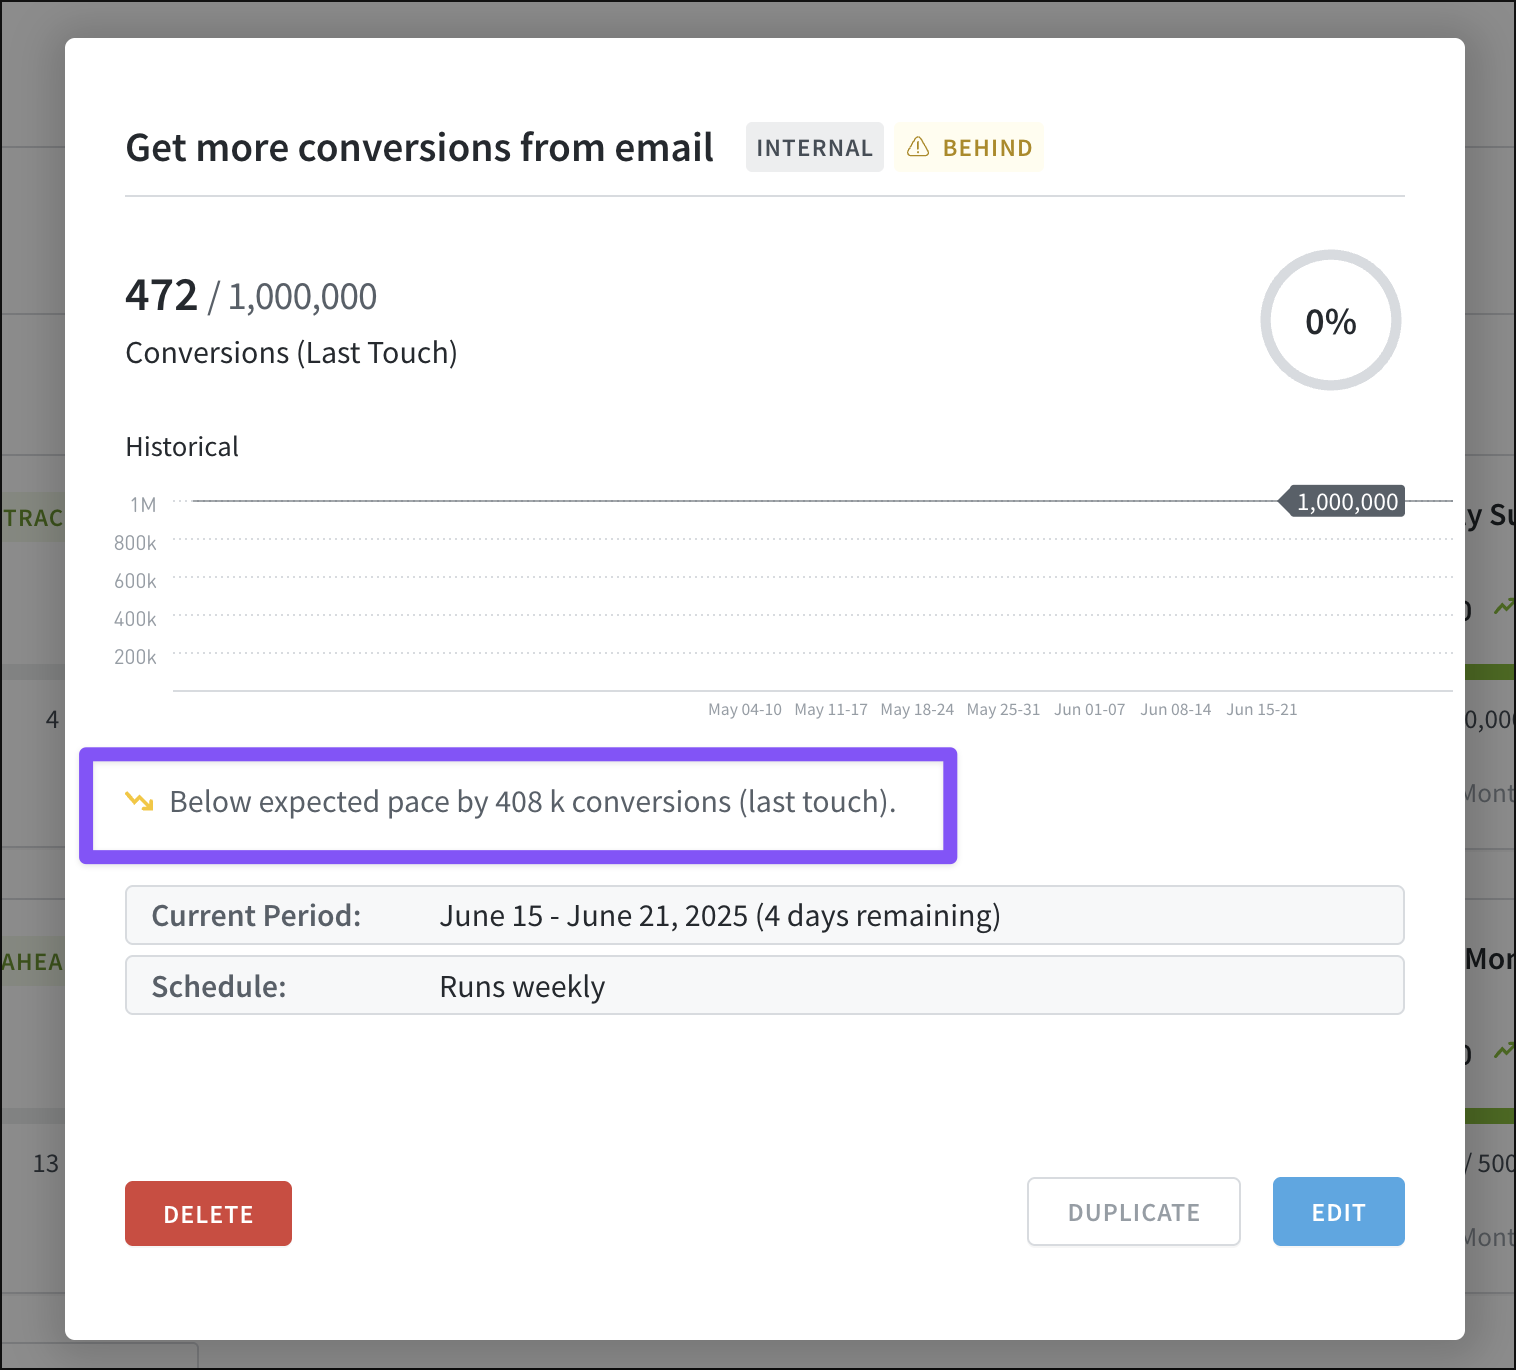
After setting up Goals, which are targets for content performance, certain calculations are used to track progress. Active goals as are labeled by Parse.ly as “Behind,” “On-Track,” or “Ahead.”
These labels are determined based on the pace, calculated as follows:
time_passed_percent = time_so_far / goal_total_time
expected_number = goal_number * time_passed_percent
pace = current_number / expected_number
If pace is lower than 0.9, the goal is labeled as “Behind.” If it’s larger than 1.1, the goal is “Ahead.” Otherwise, it’s “On Track.”
Additionally, clicking an active goal in the Dashboard opens a pop-up view with more details on that goal, including a description of its progress — either above the goal’s expected metric or below.
Calculation disagreements
Some calculations and numbers in the Dashboard may not seem to agree with each other. There are many calculations running on each Dashboard tab in real-time, so it’s possible to find some calculated results lagging behind others. In addition, not all metrics are suitable to add up to find total traffic, due to factors like the statistical “hotel problem.”
Last updated: July 08, 2025