Headline Testing Debug Panel
The Headline Testing Debug Panel is a built-in tool to help you verify that headline experiments are functioning correctly and provide detailed runtime metrics. It is useful for debugging implementation issues and understanding the performance characteristics of the Headline Testing feature.
Access the Debug Panel
To open the Debug Panel on any page where Headline Testing is active, append the following query parameter to the page URL:
?vipexp-debug=true
This displays an “Open Debug” button in the top-right corner of the page. Clicking this button opens the Debug Panel, which includes four tabs:
- Experiments
- Navigation
- Paint
- Resources
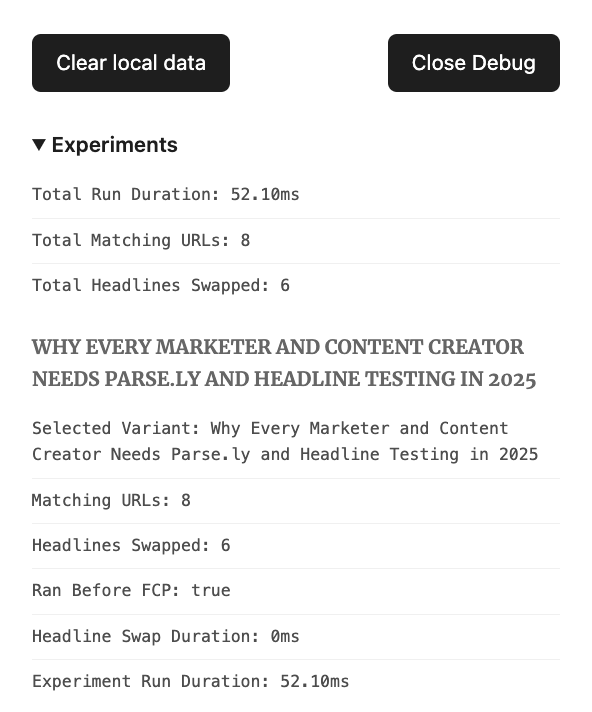
Experiments tab
The Experiments tab displays information about headline test execution and runtime behavior.
General metrics
- Total Run Duration (ms): Time taken to complete processing and headline replacement on the page.
- Total Matching URLs: Number of URLs on the page where the system detected valid experiment targets.
- Total Headlines Swapped: Number of headlines successfully replaced with a test variant.
Note
The number of “Matching URLs” may differ from “Headlines Swapped” if any URL contains no recognizable control headline.
Per experiment metrics
For each active experiment on the page, the following metrics are shown:
- Experiment Run Duration (ms): Total runtime from detection to completion of the experiment.
- Control Headline: The original headline used as the control.
- Selected Variant: The variant chosen for display based on optimization.
- Matching URL: The URL where the experiment was detected.
- Headlines Swapped: Whether the replacement was successful.
- Ran Before FCP: Whether the swap occurred before the first contentful paint.
- Headline Swap Duration (ms): Time taken to replace the headline.
Navigation tab
This tab shows:
- DOM Interactive (ms): Time from page load start until the DOM is ready for interaction.
Paint tab
This tab provides:
- First Contentful Paint (ms): Time from navigation start until the first piece of content is rendered to the screen.
Resources tab
This tab shows performance metrics related to loading the experiment bundle:
- Bundle Fetch Start Time (ms): Timestamp for when the fetch request for the experiment JavaScript bundle began.
- Bundle Load Duration (ms): Time taken to fully load and parse the bundle.
Clear local data
The Debug Panel includes a “Clear local data” button. This allows you to reset all locally stored experiment data and browser cache for the current user. Using this button will:
- Remove stored variant selections.
- Reset all active experiment states.
This feature is especially useful when debugging persistent issues or validating variant selection logic.
Last updated: June 16, 2025