Customize the Overview tab
Click the “Customize” gear icon in the upper right corner of the Overview tab of the Parse.ly Dashboard to open the Customize Overview panel.
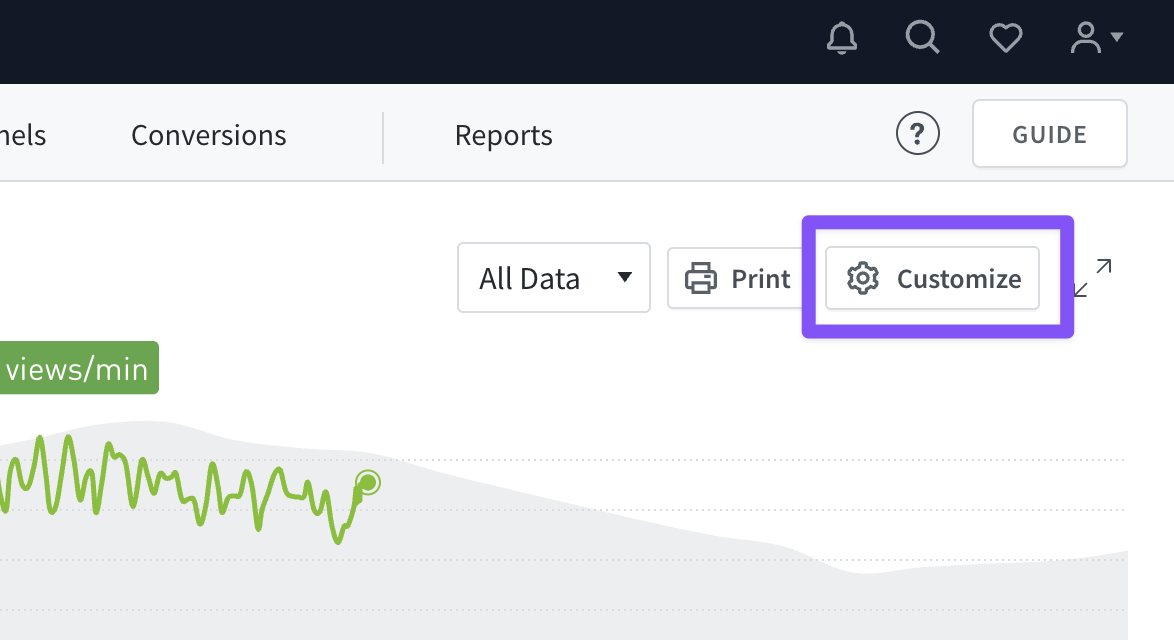
From here, choose which stats and listings to display, which are saved in the browser being used. For best results, ad blockers should be disabled for the Dashboard.
Clicking “Reset” at the bottom of the Customize Overview panel will return all settings to their defaults.
Settings for Overview and full-screen Overview are saved separately (full-screen Overview settings are saved in the URL). Changes in the Customize Overview panel won’t carry over to the full-screen version.
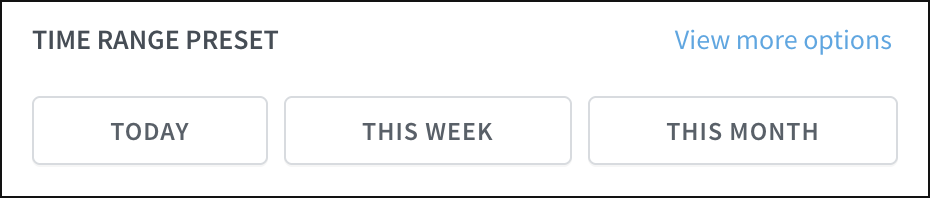
Time Range Preset
Overview defaults to today’s data (based on the team’s time zone setting). Use the Customize Overview panel to adjust the time range for the real-time graph at the top of Overview. Standard options are Today, This Week, and This Month. Clicking “View more options” allows the time range to be more finely tuned, from 24 hours to five minutes.
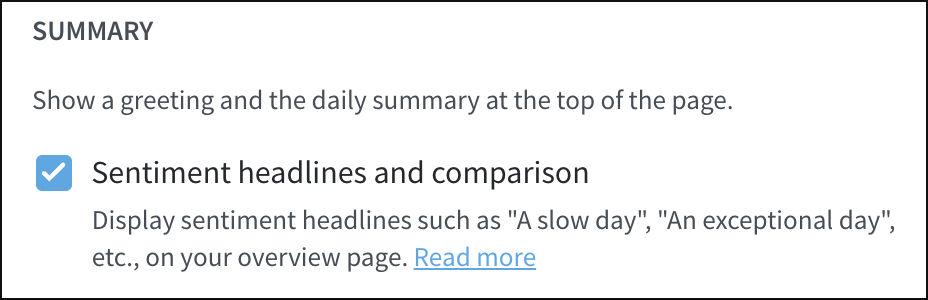
Summary
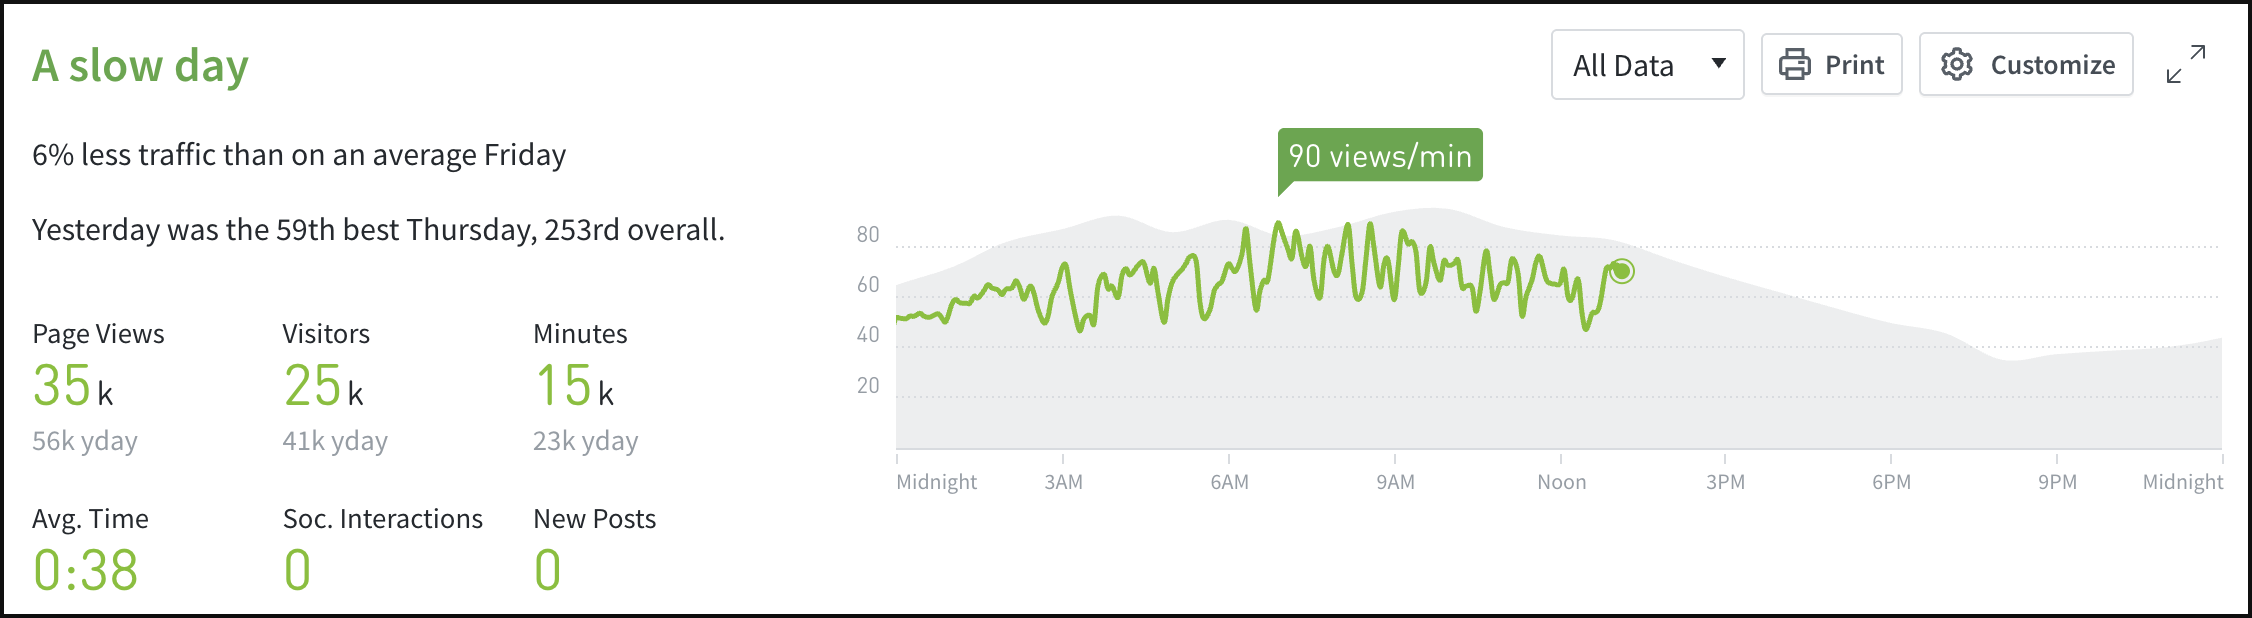
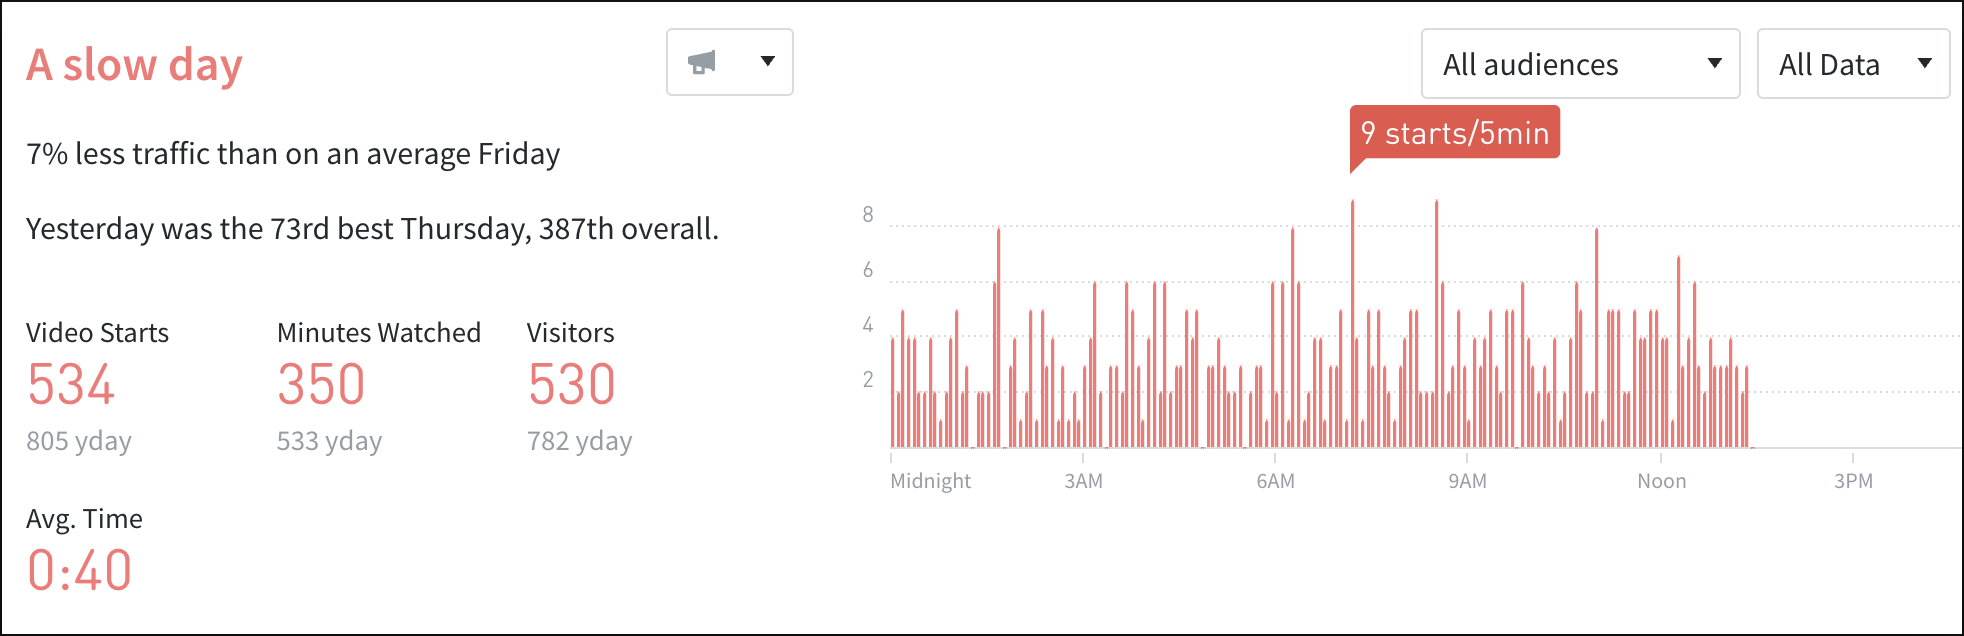
By default, a Sentiment Headline such as “An exceptional day”, “A slow day”, or something in between displays at the top of Overview to summarize traffic performance. If you don’t want to see these headlines on Overview, toggle this feature off.
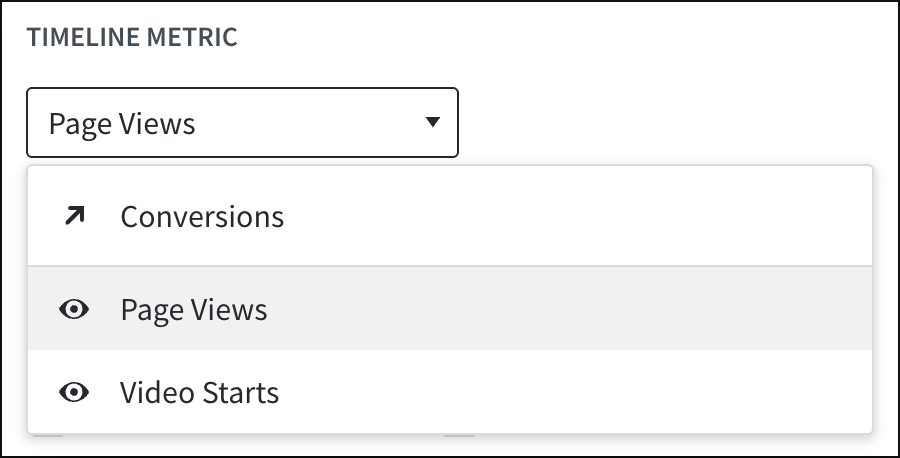
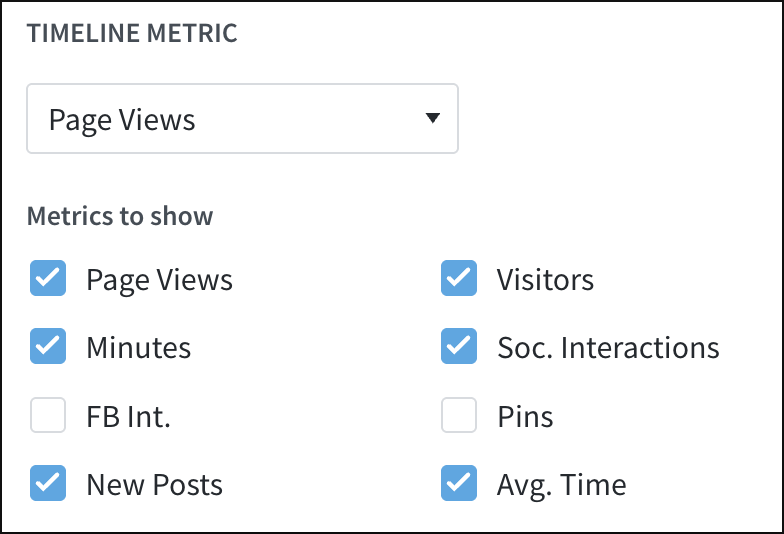
Timeline Metric
The Timeline Metric for Overview defaults to Page Views. If Content Conversions or Video Tracking have been purchased, then those are also options.
Timeline Metric: Page Views
With Page Views set as the Timeline Metric, Overview focuses on page-view and related stats:
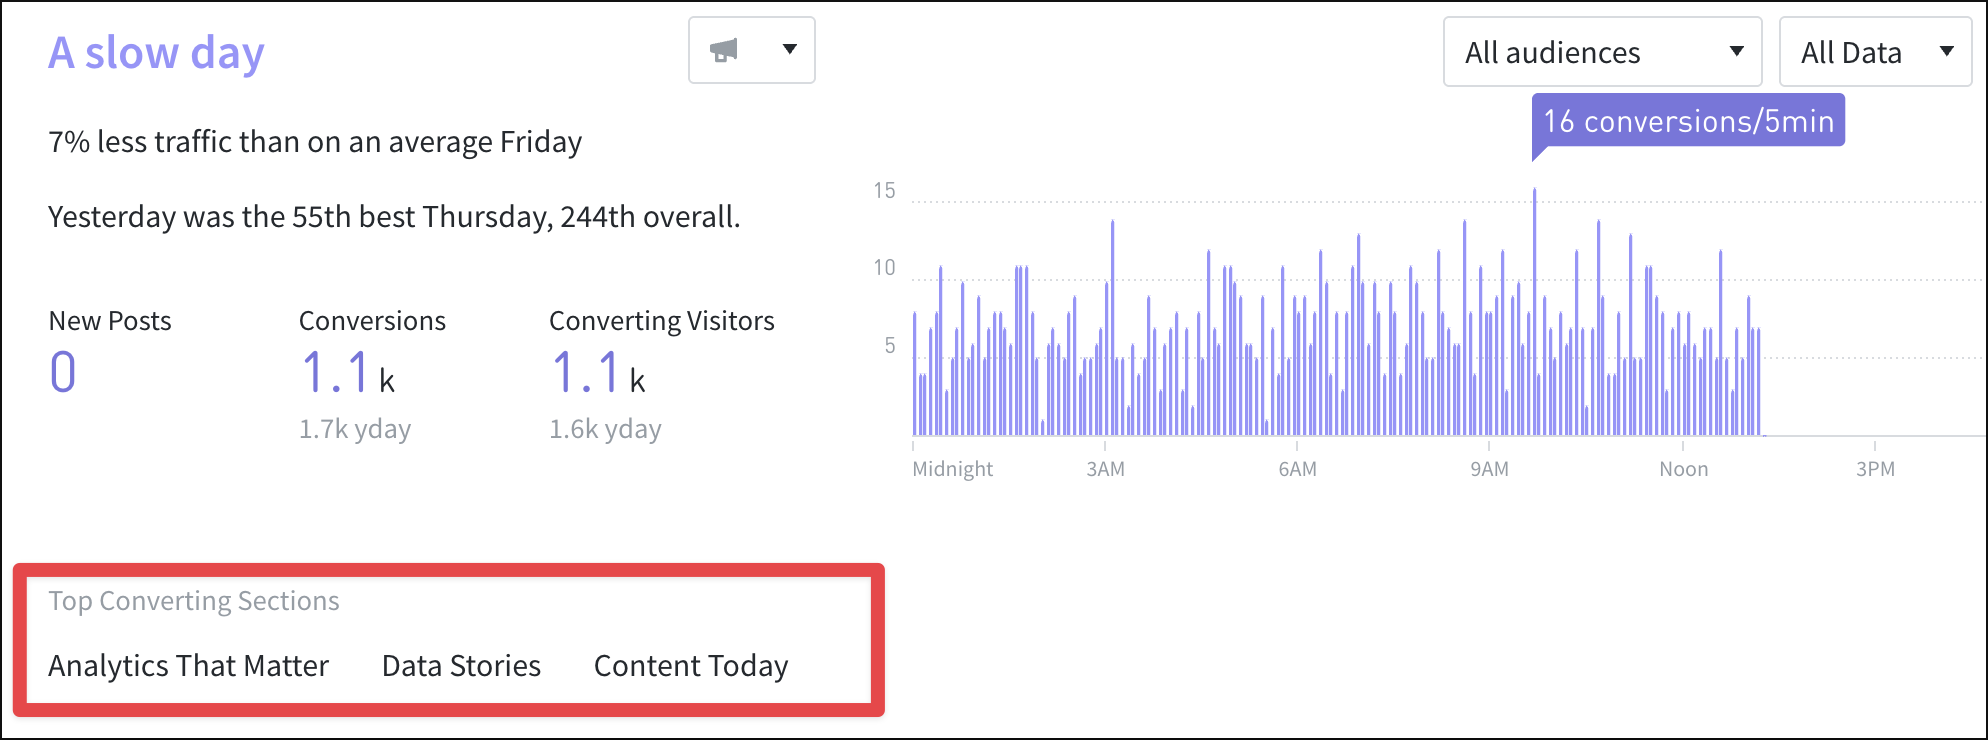
Timeline Metric: Conversions
With Conversions set as the Timeline Metric, the additional “Show Top Converting Aspect” option opens:
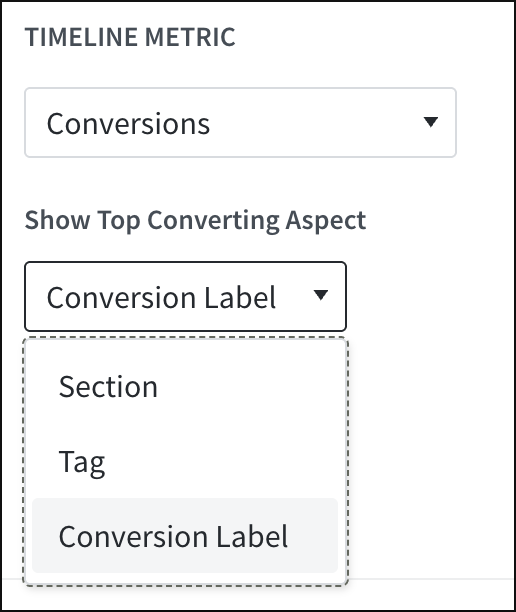
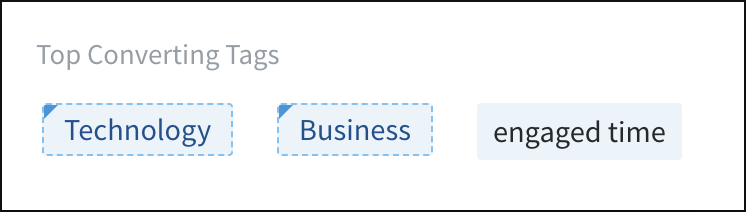
This Top Converting Aspect drop-down allows focus on top converting sections, tags, or conversion labels in Overview:

Timeline Metric: Video Starts
With Video Starts set as the Timeline Metric, Overview focuses on video starts and related stats:
Metrics to show
Enabled metrics for the chosen Timeline Metric can be checked off to display in Overview.
Top Google Search Keywords
If Google Search Console has been integrated with the Dashboard, toggle the Top Google Search Keywords setting to display top keywords below Overview’s top section.

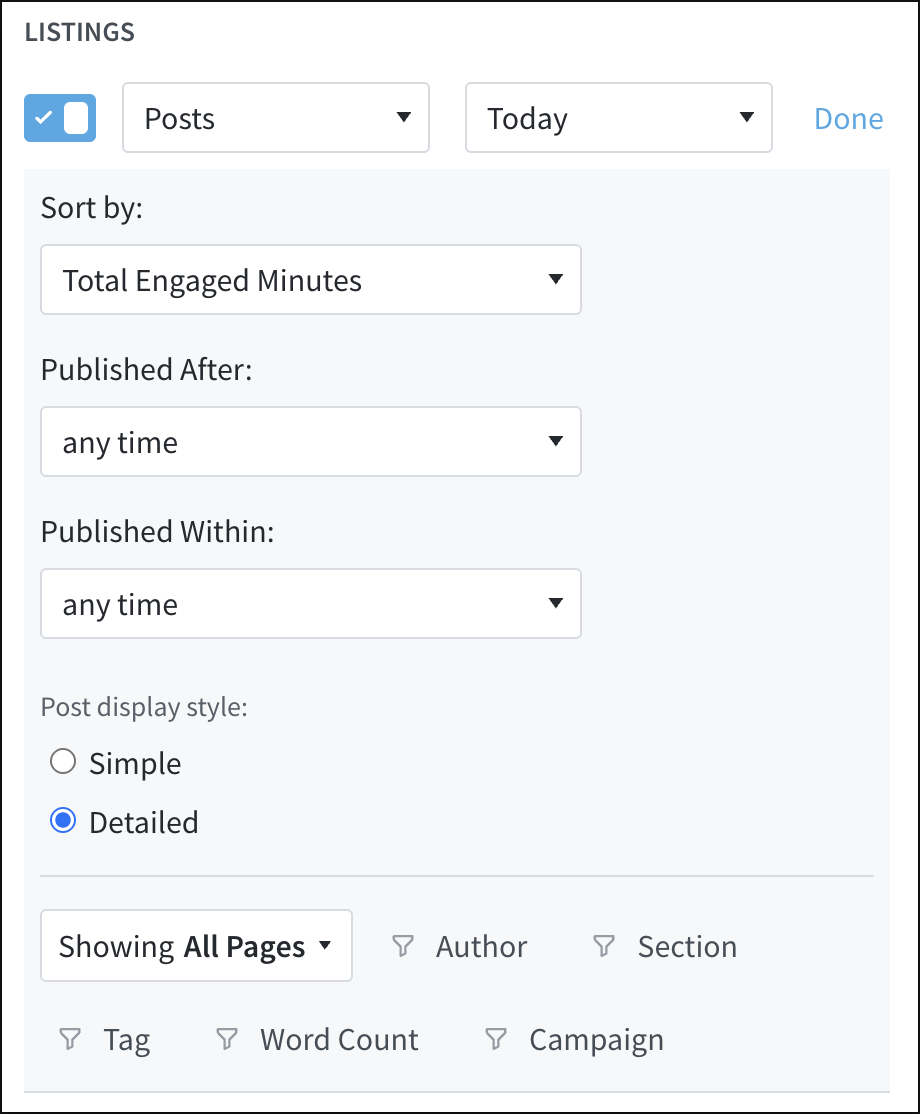
Listings
Overview displays two columns of top-performing posts by default. There are many customization options.
- Select between one and three columns of listings to display on Overview.
- For each listings column, select which metric you’d like to use.
- Select a time period between five minutes and one month.
- Select “Customize” to refine each listing column further if needed.

Last updated: July 17, 2025