Using the Overlay bookmarklet
Using the Overlay bookmarklet, easily evaluate slot or post performance to optimize click-through rate on homepages, as well as see data on individual posts.
Overlay tracks slot performance by monitoring the exact location on a webpage that a reader clicks to get to an article, then storing that information in a cookie. When a click occurs, Overlay determines the path of the link that’s been clicked — its position on the page relative to other HTML elements — and stores that in Parse.ly servers.
The bookmarklet then displays badges in your browser by doing the reverse: retrieving data from Parse.ly servers, then matching the element on the page with the path that was stored, along with traffic data for that post’s URL.
Overlay has two configuration modes: tracking slots or tracking posts. Slot tracking, the default, displays metrics on how posts perform in specific positions on a page. Post tracking displays metrics like engaged time, referral traffic, and visitor breakdowns for each unique URL linked on the page.
Note
If you would prefer Overlay to track posts instead of slots, contact Parse.ly Support at support@parsely.com.
Track clicks on non-post pages
On non-post pages, such as homepages and section pages, use Overlay to optimize click rates by seeing how stories perform in certain page positions (or slots).
Adjust the metric that Overlay uses in the panel’s drop-down menu.
Overlay metric options include:
| Clicks per minute | Click-through rate |
| % of page clicks | Change in click-through rate* |
| Change in % of page clicks* | Historical click-through rate* |
| Historical % of page clicks* |
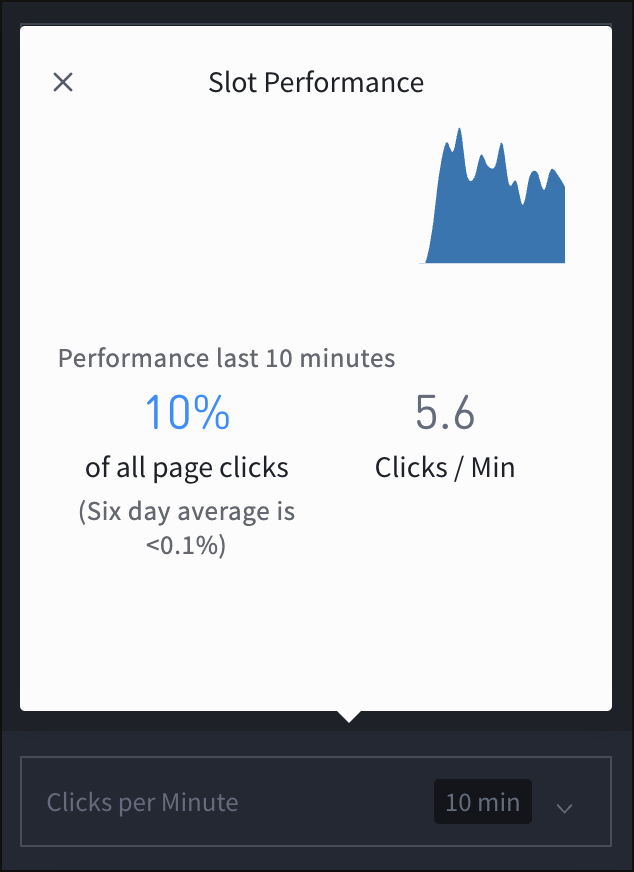
Opening Overlay on a non-post page displays badges on the page’s slots that use the selected metric. Clicking a badge on the page or a post title in the Overlay panel opens a slot performance pop-up with more details:
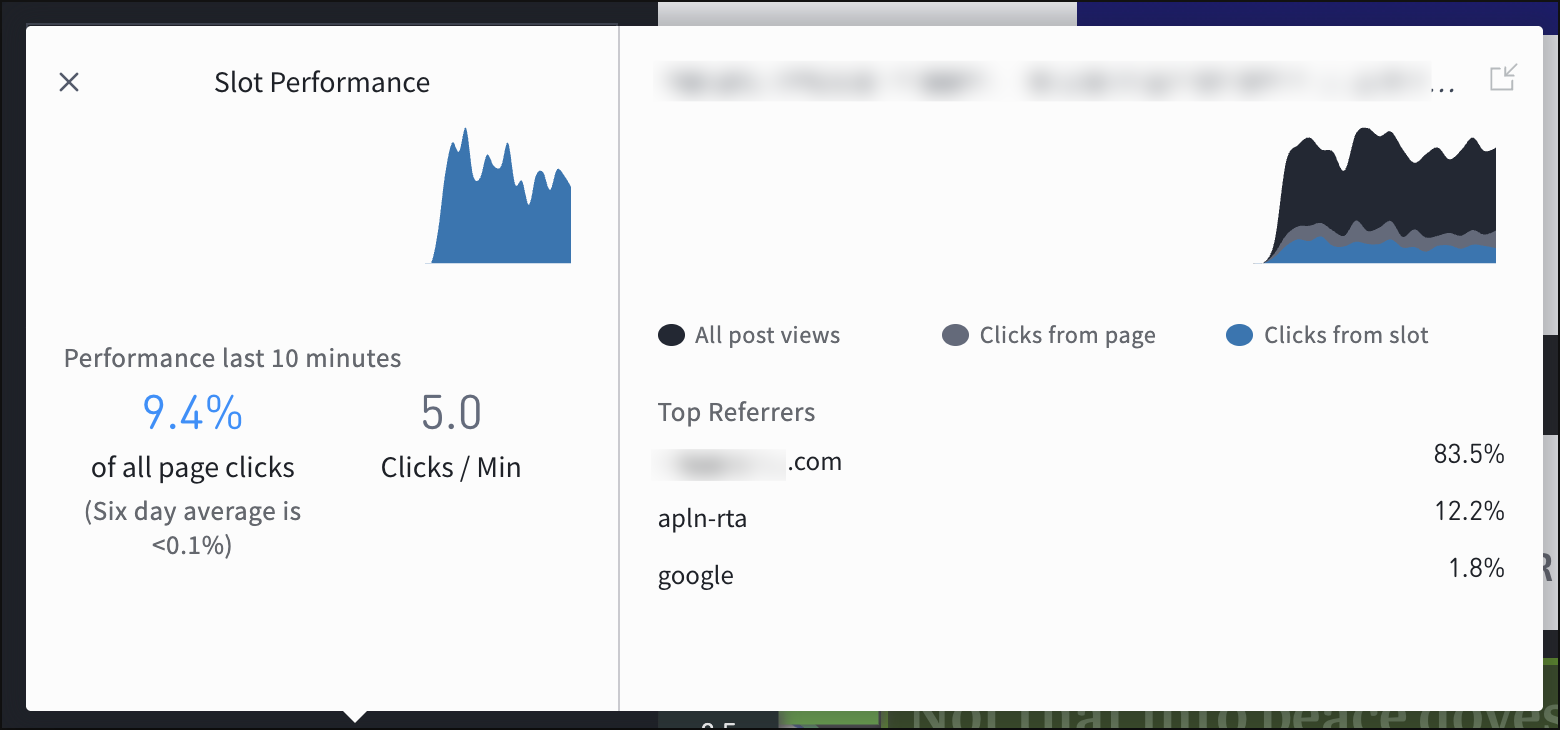
Hovering over the slot performance pop-up expands it to include details on the current post occupying that slot:
Post details in Overlay
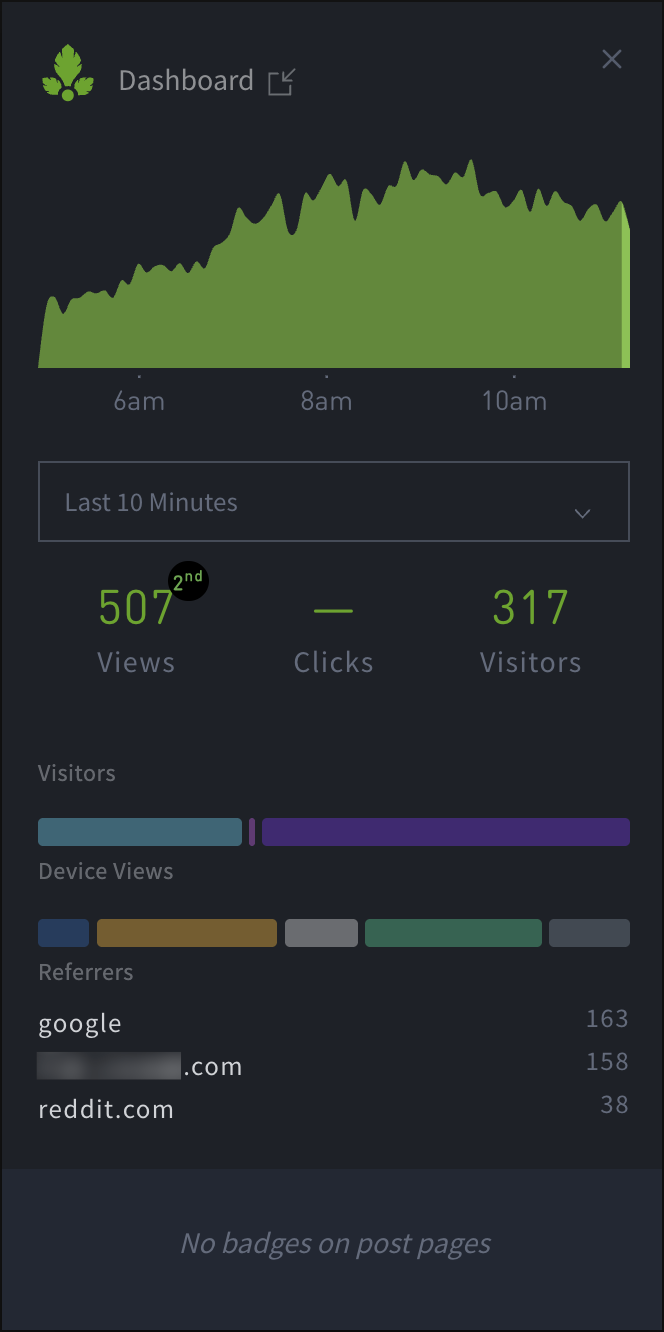
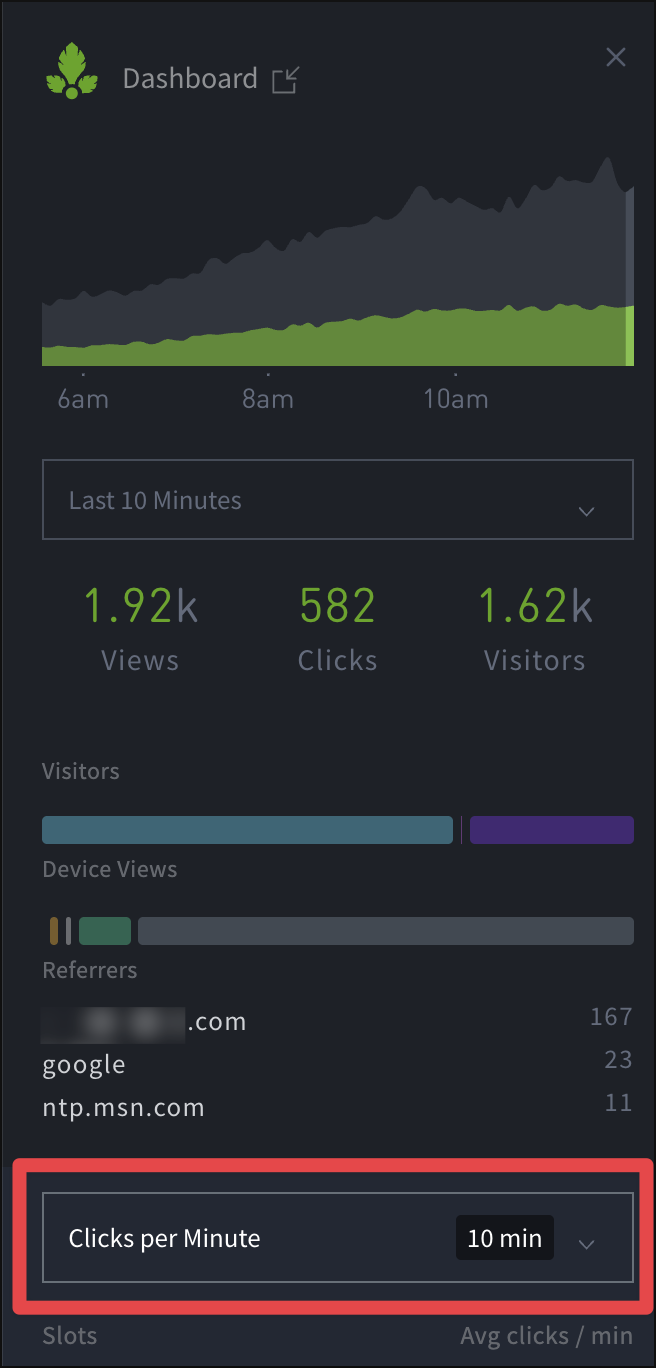
When viewing the Overlay panel on a post page, it displays:
- A graph of the post’s page views over the past 6 hours.
- A time period drop-down menu that affects the rest of the metrics shown in Overlay. Adjust from 10 minutes to 6 hours.
- Factoids to shed light on the post’s engagement metrics.
- Visitor and device breakdowns — hover over these to see more details.
- The top 3 referrers to the post.
Overlay does not display badges on post pages.
Last updated: July 17, 2025