Parse.ly Usage
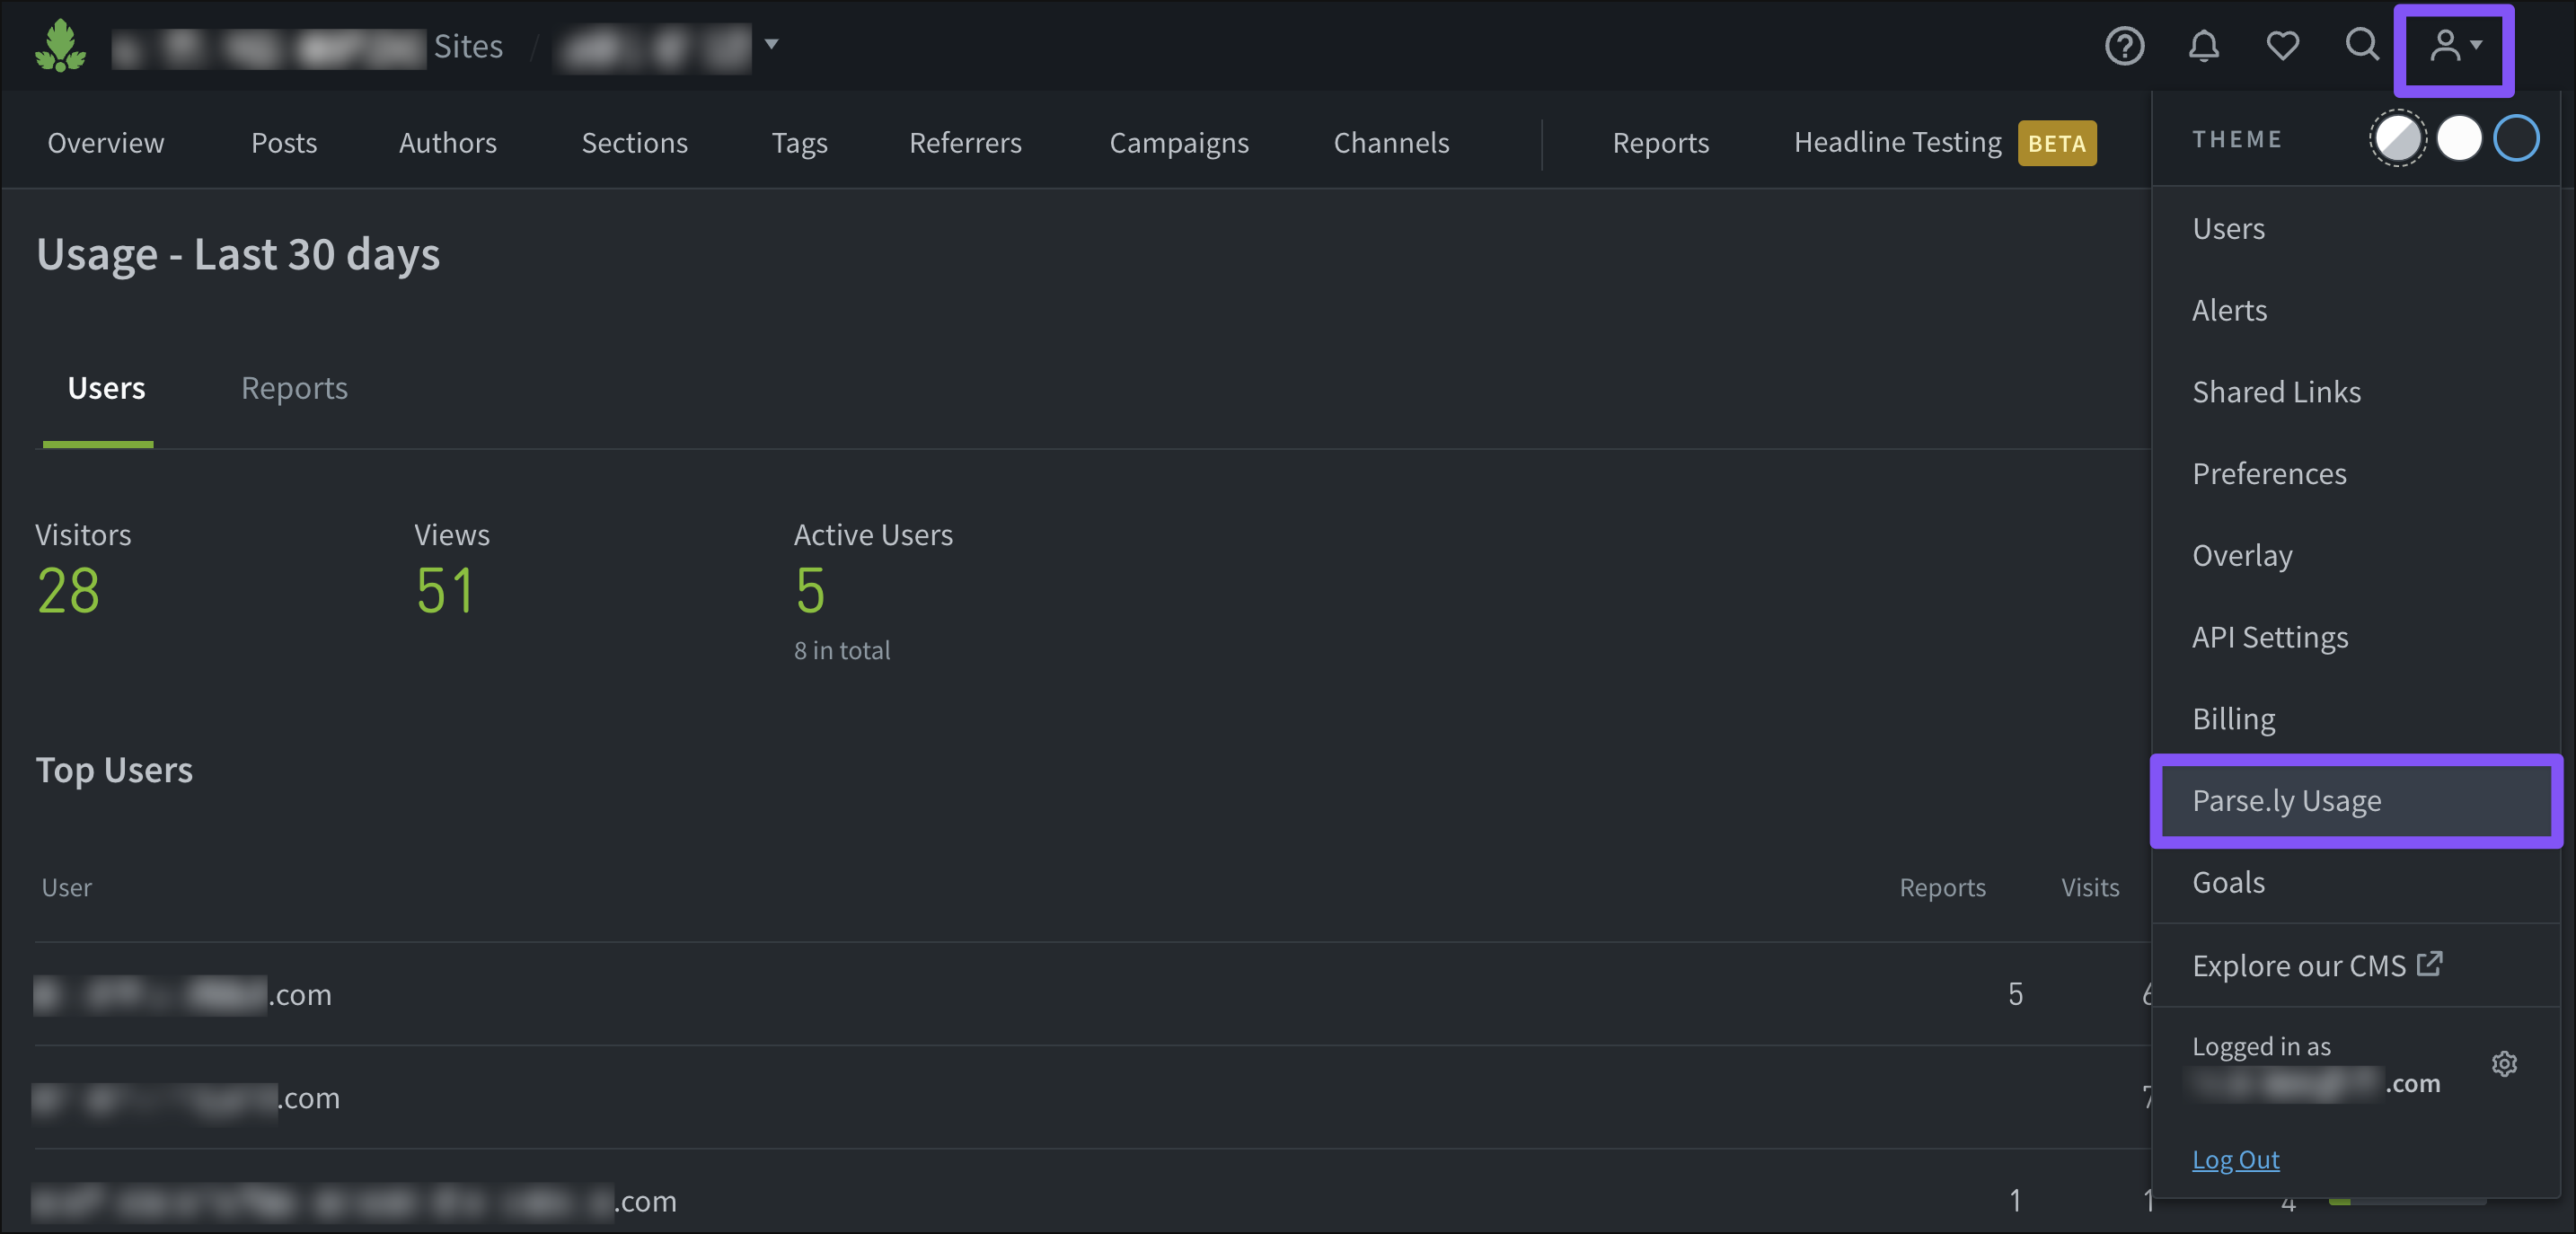
The Parse.ly Usage page is available for admins in the account menu to monitor use of the Parse.ly Dashboard. This page provides insights on how a team used the Dashboard and reports in the last 30 days.
Note
The Parse.ly Usage page is only available in the account menu when admins are viewing a single site in the Dashboard, not Network Rollup.
Users
Under the Users tab on the Parse.ly Usage page, admins can see the total number of Dashboard visitors, views, and active users in the last 30 days.
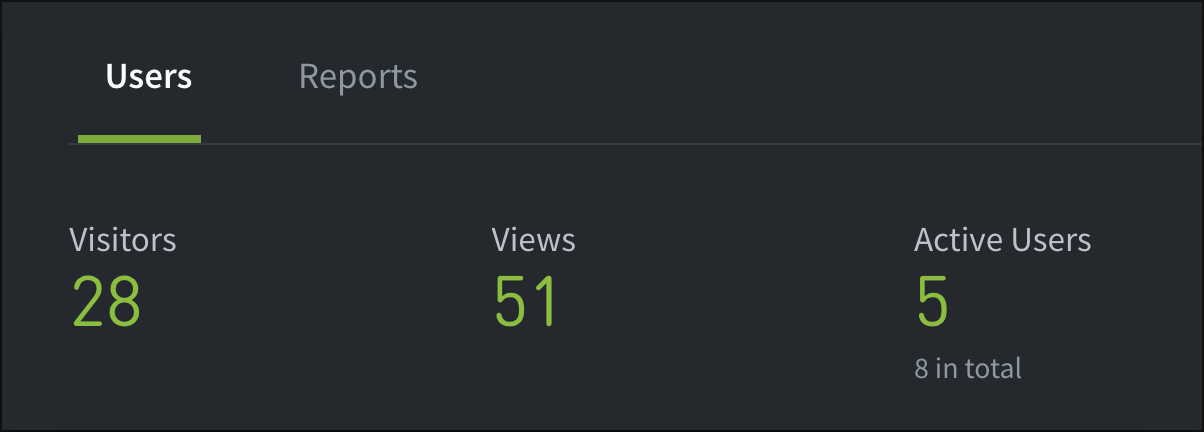
Visitors: The number of times the Dashboard was logged into by an account user.
Views: The number of Dashboard tabs or pages that were viewed by visitors.
Active Users: The number of users active in the Dashboard vs. the total number of registered users.
The Users tab also provides a list of top users and details the number of reports they ran, visits they made to the Dashboard, and views around the Dashboard.
The “Most Visited Pages” section lists the Dashboard tabs and pages in descending order of number of visits.
Reports
The Reports tab shows admins how many reports were run by users over the last 30 days, including exports, one-off reports, and scheduled reports.

This tab also lists the most popular type of report based on the number of times each was run. The information in this tab can be exported using the “Export” button, which downloads an XLSX file.
Last updated: July 24, 2025