Test Integration
By this point, you should have installed the Parse.ly tracking code. Now it’s time to test your integration. We will review each of the events trigged by our script.
We’ve written this article with all audiences in mind so that everyone can see what’s happening for themselves.
Getting Started
Open DevTools
Regardless of the event you’re testing, they process always begins by opening your browser’s Web Development Tools with any of the following methods. Alternatively, you can use a tool like Omnibug. For Dev Tools:
- Use a keyboard shortcut
- Windows/Linux
Ctrl+Shift+IorF12for most browsers and full-size keyboards
- Mac
Cmd+Option+I(Mac) or-
Fn+F12for most browsers and compact keyboards
- Windows/Linux
- Use a context menu
- Right click anywhere on the page in your browser
- Click “Inspect” or “Inspect Element”
- Find DevTools in your browser menu
- Click the 3 vertical dots or 3 horizontal lines in the upper right corner
- Look for any combination of “Tools” “Web” Developer”
- Safari users will need to first enable these tools in menu: Safari > Preferences > Advanced
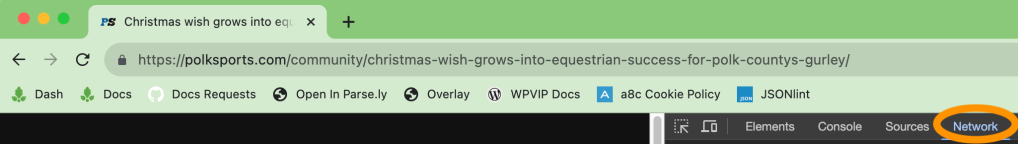
Navigate to DevTools > Network
With DevTools open, look for a “Network” tab and click to open it. We’ve circled the Network tab in orange in the lower-right corner of the screenshot, below.
Pageview
Trigger the pageview
By default, we send a pageview event whenever someone loads your page. To verify that we’re doing this on your website, perform the following:
- Navigate to the Network tab of DevTools (if you haven’t done so already)
- In the filter field, type
action=pageview - Navigate to a url on your website or refresh the page, if you’re already on the url of interest
Examine the pageview
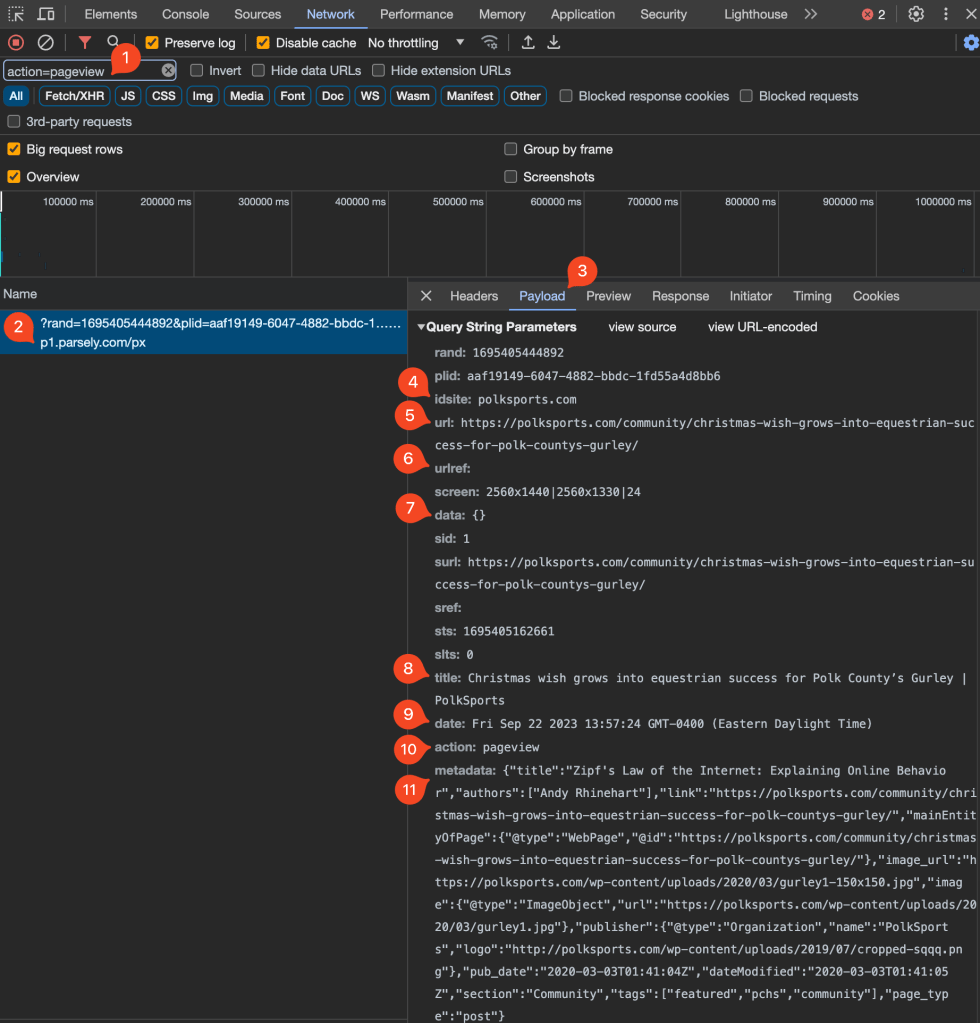
By now, you should have seen one (and only one) item appear in the list. Let’s review the screenshot below for expected results and what they mean:
- The filter field where you type
action=pageview - The list of network events. By using the filter, we have fewer distractions.
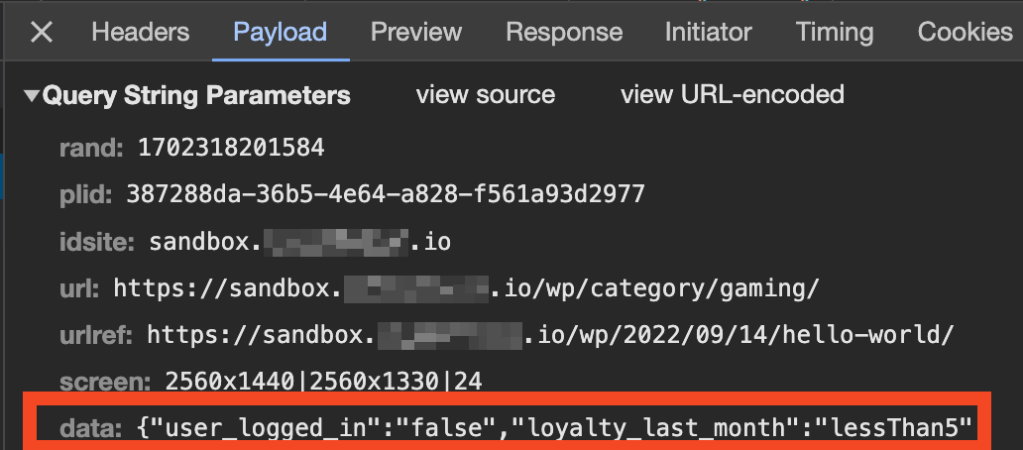
- Click on the “Payload” tab to see the pertinent information
- idsite – this value should match your Parse.ly Site ID.
- If you see
genericconfigfreethen it means that you have the tracking script on your page but that you are using an invalid Site ID. Only use Site IDs provided to you by Parse.ly Support. - Ensure you’re not using your sandbox Site ID in your production environment and vice versa
- If you see
- url – the url that triggered the pageview. Must be a “full url” not a relative path.
- urlref – the referring url. This will be blank if the reader manually typed in the url into their browser. Must be a “full url” not a relative path.
- data – a place where you can send custom audience segment data to Parse.ly (if purchased)
- title – the headline that will appear in your Parse.ly Dashboard
- date – the publication date that will appear in your Parse.ly Dashboard
- action – the event that Parse.ly triggered on your site
- metadata – the metadata that you’re sending to Parse.ly that we will display in your Dashboard
Next Steps
- If you encountered something unexpected, please review the Troubleshooting section.
- If you’ve successfuly tested pageviews, then you’ll likely want to proceed to the next step of the integration process, i.e., sending metadata.
Troubleshoot
| Symptom | Potential Cause | Remedy |
|---|---|---|
| Nothing appears in the list | The tracking script is not on the page | If using the wp-parsely plugin, reconfigure Track Post Types As settings If using the plugin on a multisite, ensure that you’ve installed on all sites If the url is on a subdomain hosted by a third-party, contact them to add the tracking code |
| No navigation since loading DevTools | Navigate to a new page Refresh the page | |
| There’s a typo in the filter | Erase the filter and look again | |
| More than one item appeared in the list while navigating | The tracking script is loaded more than once | If using GTM and wp-parsely plugin, set the plugin Disable JavaScript setting to YesExamine your code and look for the tracking code. Try searching with for cdn.parsely.com/keys. Eliminate the source of the extra script(s). |
idsite says genericconfigfree | Invalid Site ID | Check the spelling of your Site ID in the tracking script. Only use Site IDs provided by Parse.ly |
| Triggered pageviews don’t appear in Dashboard | Domain mismatch | Ensure the Site ID matches the domain that’s sending pageviews. If you’re using the sandbox, provide testing domain(s) to Support for allowlisting. |
| Filtered view | Modify your Dashboard filter(s) to view Page Type: All Pages |
If you encountered an unlisted symptom or the corresponding remedies did not solve your problem, please contact Support.
Heartbeat
If pageviews are working, then there shouldn’t be a need to test heartbeats. But we’re not going to stop you! To see Parse.ly heartbeats on your site, perform these steps:
- Navigate to the Network tab of DevTools
- In the filter field, type
action=heartbeat - Navigate to a url on your website
- Open a new tab in your browser
- Click on the original tab used in Step 3, you should see the heartbeat event in DevTools
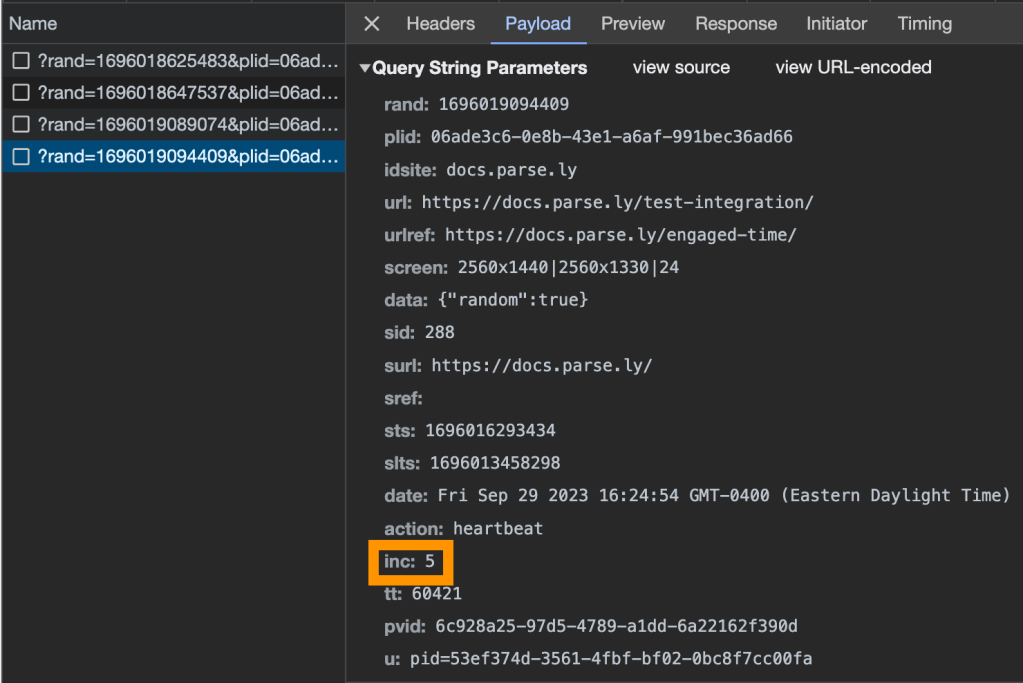
- Click on the heartbeat event
- If needed, click the “Payload” tab to see the pertinent information
- Review the
incvalue – this is the number of seconds that elapsed while the reader was engaged with your page
Want to learn more about how Parse.ly measures engaged time? Read here. Do you want to customize engaged time behavior? Read here.
Videostart
Prerequisites
- Video analytics is a paid, add-on, feature. If you haven’t purchased this feature, contact your Relationship Manager to schedule a demo.
- Ensure that you’ve completed the basic integration that includes:
- Installing tracking code
- Sending metadata
- Ensure that you’ve completed the video analytics integration instructions
- Navigate to the Network tab of DevTools
- In the filter field, type
action=videostart - Navigate to a url on your website that contains your video
Trigger the videostart
- Complete the prerequisites in order to receive the videostart
- Play the video
- If your video contains pre-roll advertising, the videostart will trigger at the beginning of pre-roll by default.
- When integrating video, it’s up to your development team to decide when the videostart should trigger. Most of our customers trigger the videostart after pre-roll.
Review the videostart
Videostarts are similar to pageviews with the most notable difference being the metadata.
Video Heartbeat
If videostarts are working, then it’s unlikely that you’ll need to test video heartbeats. To see vheartbeats on your site, perform these steps:
- Navigate to the Network tab of DevTools
- In the filter field, type
action=vheartbeat - Navigate to a url on your website
- Play a video on your site
- Open a new tab in your browser
- Click on the original tab used in Step 3, you should see the vheartbeat event in DevTools
- Click on the vheartbeat event
- If needed, click the “Payload” tab to see the pertinent information
- Review the
incvalue – this is the number of seconds that elapsed while your visitor was playing your video- Skipping ahead or rewinding the video does not affect our measurement of “minutes watched”.
- Read more about engaged time here.
Conversion
Prerequisites
- Conversions tracking is a paid, add-on, feature. If you haven’t purchased this feature, contact your Relationship Manager to schedule a demo.
- Ensure that you’ve completed the basic integration that includes:
- Installing tracking code
- Sending metadata
- Ensure that you’ve completed the conversions integration instructions
- Navigate to a url on your website that contains a converting event
Debug mode (not logged to your Dashboard)
When Parse.ly receives a conversion event, the event becomes part of a permanent record. To avoid skewing conversions data with tests, consider using debug mode. To test in debug mode, follow these instructions:
- Complete the conversions prerequisites
- Navigate to the Console tab of DevTools
- Enter
PARSELY.config.customizations.debug = true;and hitreturn- Expected result is
true Uncaught ReferenceError: PARSELY is not definedmeans that Parse.ly is not loaded on this page; ensure nothing prevents the tracking code from loading
- Expected result is
- Trigger the converting event (load, submit, click)
- Expected result will look similar to this:
Debug: Conversion event would have been sent with type "" and label "". - No response means that the conversion did not trigger as expected. See the troubleshooting section.
- Multiple conversions per triggering event is a sign of an integration problem. See the troubleshooting section.
- Expected result will look similar to this:
Testing real conversions (logged to your Dashboard)
Pro Tip
Consider using your sandbox instead of affecting production data
- Navigate to the Network tab of DevTools
- In the filter field, type
action=conversion - Trigger the converting event (load, submit, click)
- Click on the conversion event
- If needed, click the “Payload” tab to see the pertinent information
- Review the following values in the data object:
_conversion_type_conversion_label
Troubleshooting
Conversions that do not fire
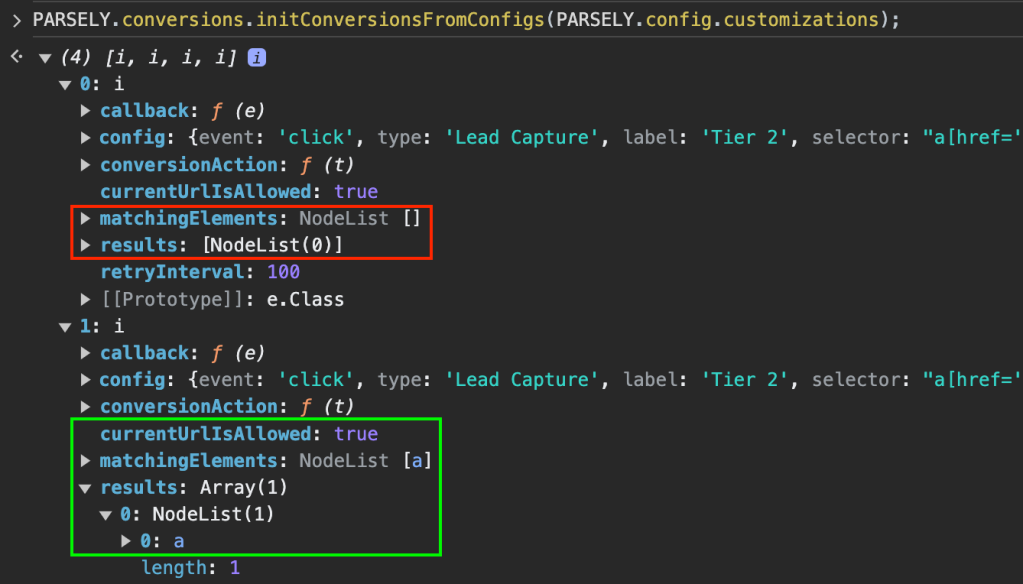
- If you’re using Parse.ly-managed conversions, you may view their setup by running
PARSELY.conversions.initConversionsFromConfigs(PARSELY.config.customizations);. If you have a self-managed conversion, please contact your development team for troubleshooting. - You should see an array. Expand the array to examine the contents. There should be an object for each of your Parse.ly-managed conversions. Find the conversion that you were expecting by looking at each
label. - Once you’ve found the desired conversion, ensure
currentUrlIsAllowedistrue. If this isfalsethen means that we’ve restrictedconfig.allowedUrlsin such a way that it prevents this conversion from firing for this url pattern. Please contact Support to request a different url pattern. - Check to see if
matchingElementscontains a populated or emptyNodeList. If theNodeListis empty, then it indicates thatconfig.selectordoes not match any of the elements on this url. Please contact Support to request a selector that matches the desired conversion-triggering element.
Multiple conversions per triggering event
In Chrome DevTools, you may see an encircled number next to the console message. This indicates that the console sent the same message multiple times. If you intended to trigger one conversion and you see any encircled number here, then that is unwanted.

In this case, look to see if you’ve accidentally rendered the Parse.ly Tracking Code multiple times on your page. It’s possible to see a single tracking script in your source code, but multiple tracking scripts getting rendered when you inspect the page.
Custom Audience Segments
Prerequisites
- Audience Segmentation is a paid, add-on, feature. If you haven’t purchased this feature, contact your Relationship Manager to schedule a demo.
- Ensure that you’ve completed the basic integration that includes:
- Installing tracking code
- Sending metadata
- Ensure that you’ve completed the custom audience segments integration instructions
- Navigate to the Network tab of DevTools
- In the filter field, type
action=pageview
Trigger a pageview (containing segment info)
- Navigate to a url on your website that contains the Parse.ly tracking code
- Examine the payload of the pageview
- Review the value of the data key and ensure it reflects the expected information
Alternative
If you missed the pageview and want to see what data came with it, enter PARSELY.lastRequest.data into the developer console.

Custom Events
Prerequisites
- The Data Pipeline (DPL) is a paid, add-on, feature where you can see custom events. Custom events are not visible in the Parse.ly Dashboard. If you haven’t purchased DPL, contact your Relationship Manager to schedule a demo.
- Ensure that you’ve completed the basic integration that includes:
- Installing tracking code
- Sending metadata
- Ensure that you’ve added custom events using our Dynamic Tracking instructions.
- Navigate to the Network tab of DevTools
- In the filter field, type
action=custom
Sending the Custom Event
- Navigate to a url on your website that contains your custom event
- Trigger the custom event in accordance with your design
- View the event in DevTools
Last updated: December 12, 2023